Job Trends
The Clusters > Job Trends tab plots the trends of all the jobs running in a cluster for a specific period. These trends can be filtered using any of the following Group By options:
State
Application type
User
Queue
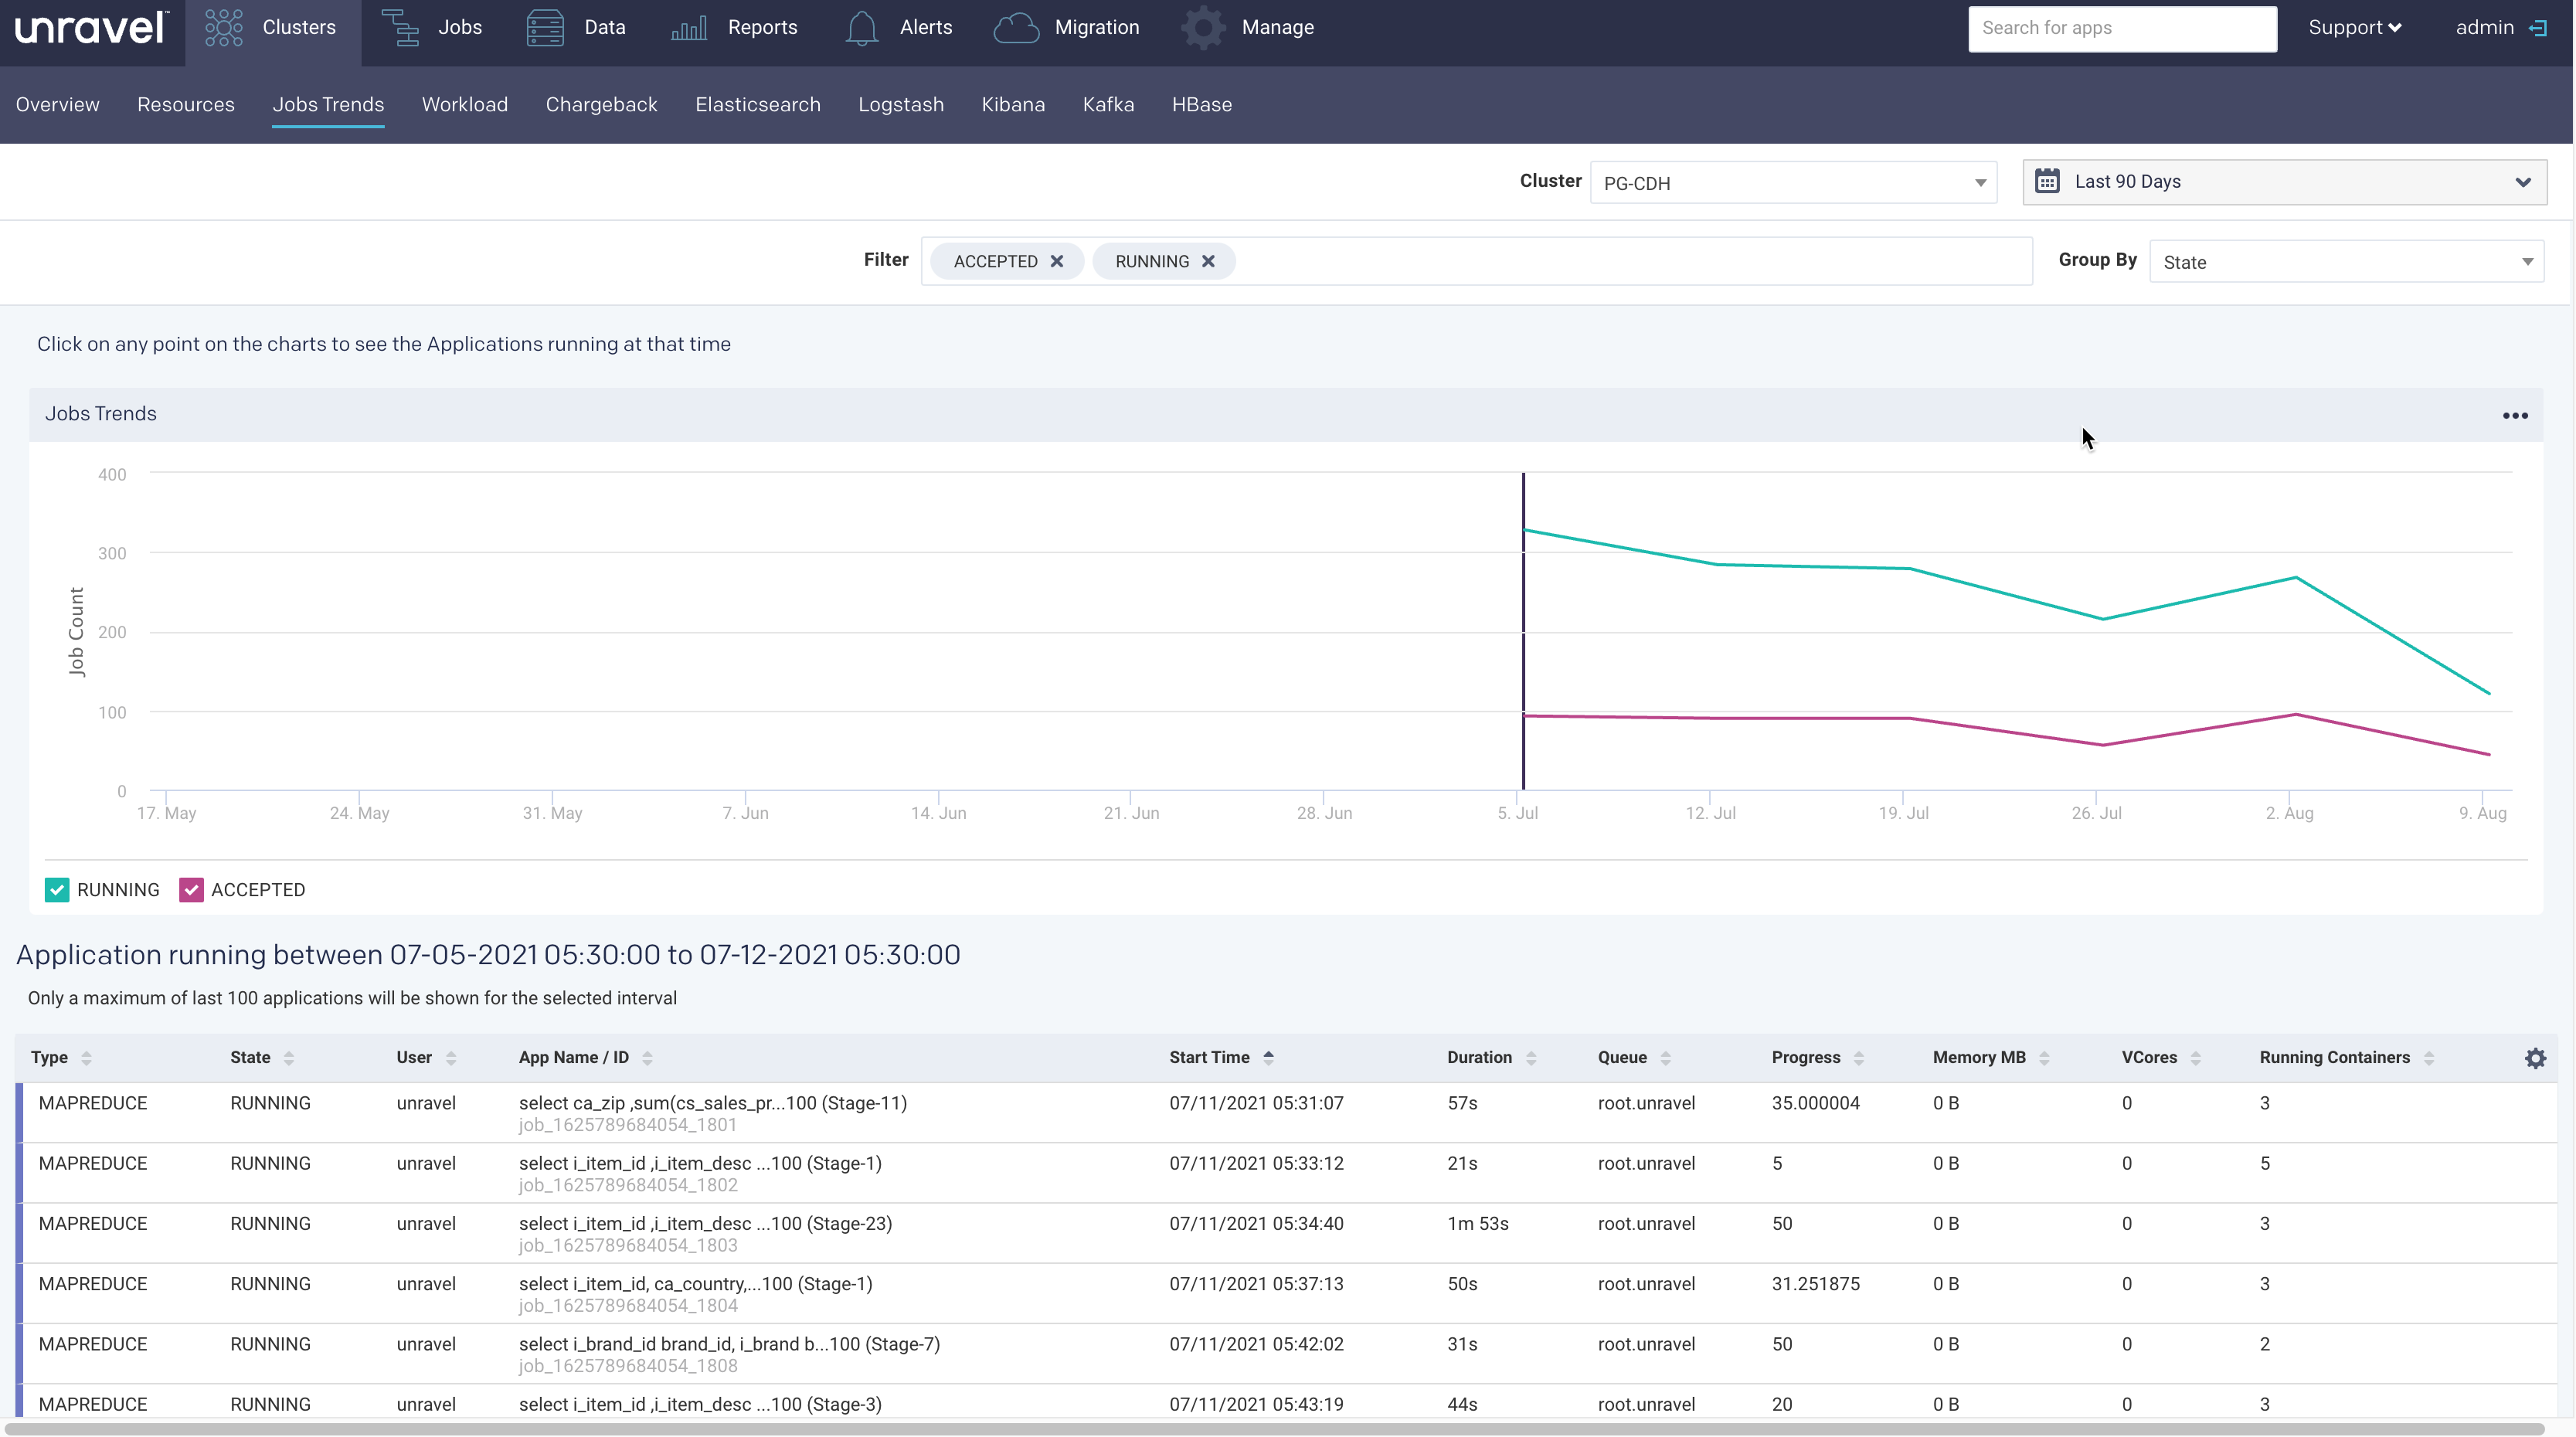
You can further filter the job trends based on the selected Group by options. The Clusters > Job Trends tab has the following two sections:
Graphs: Plots the trend of the job count over a specified period which can be grouped by options and further filtered. The filter checkboxes can be selected or deselected to enable the corresponding trendline in the graph.
Tables: Displays the list of the running applications with the following details is displayed for the specified period.
Viewing Job Trends
To view the resources usage, do the following:
Go to the Clusters > Jobs tab.
From the Cluster drop-down, select a cluster.
From the Group By drop-down, select an option. You can filter the Group By options further from the Filter options box. Click the
 next to an option to deselect it.
For example, if you select Application Type as a Group By option, then all the application types are listed in the Filter options box. You can then drill down to a specific application type such as Spark.
Select the period range from the date picker drop-down. You can also provide a custom period range. The graphs corresponding to the selected filters are displayed.
Click any point in the graph. The following details of the resources used for the running jobs are displayed in a table:
Items
Description
Type
The type of application where the job is running.
State
Status of the job.
User
Name of the user running the job.
App Name/ID
Name or ID of the application where the job is running.
Start Time
The time when the job was started.
Duration
Period till when the job has been running.
Queue
Queue
Progress
Percentage of the progress of the running job.
Memory MB
Memory in MB that is used by the job.
VCores
No of VCores used by the job.
Running Containers
No of running containers.
Click
 in the table to select the columns that must display.