Insights Overview (Preview)
Note
The Insights Overview tab is a preview feature, which is available for EMR, Databricks, CDP, CDH, and HDP. It must be enabled on the Unravel UI.
The Insights Overview tab provides a single location to show a summary of the insights that Unravel aggregates across your clusters. The insights are designed to monitor and reduce cost on the cloud, improve resource efficiency, and enable app acceleration.
Cost (Only for EMR and Databricks platforms)
In the EMR version, the cost section shows the cost and number of deployed clusters, monitored by Unravel, as well as the total cost and the total number of clusters in your environment, for a given time period. Daily values of the same KPIs are shown in a trend over the same period. Unravel also provides insights to reduce cluster cost, such as instance type recommendation, and showing top groups by cost, nodes that use spot instance pricing and long-running clusters with significant idle time.
In the Databricks version, only the cost and number of clusters monitored by Unravel are available, broken down into all-purpose and job clusters, with daily values shown in trends for a given time period. Besides instance type recommendations, top groups and clusters by cost are shown, as are apps caught by AutoActions for exceeding costs.
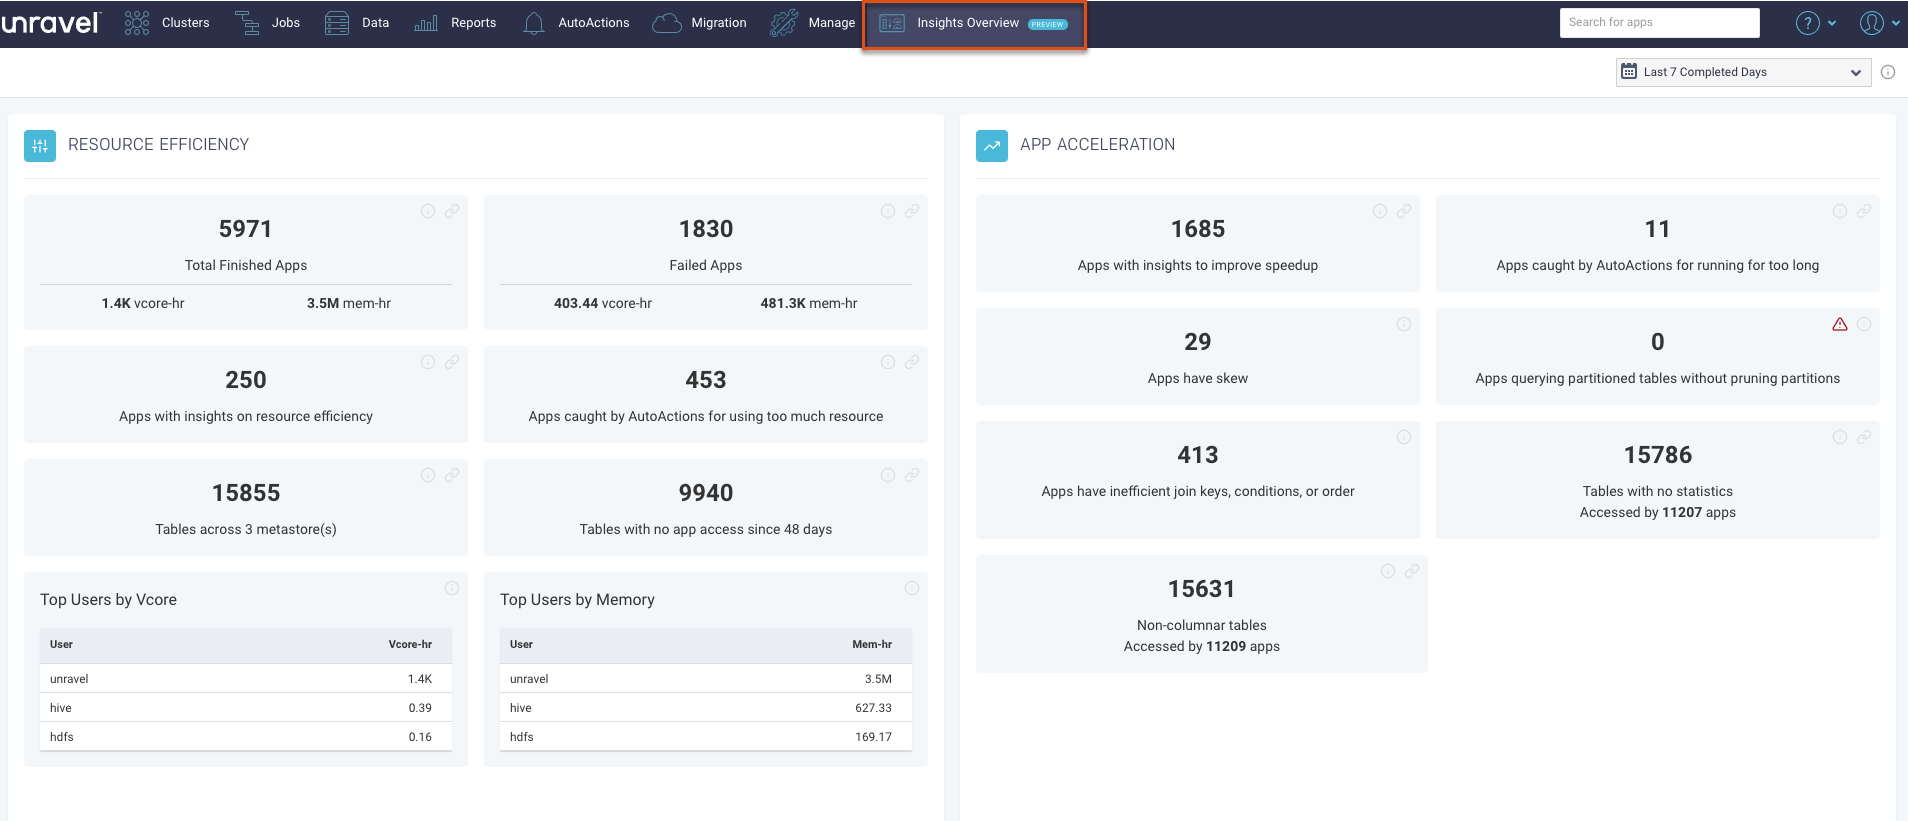
Resource Efficiency
This section provides the total number of finished and failed apps and the corresponding resources, for a given time period. It also shows top users by resource, apps with insights to improve resource efficiency, apps caught by AutoActions for using too much resource, and the number of tables with no app access recently.
App Acceleration
This section identifies apps with insights to improve app speedup, including specific insights such as skew, inefficient joins, queries not leveraging partitions, and so on. It also shows apps caught by AutoActions for running for too long.
The values can be shown for the last completed 1, 7, 14, or 30 days. You can also choose a custom range to view the values. Each widget has an info icon that provides a detailed description. Some have links that redirect users to other pages in Unravel for further drill down.
Enabling Insights Overview dashboard on the UI
Stop Unravel.
Unravel installation directory>/unravel/manager stop
Set the property to enable Insights Overview dashboard on the Unravel UI.
<Unravel installation directory>/unravel/manager config properties set com.unraveldata.valuedashboard.enabled true
Optionally, you can also set the threshold for the idle time for a long-running cluster.
<Unravel installation directory>/unravel/manager config properties set com.unraveldata.valuedashboard.idle.hour <no of hours>
Note
The default is one hour.
For example:
<Unravel installation directory>/unravel/manager config properties set om.unraveldata.valuedashboard.idle.hour 2
Apply changes.
<Unravel installation directory>/unravel/manager config apply
Start Unravel.
<Unravel installation directory>/unravel/manager start
Viewing the Insights Overview dashboard
The Insights Overview dashboard is supported only for On-prem (CDH, HDP, CDP), EMR, and Databricks platforms. The Insights Overview dashboard must be enabled for the Unravel UI using properties. After it is enabled, you can click the  from the menu to view the Insights Overview dashboard.
Inspecting details of the performance values
On the Unravel UI, click
from the menu. The App Insights dashboard is displayed with the performance values displayed in the Cost, Resource Efficiency, and App Acceleration summary sections.In any of the summary sections, in any of the displayed metrics boxes:
Click
 . You will be led to the corresponding details page in Unravel.
 Click
 . A pop-up with a description of the sub-section is displayed.
 Click
 . The reason for the zero data display in the sub-section is shown.