Kafka
This Kafka tab is shown on the Clusters page only when you have enabled it while connecting to the Kafka cluster. Refer to Connecting to the Kafka cluster.
From this tab, you can monitor various metrics of Kafka streaming. Before using Unravel to monitor Kafka, you must connect the Unravel server to a Kafka cluster.
You can also improve the Kafka cluster security by having Kafka authenticate connections to brokers from clients using either SSL or SASL. Refer to Kafka security.
The following KPIs are displayed on the top of the Kafka page. The first three ( Under Replicated Partitions, Offline Partitions, Controller) are color-coded as follows:
Green - Indicates that the streaming process is healthy.
Red - Indicates that the streaming process is unhealthy. This is an alert for further investigations.
The remaining metrics are data input and output metrics and are always displayed in blue
Metrics | Description |
|---|---|
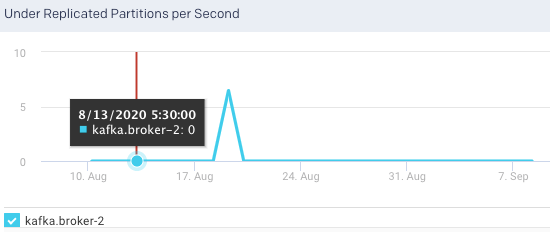
Under Replicated Partitions | A total number of under-replicated partitions. This metric indicates if the partitions are not replicating as configured. If under-replicated partitions are shown, you can drill down further in the Broker tab for further investigation. |
Offline Partitions | A total number of offline partitions. If this metric is greater than 0, then there are broker-level issues to be addressed. |
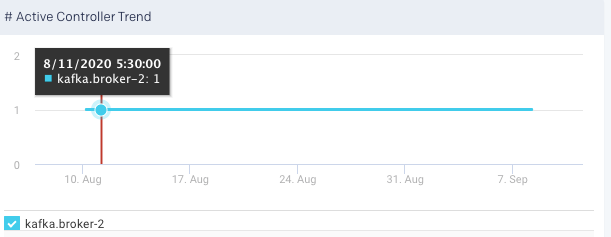
Controller | Shows the number of brokers in the cluster that delegate the function of a controller. If this metric is showing as 0, it indicates no active controllers. |
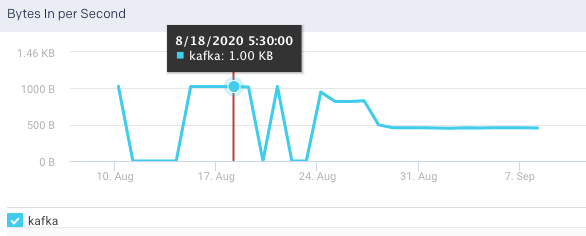
Bytes in per Sec | The total number of incoming bytes received per second from all servers. |
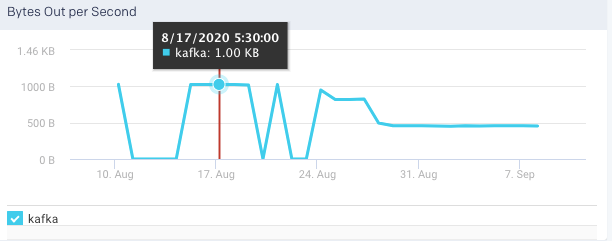
Bytes Out per Sec | The total number of outgoing bytes sent per second to all servers. |
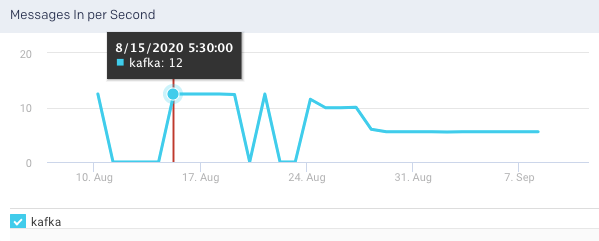
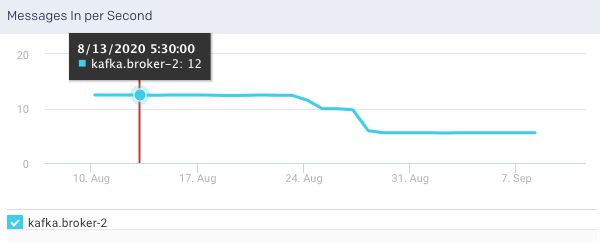
Messages in per Sec | The total rate of the incoming messages. A unit of data is called a message. The messages are written into Kafka in batches. |
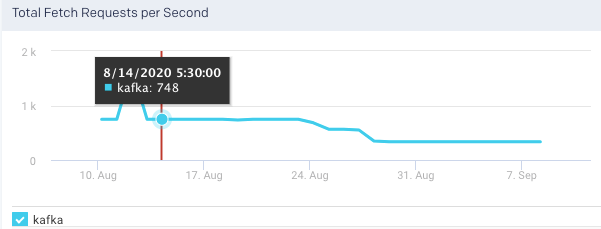
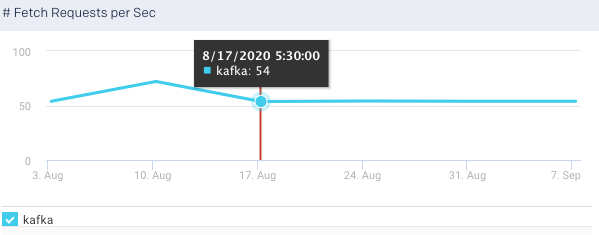
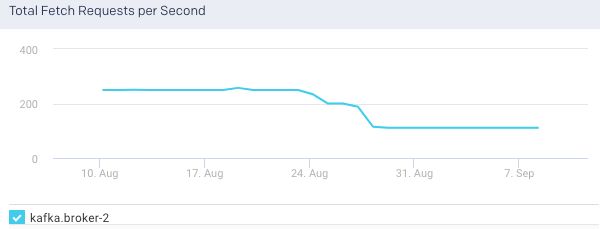
Total Fetch Requests per Sec | Rate of the fetch request. |
See Kafka Metrics Reference and Analysis for a complete list of Kafka metrics that are monitored by Unravel.
Metrics
You can monitor all the metrics associated with your Kafka clusters from the Kafka > Metrics tab. The following graphs plot the various Kafka metrics for a selected cluster, in the specified time range:
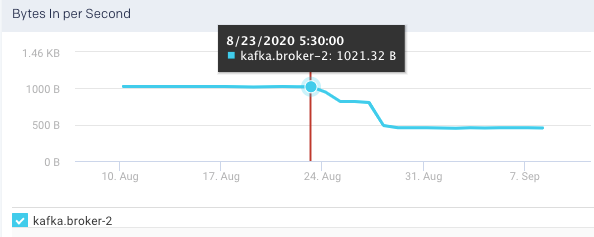
Bytes In per Second: This graph plots the total number of bytes received per second from all topics and broker, over a specified time range.
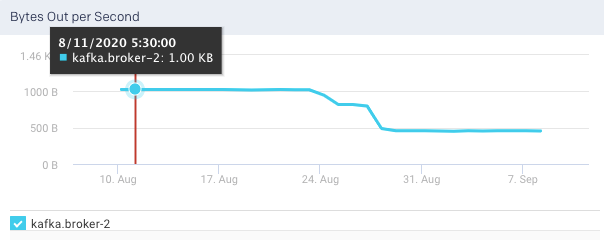
Bytes Out per Sec: This graph plots the total number of outgoing bytes sent per second to all Kafka consumers, over a specified time range.
Messages in per Sec: This graph plots the messages produced in the cluster across all topics and brokers, over a specified time range.
Total Fetch Requests per Sec: This graph plots the total rate of fetch requests within the cluster, over a specified time.
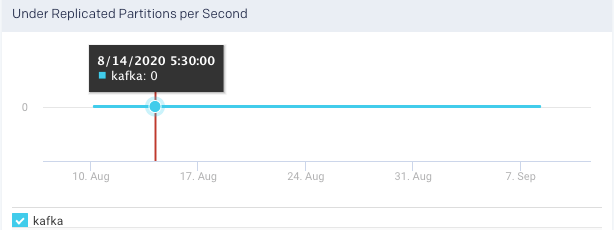
Under Replicated Partitions: This graph plots the number of under replicated partitions per second, within a cluster, over a specified period.
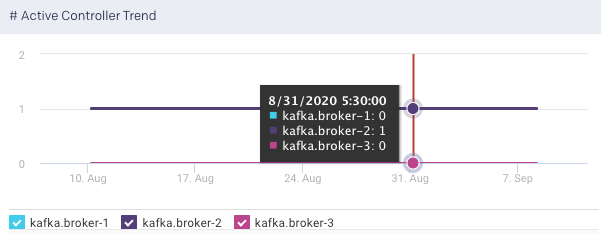
Active Controller Trend: This graph plots the trend of the brokers in the cluster that delegate the function of a controller, over a specified period. You can select or deselect the brokers to view the corresponding trend.
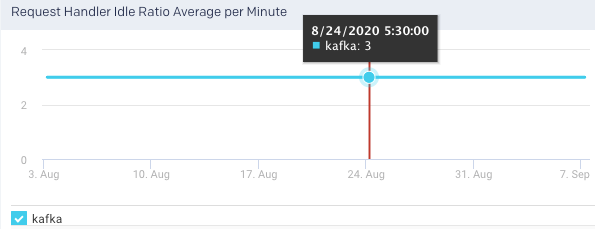
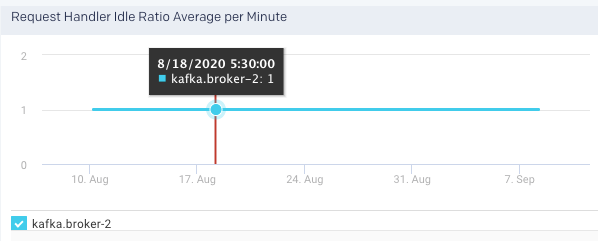
Request Handler Idle Ratio Average per Minute: It indicates the percentage of the time the request handlers are not in use. This graph plots the average ratio per minute that the request handler threads are idle in a specified time range.
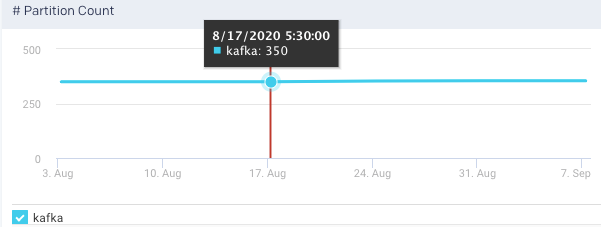
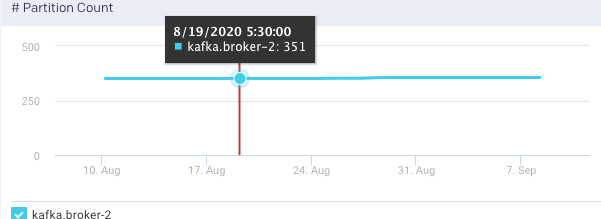
Partition Count: The number of partitions. The count includes both leader and follower replica. This graph plots the total number of partitions across all brokers in a cluster, in a specified time range. The trend line indicates the metric's value across the entire cluster averaged over all brokers.
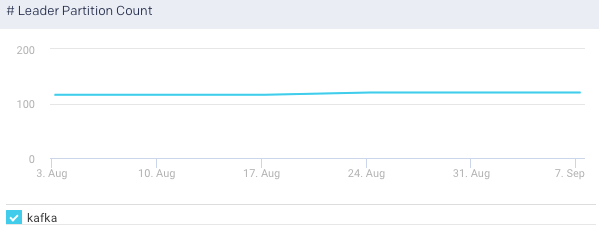
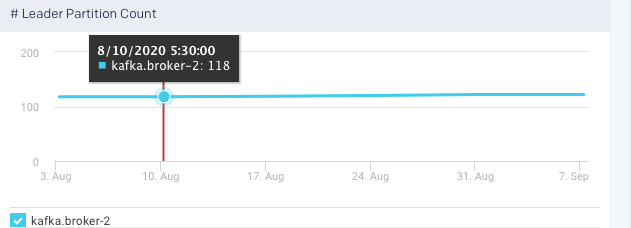
Leader Partition Count:t This graph plots the total number of leader partitions across all brokers in a cluster, in a specified time range.
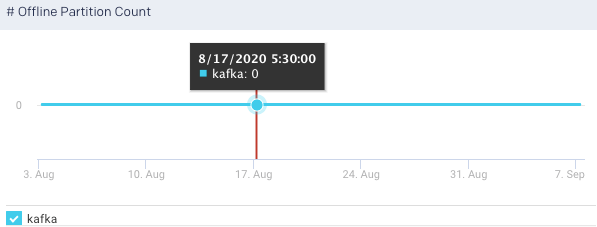
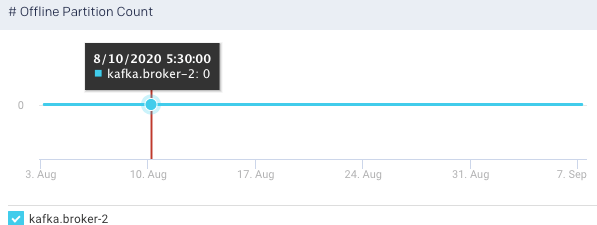
Offline Partition Count: This graph plots the total number of partitions that do not have an active leader, in the specified time range. Such partitions are neither writable nor readable. If the count is more than 0, more investigation is required to resolve broker-level issues.
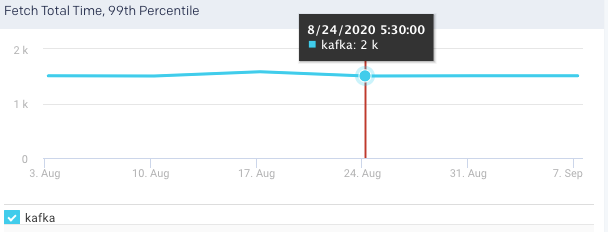
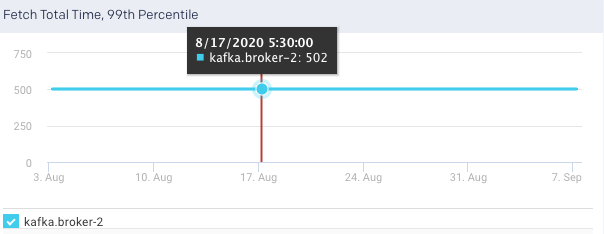
Fetch Total Time, 99 Percentile: This graph plots the time value for the entire cluster averaged across all brokers.
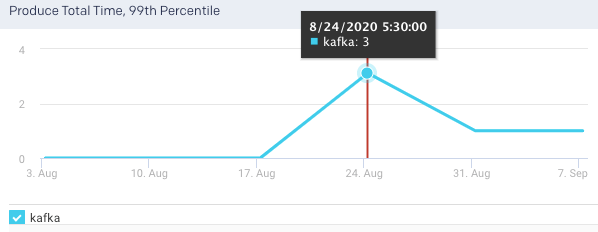
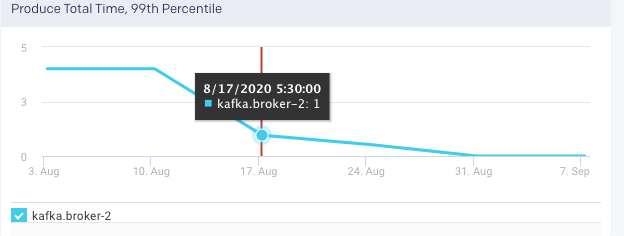
Produce Total Time, 99 Percentile
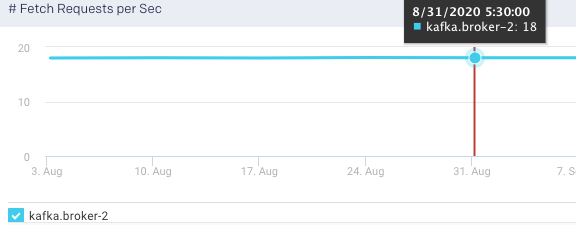
Fetch Requests per Sec: This graph plots the rate of fetch requests in a specified time range.
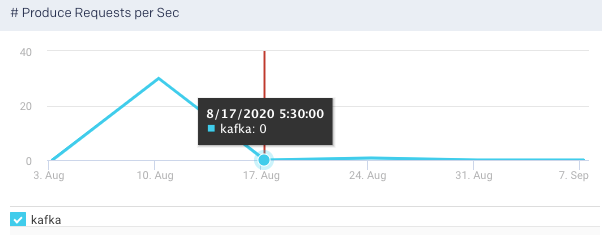
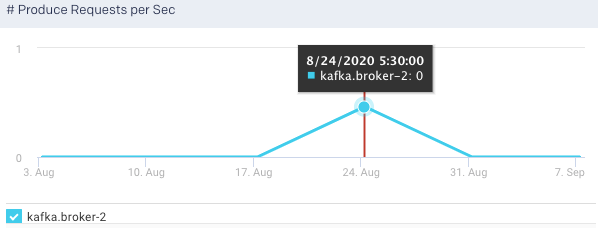
Produce Request per Sec:Shows the summation of the produce requests being processed across all brokers per second. This graph plots the rate of produce requests in a specified time range.
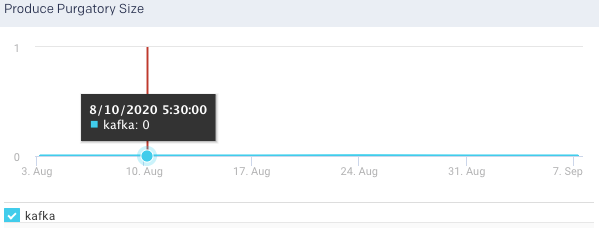
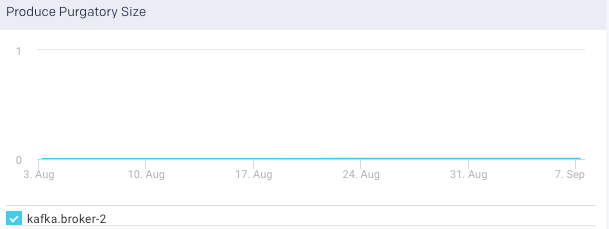
Produce Purgatory Size: This graph plots the product purgatory size over a specified time range. Purgatory holds a request that has not yet succeeded nor has it resulted in an error.
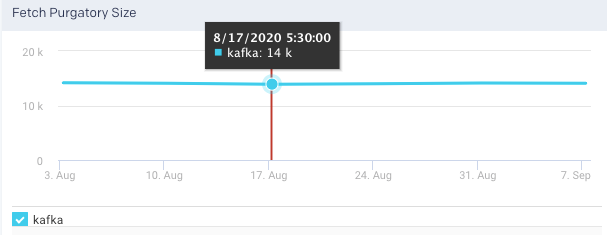
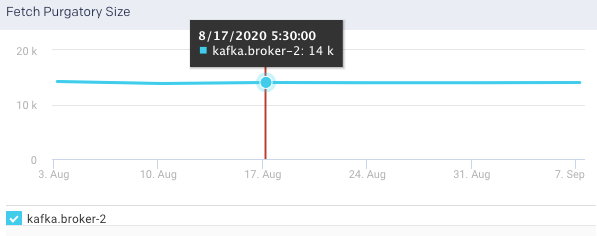
Fetch Purgatory Size: The number of Fetch requests sitting in the Fetch Request Purgatory. It is a holding pen for requests waiting to be satisfied (Delayed). Of all Kafka request types, it is used only for Fetch requests. It tracks the number of requests sitting in purgatory (including both watchers map and expiration. This graph plots the fetch purgatory size over a specified time range.
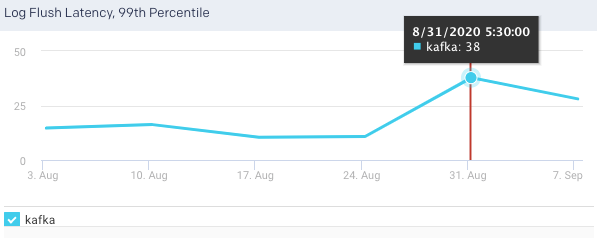
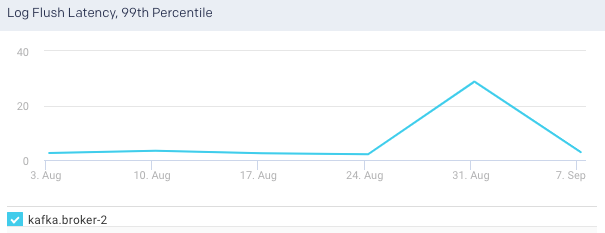
Log Flush Latency, 99th Percentile:The 99th percentile value of the latency incurred by a log flush, that is, write to disk in milliseconds. 99% of all values in the group are less than the value of the metric. This graph plots the time taken for the brokers to flush logs to disk over a specified time range.
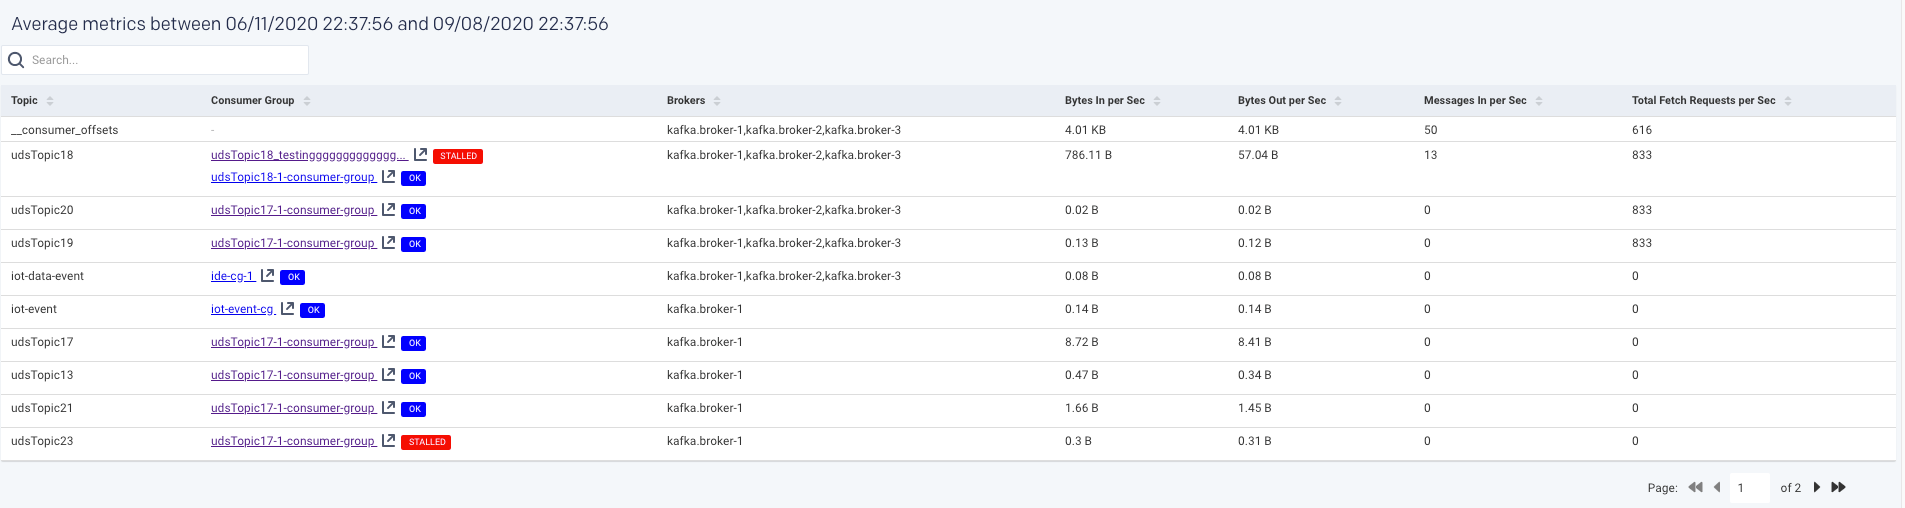
An average of the following metrics are displayed in a table below:
Items | Description |
|---|---|
Topic | Name of the Kafka topic. |
Consumer Group | The name of the consumer group that work together to consume a topic. Consumers read messages. The consumer subscribes to one or more topics and reads the messages in the order in which they were produced. |
Brokers | The name of the Kafka broker. A single Kafka server is called as a broker. The broker receives messages from producers, assigns offsets to them, and commits the messages to storage on disk. |
Bytes in per Sec | The total number of incoming bytes received per second from all servers. |
Bytes Out per Sec | The total number of outgoing bytes sent per second to all servers. |
Messages in per Sec | Total rate of the incoming messages. |
Total Fetch Requests per Sec | Rate of the fetch request. |
You can click a row in the average metrics table to view the corresponding Topic summary page.
Broker
A single Kafka server is called a broker. Kafka brokers are designed to operate as part of a cluster. Within a cluster of brokers, one broker can function as the cluster controller. The broker receives messages from producers, assigns offsets to them, and commits the messages to storage on disk. It also services consumers, responding to fetch requests for partitions and responding with the messages that have been committed to disk.
You can monitor all the metrics associated with each Kafka broker in your cluster, from the Kafka > Broker tab.
The latest metrics of the Kafka brokers for the specified time range are displayed in a table as shown:

The following graphs plot the various Kafka metrics for a selected broker, in the selected cluster, for the specified time range:
Bytes In per Second: This graph plots the total number of bytes received per second for the selected broker, over a specified time range.
Bytes Out per Sec: This graph plots the total number of outgoing bytes sent per second by the selected broker, over a specified time range.
Messages in per Sec: This graph plots the total rate of the incoming messages received by the broker, over a specified time range.
Total Fetch Requests per Sec: This graph plots the total rate of fetch requests made by the broker, over a specified time.
Under Replicated Partitions: This graph plots the number of under replicated partitions per second in the selected broker, over a specified time range.
Active Controller Trend: This graph plots the trend of the selected broker to delegate the function of a controller, over a specified period.
Request Handler Idle Ratio Average per Minute: This graph plots the average ratio per minute that the request handler threads are idle, in the selected broker, for the specified time range.
Partition Count: This graph plots the total number of partitions in the selected broker, for the specified time range.
Leader Partition Count:This graph plots the total number of leader partitions in the selected broker, for the specified time range.
Offline Partition Count: This graph plots the total number of partitions, that do not have an active leader in the selected broker, for the specified time range. Such partitions are neither writable or readable. If the count is more than 0, more investigation is required to resolve the broker level issues.
Fetch Total Time, 99 Percentile:
Produce Total Time, 99 Percentile
Fetch Requests per Sec: This graph plots the rate of fetch requests made by the selected broker, in a specified time range.
Produce Request per Sec:This graph plots the rate of produce requests in a specified time range.
Product Purgatory Size: This graph plots the product purgatory size, for the selected broker, over a specified time range. Purgatory holds a request that has not yet succeeded nor has it resulted in an error.
Fetch Purgatory Size: This graph plots the fetch purgatory size for the selected broker, over a specified time range.
Log Flush Latency, 99th Percentile:This graph plots the time taken for the selected broker to flush logs to disk over a specified time range.
An average of the following metrics are displayed in the table below:
You can click a row in the average metrics table to view the corresponding Topic summary page.
Topic
A Topic is a category into which the Kafka records are organized. Topics are additionally divided into several partitions. From the Clusters > Topic tab, you can monitor all the metrics associated with a topic.
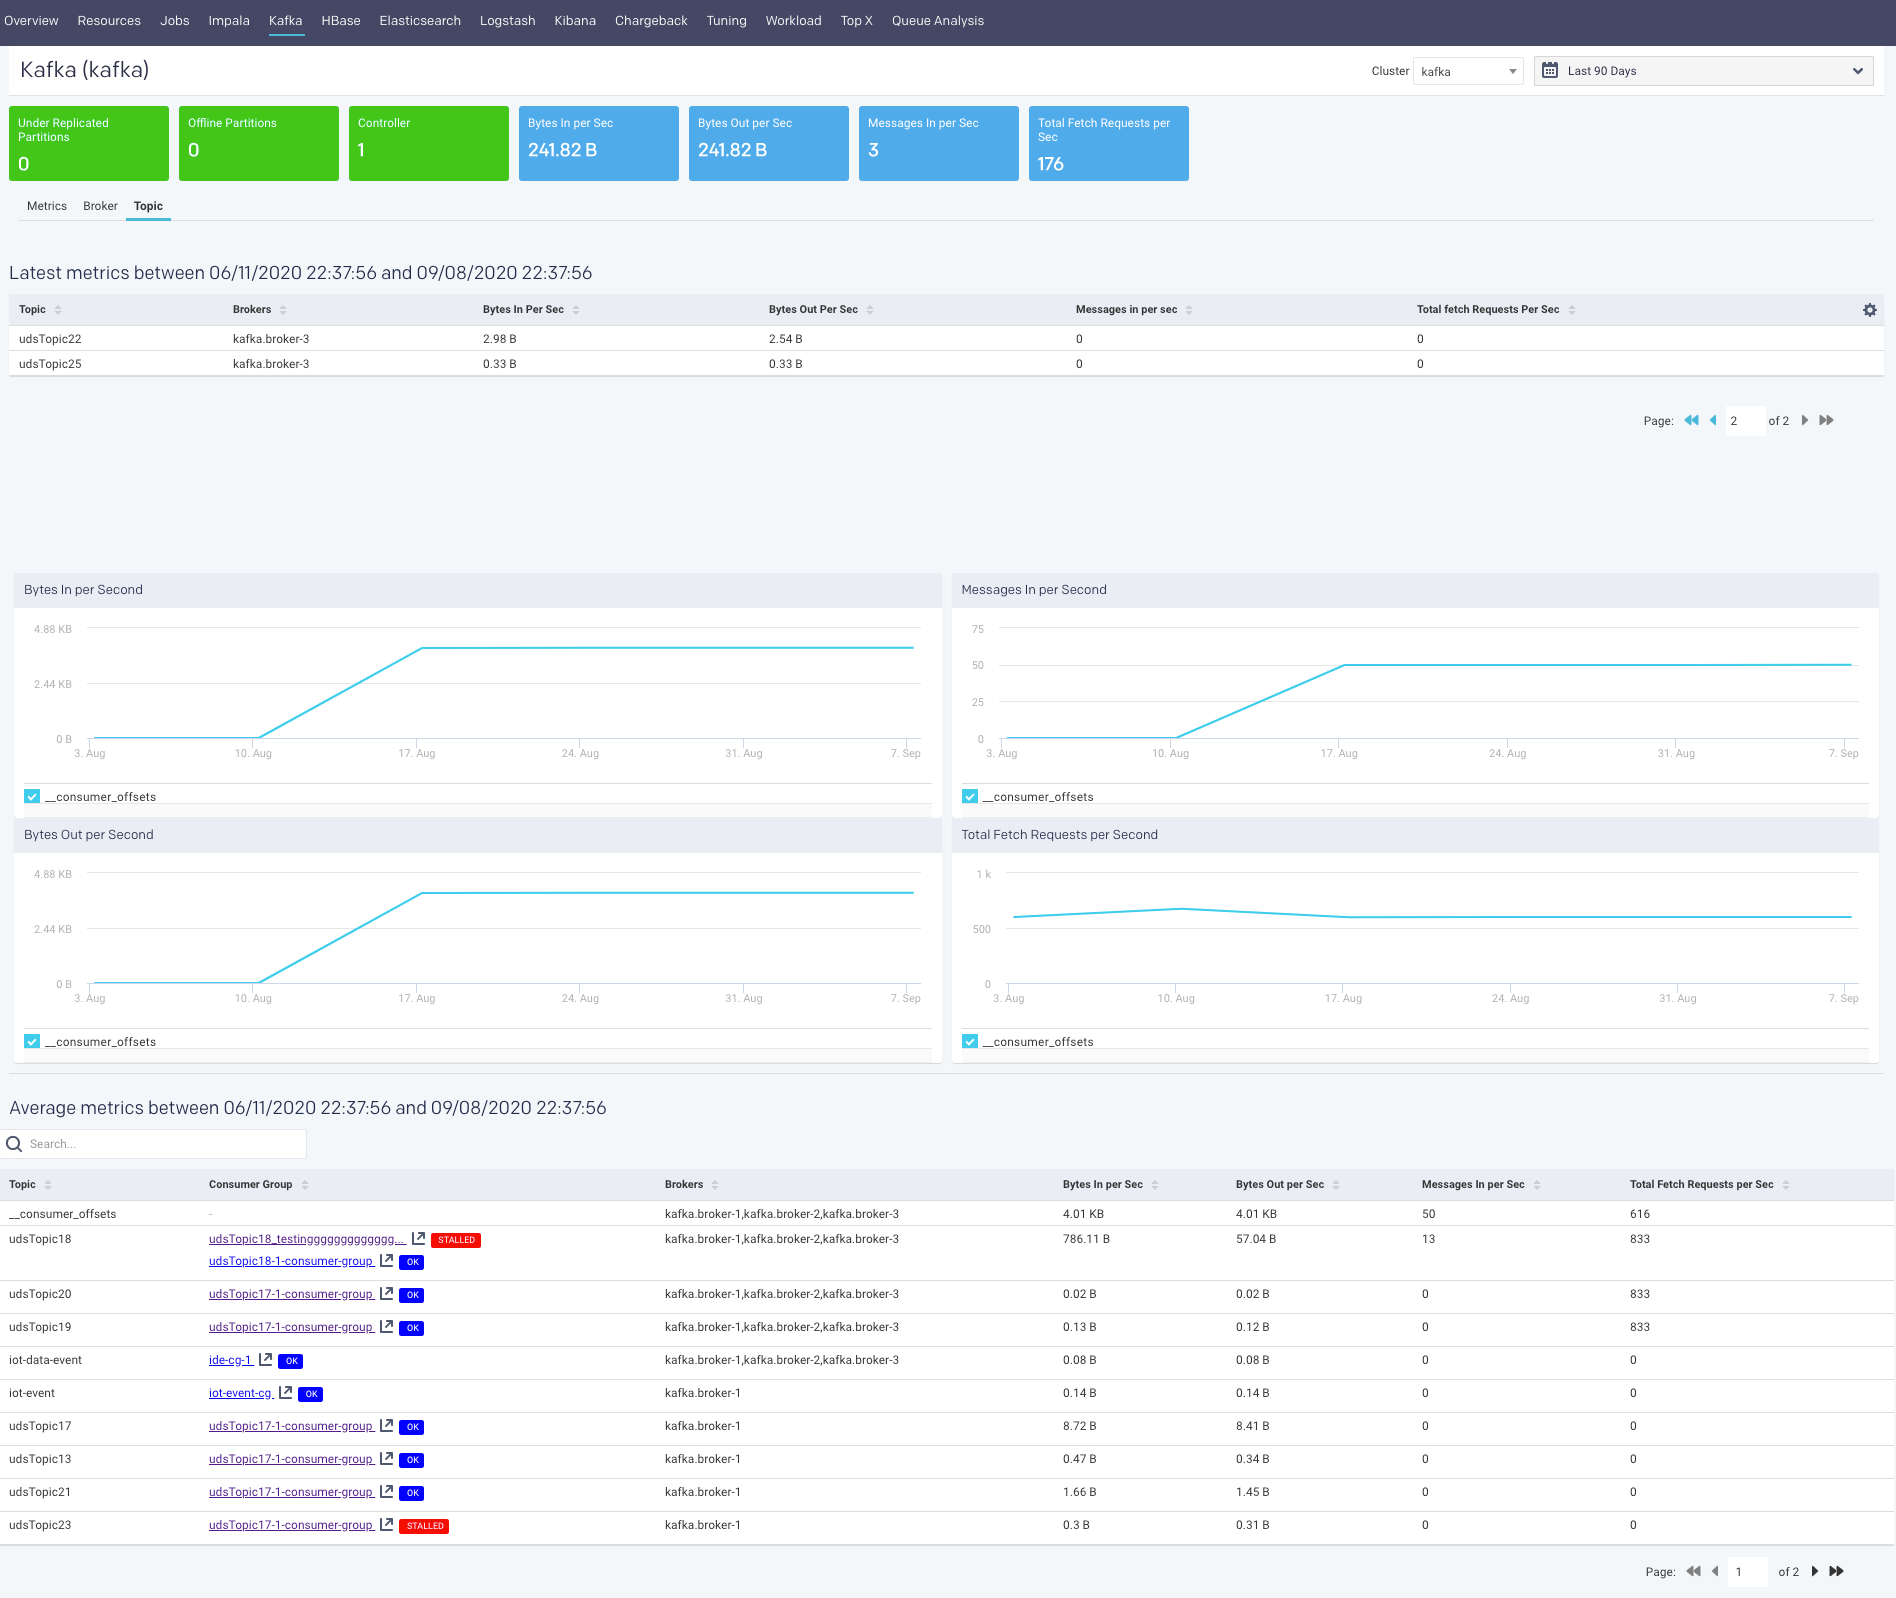
The latest metrics of topics are displayed in a table as shown.
Items | Description |
|---|---|
Topic | Name of the Kafka topic. |
Brokers | The name of the Kafka broker. A single Kafka server is called as a broker. The broker receives messages from producers, assigns offsets to them, and commits the messages to storage on disk. |
Bytes in per Sec | The total number of incoming bytes received per second for the topic. |
Bytes Out per Sec | The total number of bytes received per second for the selected topic, over a specified time range. |
Messages in per Sec | The total rate of the incoming messages received by the topic, over a specified time range. |
Total Fetch Requests per Sec | The total rate of fetch requests made by the topic, over a specified time. |
The corresponding graphs are plotted for the topic metrics:
Bytes In per Second: This graph plots the total number of bytes received per second for the selected topic, over a specified time range.
Bytes Out per Second: This graph plots the total number of bytes received per second for the selected topic, over a specified time range.
Messages In per Second: This graph plots the total rate of the incoming messages received by the topic, over a specified time range.
Total Fetch Request per Second: This graph plots the total rate of fetch requests made by the topic, over a specified time.
Under Replicated Partitions per Second: This graph plots the number of under replicated partitions per second, within a cluster, over a specified period.
The average metrics of the topics, in the specified period, are displayed in a table. If you click a topic, the corresponding topic summary page is displayed.
Topic Summary page
The Topic summary page displays the latest and average values of the topic metrics along with the corresponding graphs.
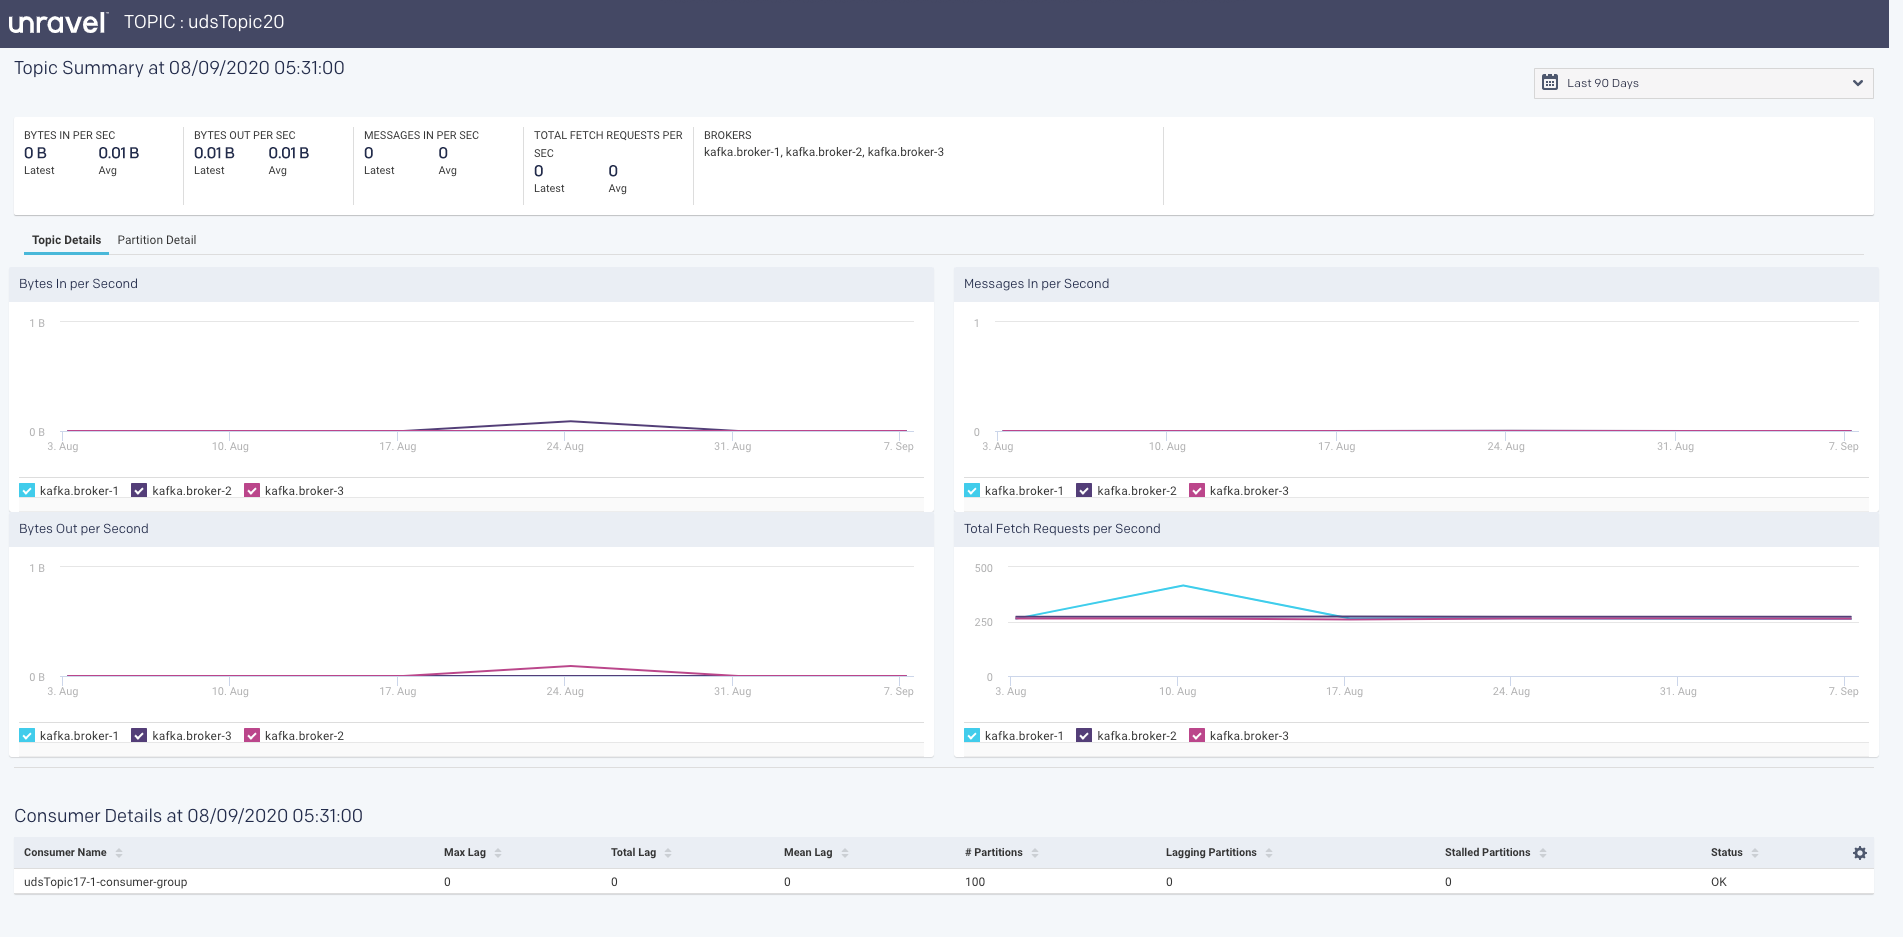
Consumer Summary page
Consumers read messages. They are also called as subscribers or readers. The consumer subscribes to one or more topics and reads the messages in the order in which they were produced. Consumer tracks which of the messages it has already consumed by keeping track of the offset of messages.
The following latest metrics of the topics are displayed in the Consumer Summary page.
Items | Description |
|---|---|
Consumer Name | Name of the Consumer. |
Max Lag | Number of messages the consumer lags behind the producer by. |
Total Lag | The total number of incoming bytes received per second from all servers. |
Mean Lag | The total number of outgoing bytes sent per second to all servers. |
Partitions | The total rate of the incoming messages. |
Lagging Partitions | If the Consumer lag for the topic partition is increasing consistently, and an increase in lag from the start of the window to the last value is greater than the lag threshold |
Stalled Partitions | If the Consumer commit offset for the topic partition is not increasing and lag is greater than zero |
Status | Status |
The following metrics are tracked in this page:
Number of Topics
Number of Partitions
The Topic list displays the KPIs; when details are available a more info icon is displayed. Click it to bring up the Kafka view for the topic. Below the list are two tabs that display graphs of the Topic and Partition details. By default, the window opens with the Topic Detail graph displayed.
You can choose both the Partition and the Metric for the display. By default, the 0th partition is displayed using the metric offset. The Partition Details' list is populated if the details are available.
Unravel insights for Kafka
Unravel provides auto-detection of lagging/stalled Consumer Groups. It lets you drill down into your cluster and determine which consumers, topics, partitions are lagging or stalling.
Unravel determines Consumer status by evaluating the consumer's behavior over a sliding window. For example, we use an average lag trend for 10 intervals (of 5 minutes duration each), covering a 50-minute period. Consumer Status is evaluated on several factors during the window for each partition it is consuming.
For a topic partition, Consumer status is:
Stalled: If the Consumer commits offset for the topic partition is not increasing and lag is greater than zero.
Lagging: If the Consumer lag for the topic partition is increasing consistently, and an increase in lag from the start of the window to the last value is greater than the lag threshold.
The information is distilled down into a status for each partition, and then into a single status for the consumer. A consumer is either in one of the following states:
OK: The consumer is working and is current.
Warning: The consumer is working, but falling behind.
Error: The consumer has stopped or stalled.