Kibana
This tab lets you monitor various metrics for Kibana. You can select a period to monitor the metrics for the Kibana instances in a cluster. You can enable Kibana monitoring by configuring the Kibana properties in the unravel.properties file.
Enable Kibana monitoring
Set the properties for Kibana. Refer to ELK configuration for the method to set the properties.
View Kibana metrics
By default, the Kibana metrics are shown for all the clusters for the past one hour. To view the Kibana cluster KPIs for a specific time period:
Go to Clusters > Kibana.
Select a cluster from the Cluster drop-down
Select a period range. The following Kibana KPIs are displayed on top of the page:
Cluster KPIs Metric
Description
Status
Status of the cluster.
Heap Total
Total heap memory available.
Heap Used
Total heap memory used.
Requests Disconnects
Number of disconnected client requests.
Request Total
Total number of client requests received by the Kibana instance.
Response Time Max
Maximum time taken to respond to the client requests received by the Kibana instance.
Concurrent Connections
Total number of concurrent connections to the Kibana instance.
Collection Interval
Time period between data sampling for the metrics.
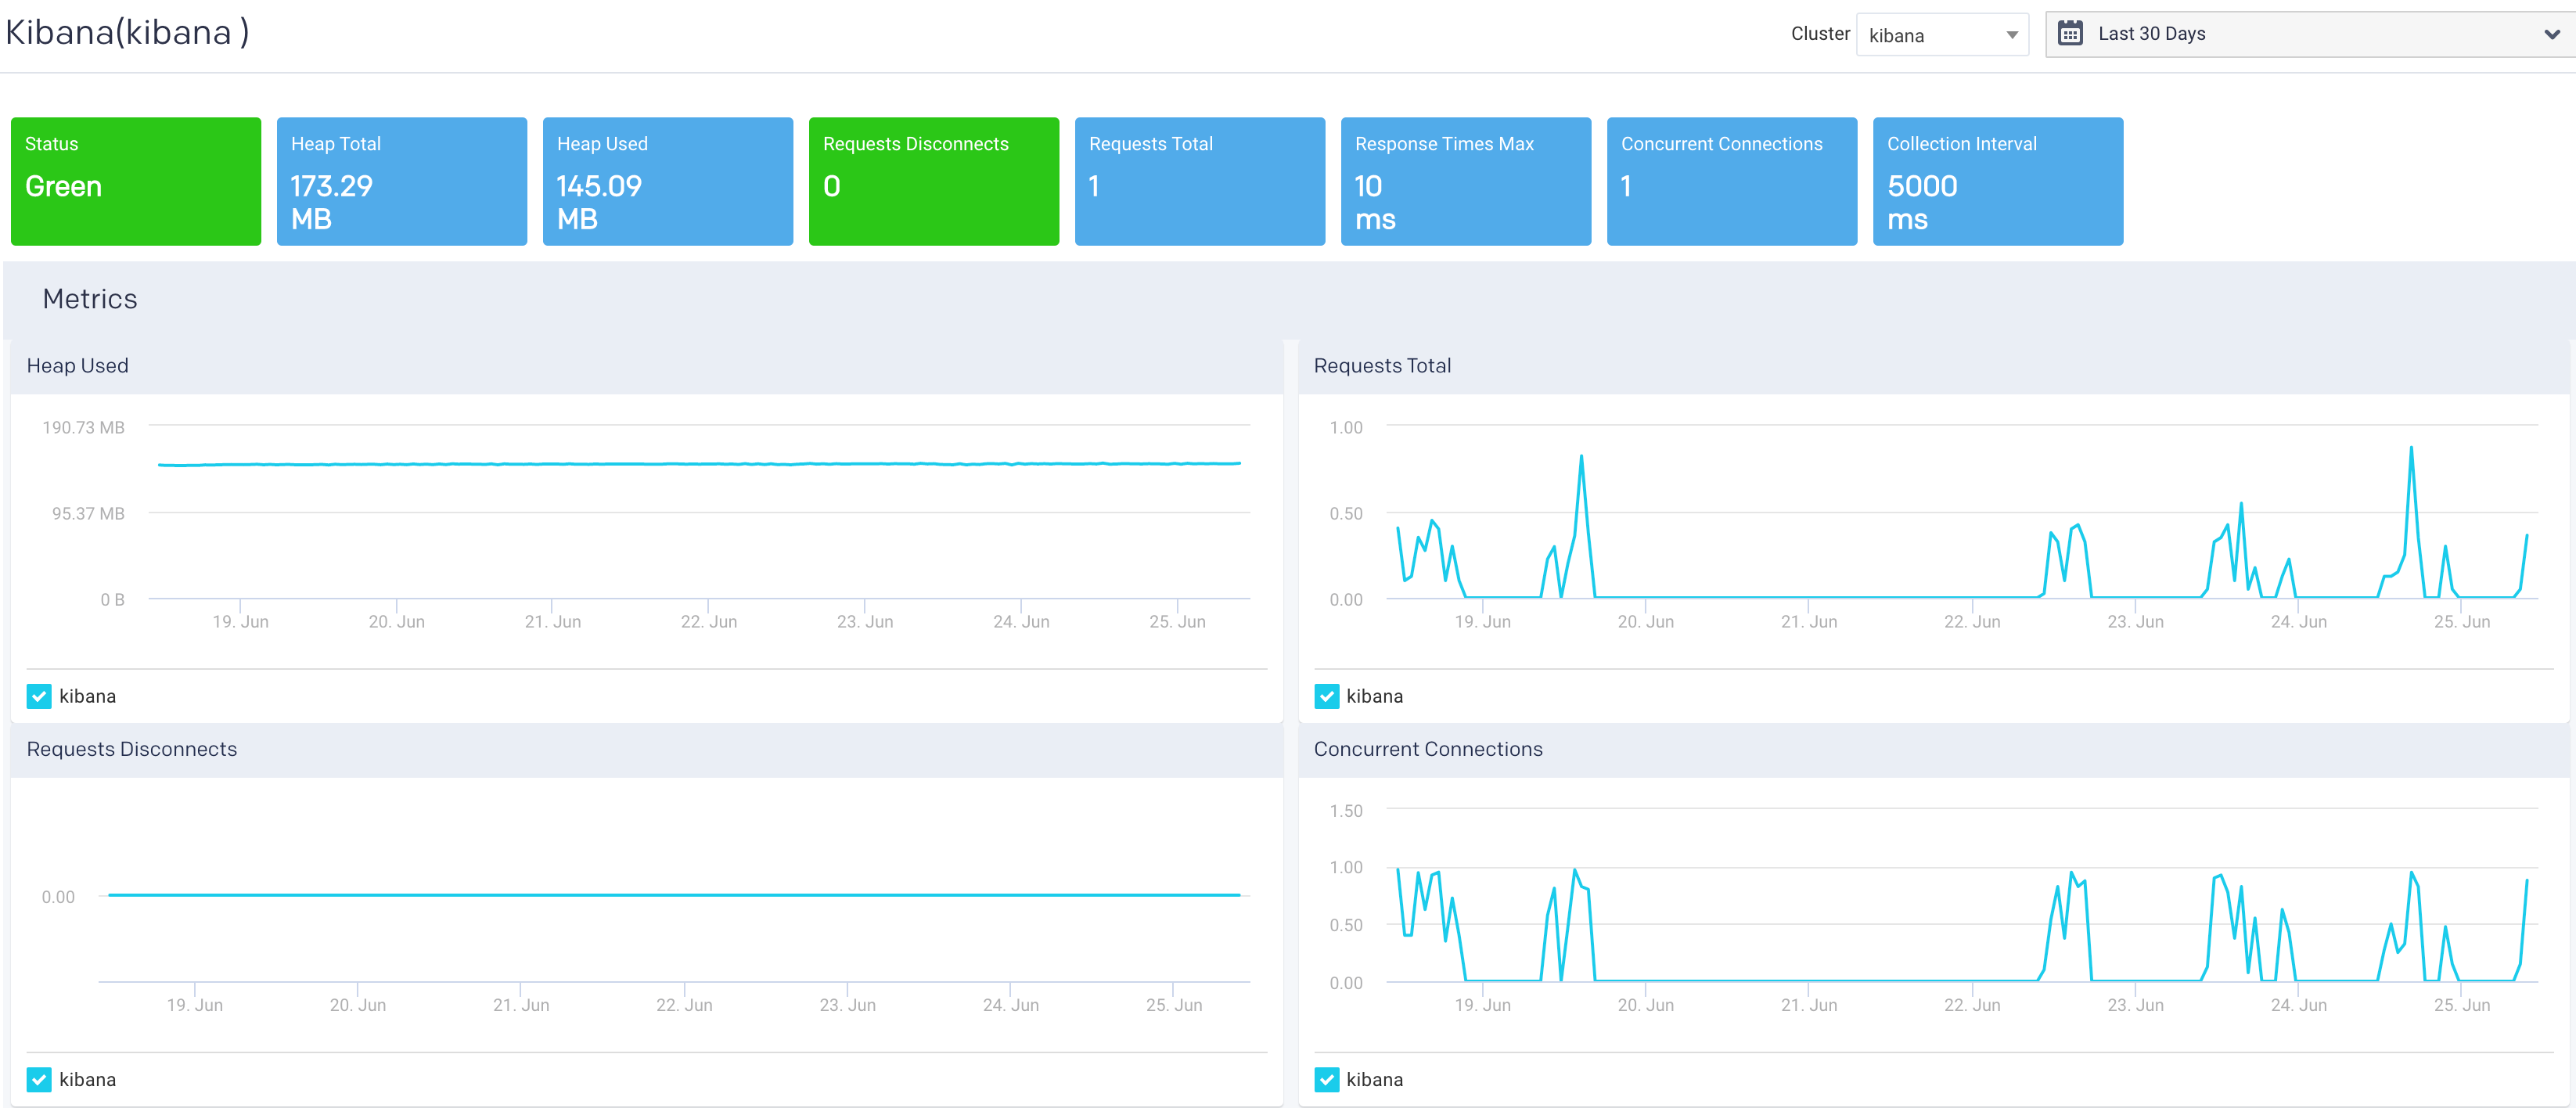
The following graphs plot the Kibana KPIs for a selected cluster in a specified time range:
Heap Used: This graph plots the total heap memory used by Kibana, in a cluster, for the specified period.
Request Total: This graph plots the total number of client requests received by the Kibana instance in the specified period.
Request Disconnects: This graph plots the totals no of disconnected requests in a specified period.
Concurrent Connections: This graph plots the concurrent connections to the Kibana instance in a specified period.