Tags (BigQuery)
In Unravel, you can observe cost trends for tags within the BigQuery projects and check how these tags influence your day-to-day expenses.
Viewing the cost trends for tags
From the Unravel UI, click Cost > Tags.
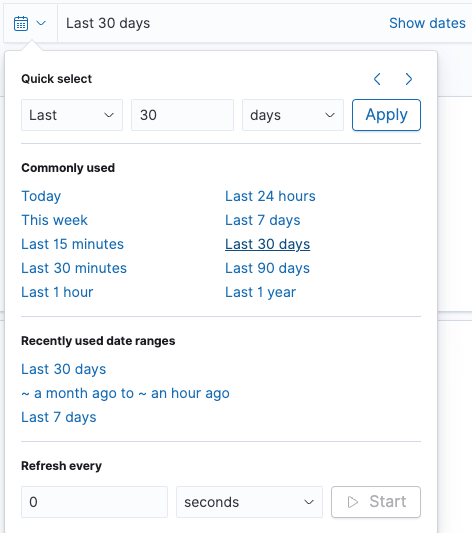
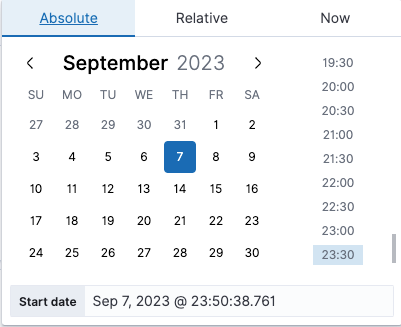
Filter the data using the date range filters or the field filters.
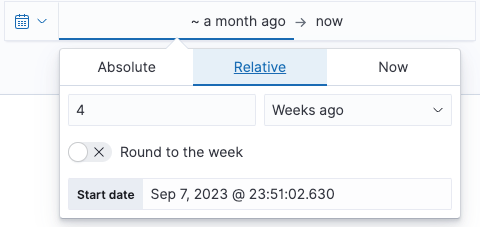
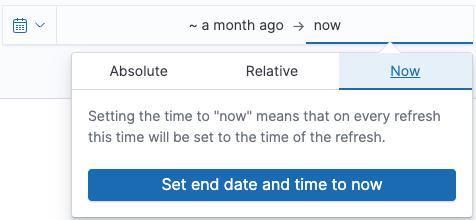
On the top right, you will find the date range filter. You can adjust the range to analyze data for specific periods.
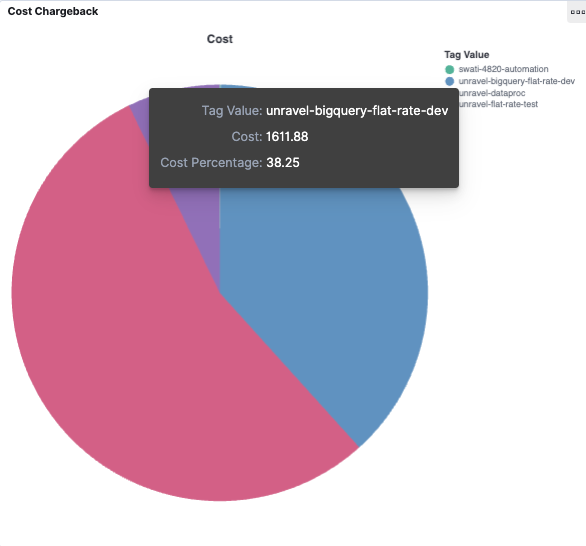
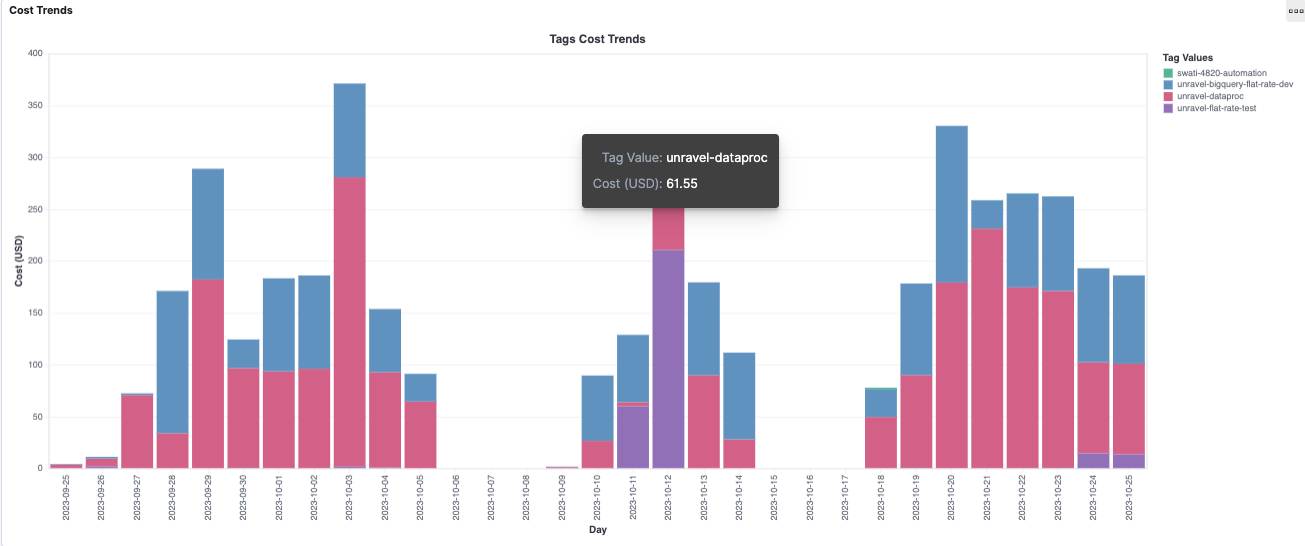
From the Filter section > Tag key, choose a tag key and click Apply Changes. In the Cost Chargeback section, a pie chart presents the cost percentage and cost value for each tag value associated with the tag key. The Cost Trends section also displays the daily cost trends for these tag values.