Viewing cost breakdown by service
On the Cost 360 page, a cost breakdown is shown based on the following service types:
Compute
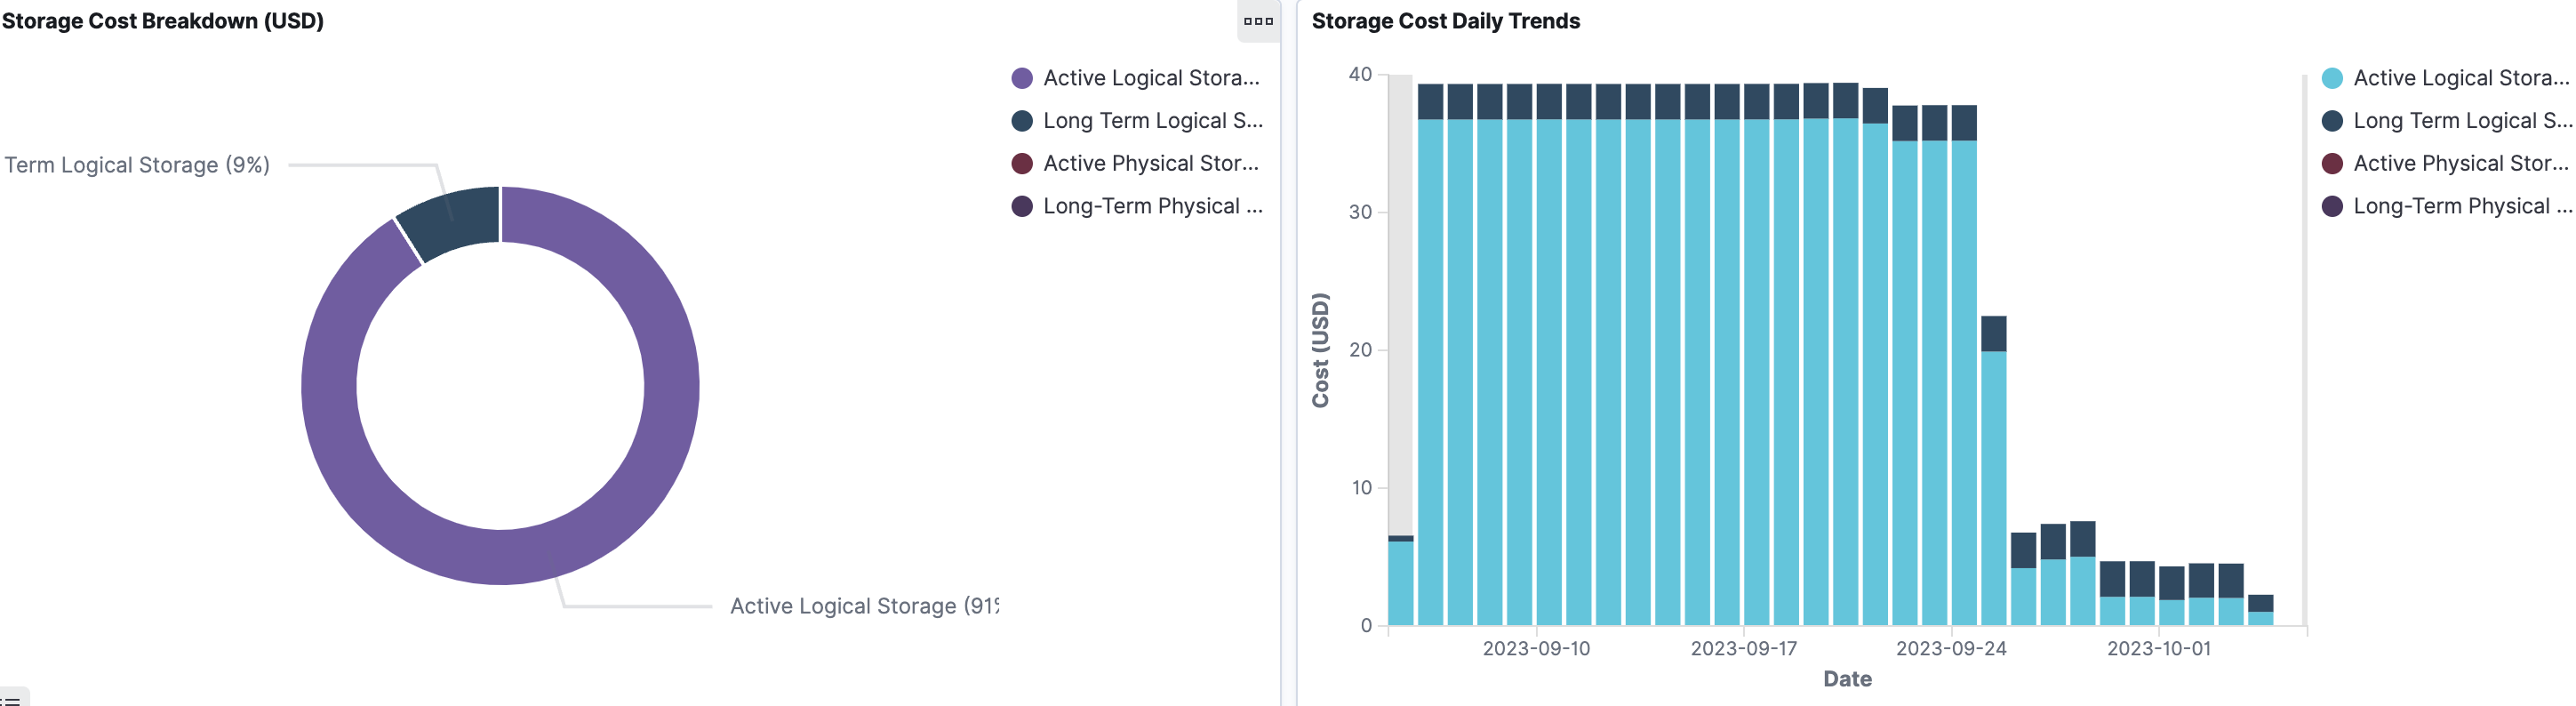
Storage
Others
From the Unravel UI, click Cost > Cost 360.
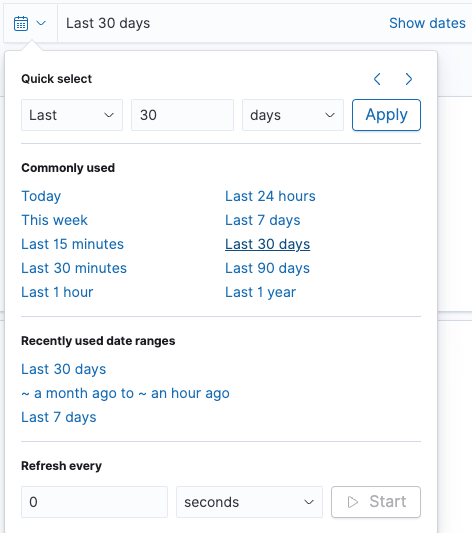
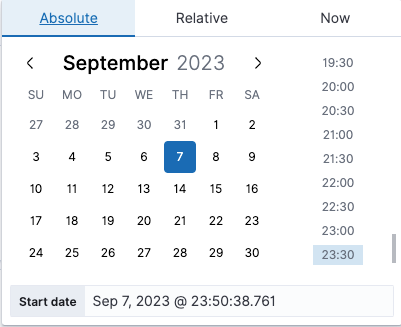
Filter the data using the date range or the fields.
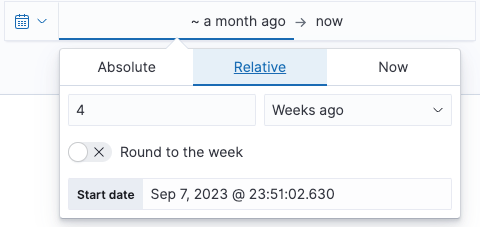
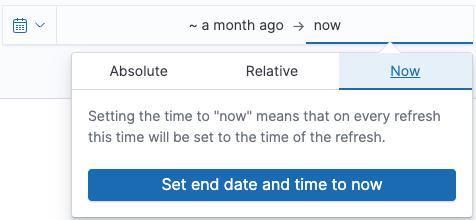
On the top right, you will find the date range filter. You can adjust the range to analyze data for specific periods.
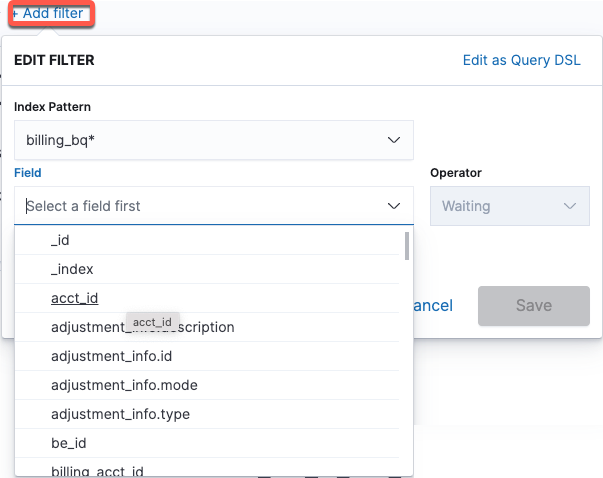
On the top left, there is a comprehensive list of fields you can use for filtering. Click the Add filter link and choose a field. Common filters include acct_id, billing_acct_id, and project.id. You can also choose an operator to filter down to specific criteria.
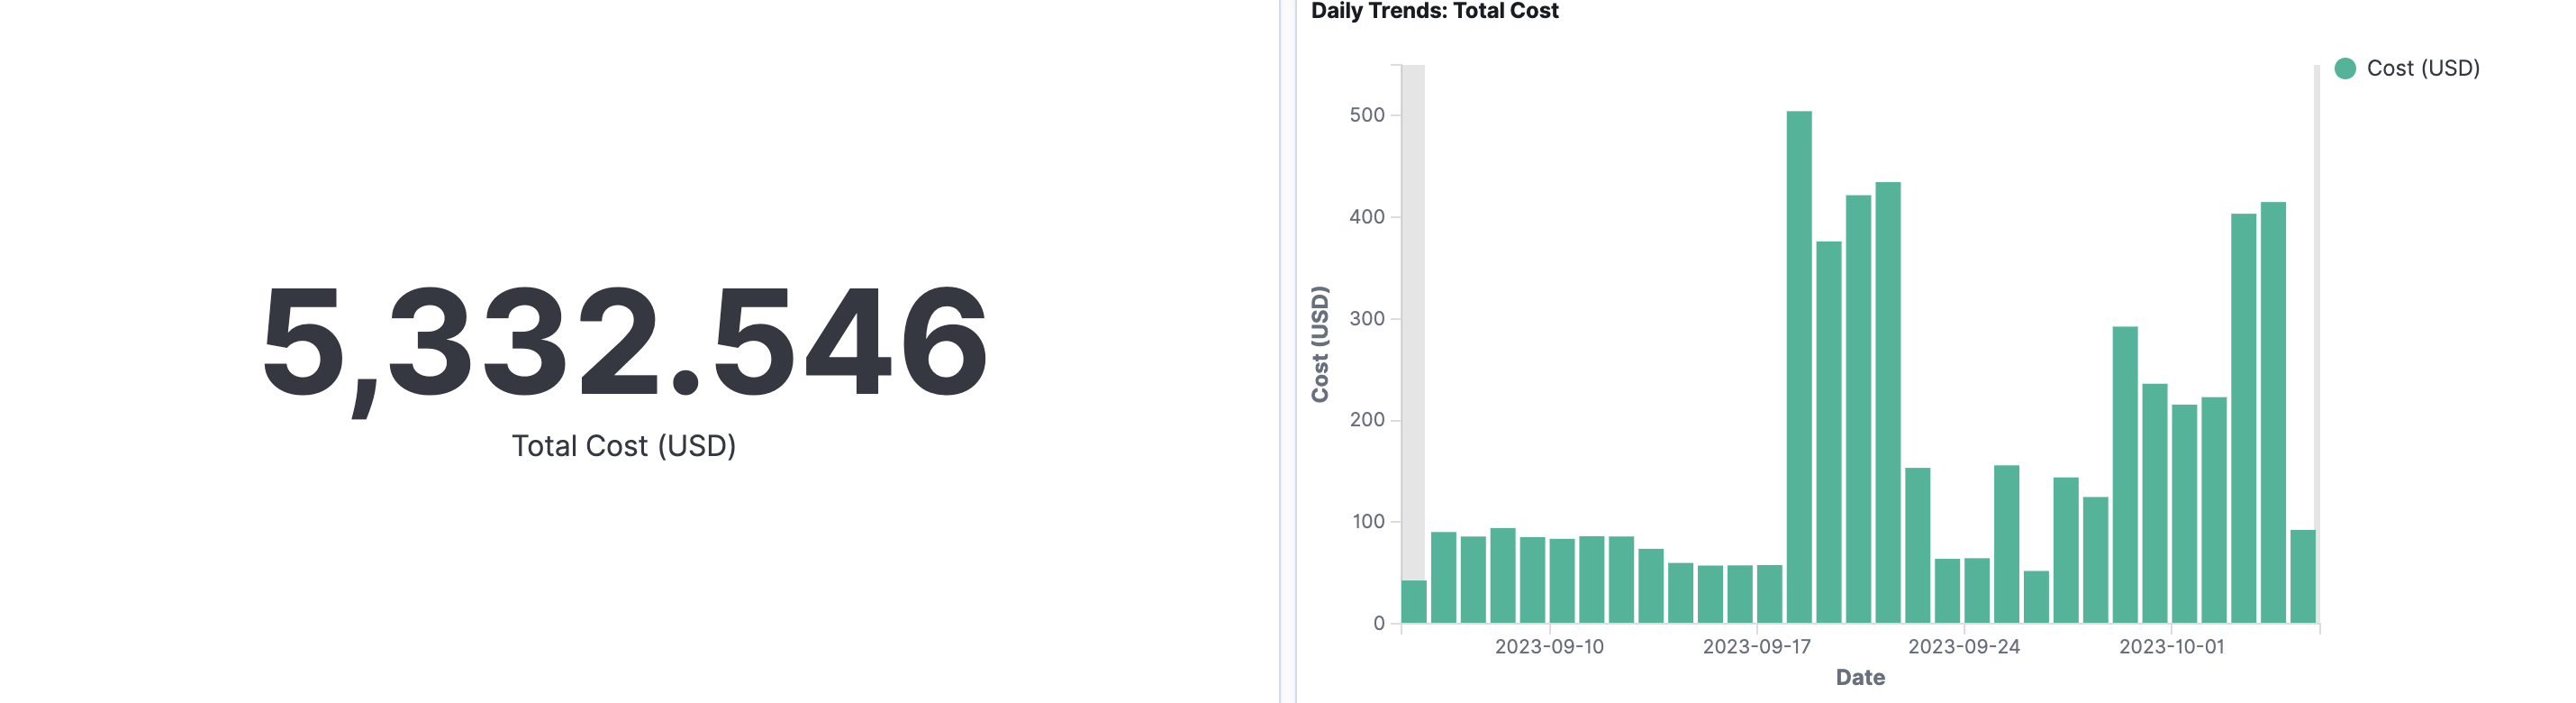
At the top of the page, you will find the total cost incurred in the specified period and a daily trend graph, which shows the changes in your BigQuery cost over time.
Scroll down to the Service cost section. A detailed breakdown of the Service costs is presented. The total service cost breakdown by Compute, Storage, and Others is represented in a pie chart as well as a daily trend graph.
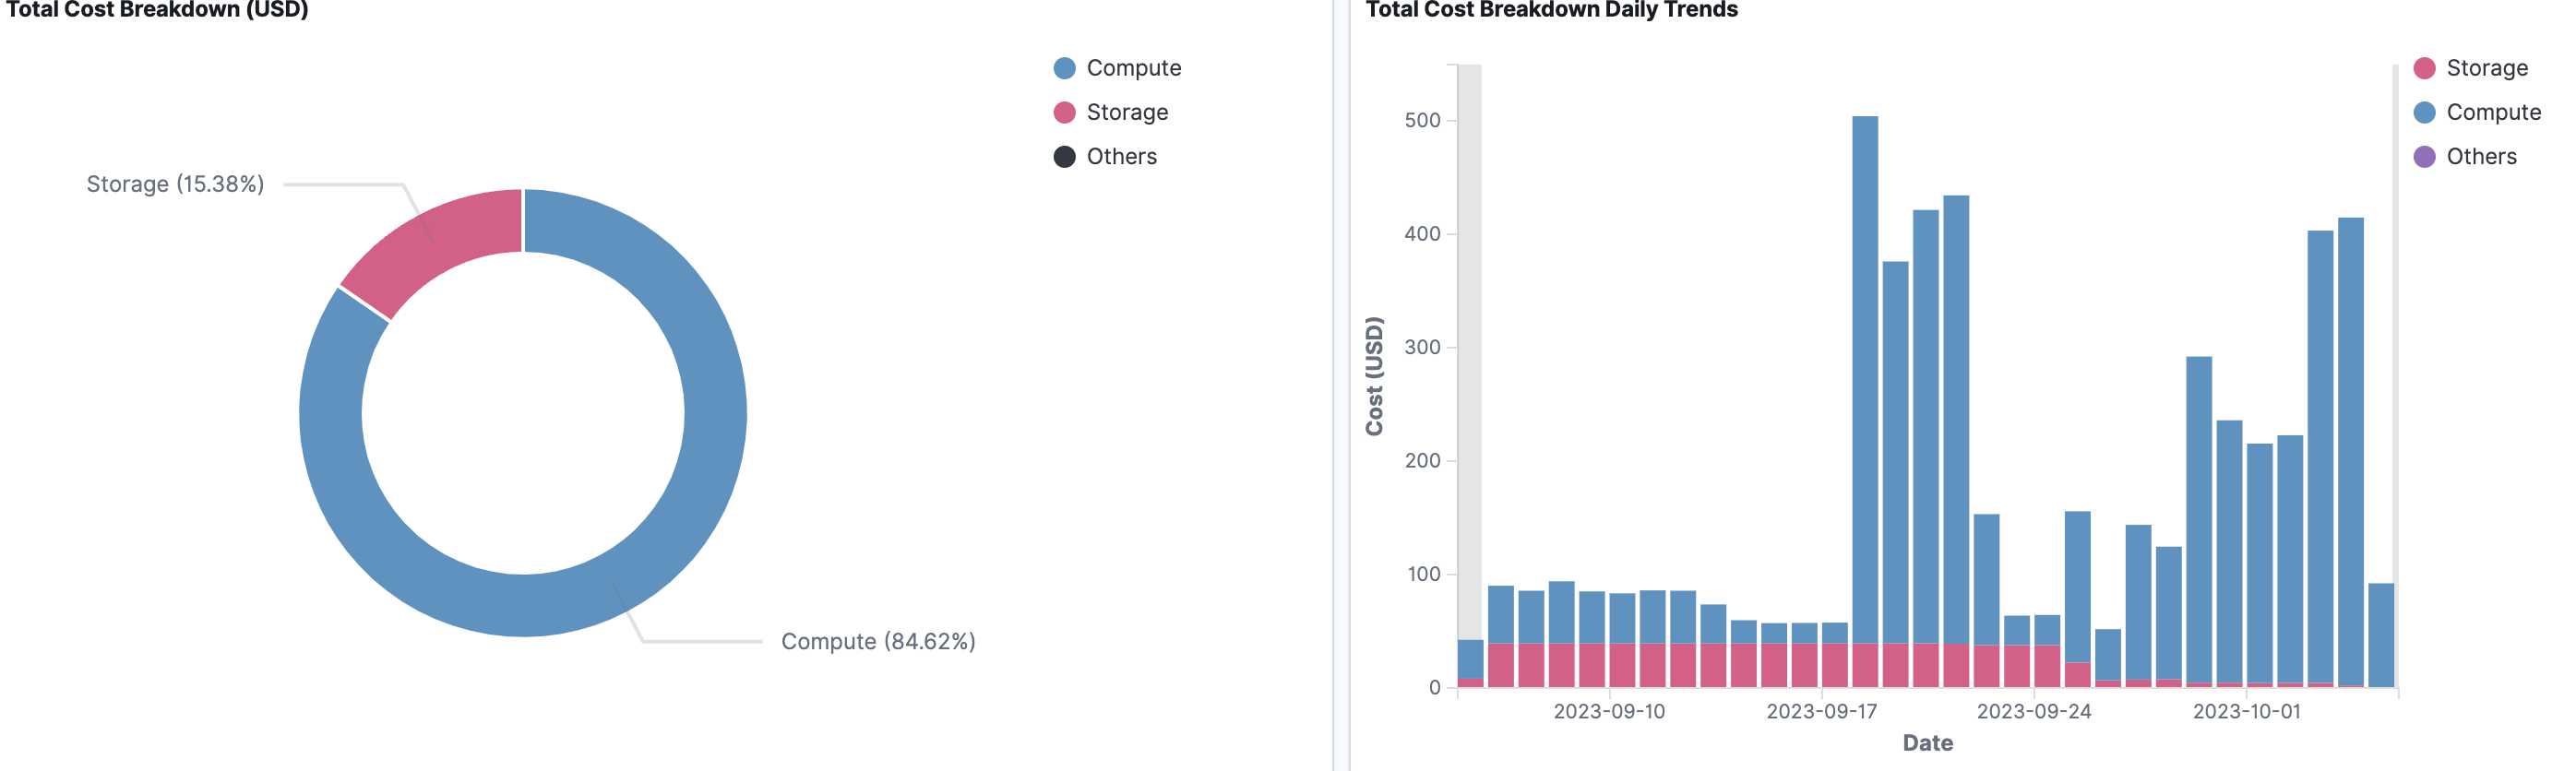
Scroll down in the Service cost section. The breakdown and daily trend graphs are shown for Compute, Storage, and Other costs.
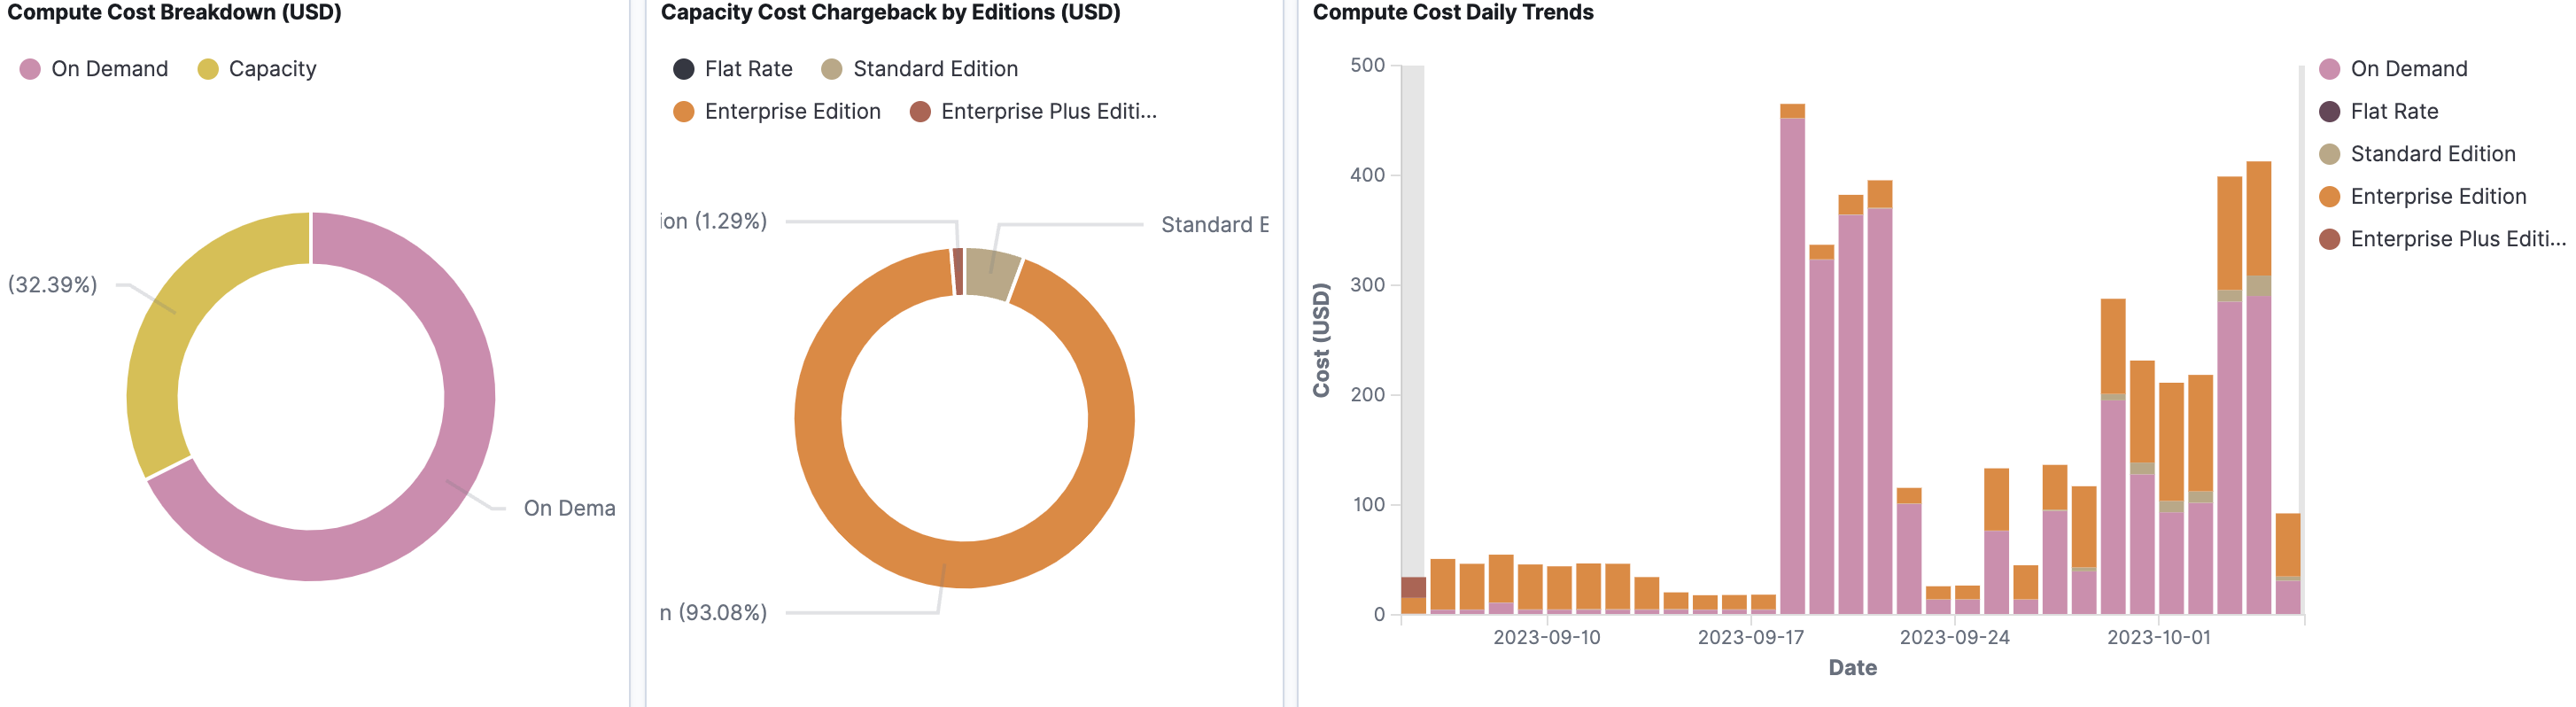
Compute Cost encompasses both legacy costs and the new GCP edition costs, which are derived from GCP Billing Data and are categorized by Charge type into the following categories:
On-Demand
Editions capacity
Further breakdown of the Compute cost includes the Capacity cost, which is categorized by GCP Editions, such as Standard edition, Enterprise edition, and Enterprise Plus edition. Compute cost data is also presented with daily breakdowns that allow you to analyze cost trends over time.