Insights (BigQuery)
The Insights Page offers a comprehensive overview of your operational processes, categorized into the following:
Within each of these categories, Unravel provides both graphical representations and tabular data, which displays top K insights with the highest potential for cost optimization. The Insights Impact Score metric is utilized to quantify the potential impact of these insights on cost optimization, enabling insights to be ranked by their impact significance, with the absolute value bearing significance only in relative comparison.
Viewing Reservation insights
For the BigQuery Reservations that you are monitoring, Unravel provides insights that are derived from historical consumption patterns. Reservations encompass both baseline slots, which are consistently allocated, and autoscaled slots, which adapt dynamically in response to your workload's demands. Unravel's reservation insight offers recommendations for optimizing the baseline and maximum settings based on the observed workload.
Estimations of potential savings associated with each reservation insight are also shown. These insights are sorted by impact to your data platform and also require action.
Tip
For Reservations, consider insights with higher impact scores for immediate cost reduction.
Do the following to view Reservations insights:
From the Unravel UI, click Insights.
Filter the data using the date range or the fields.
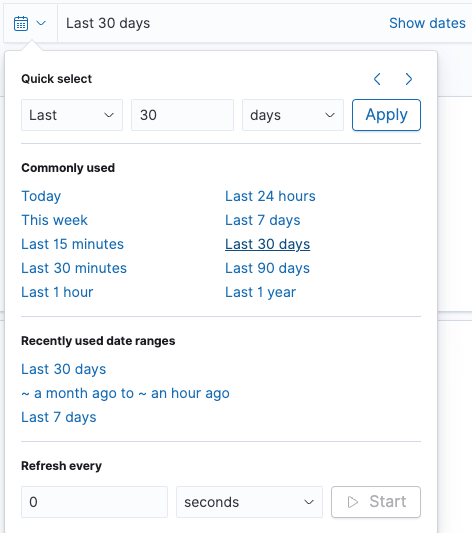
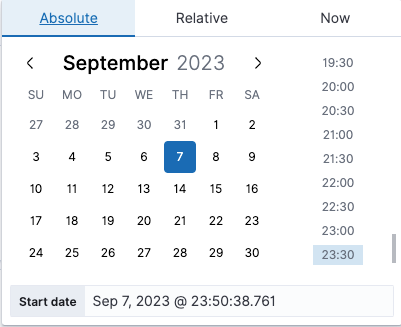
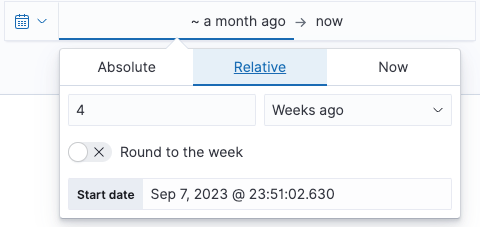
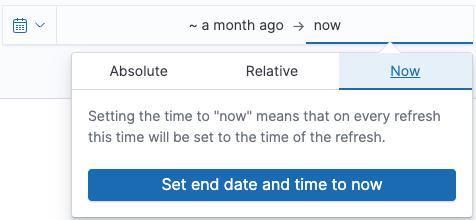
On the top right, you will find the date range filter. You can adjust the range to analyze data for specific periods.
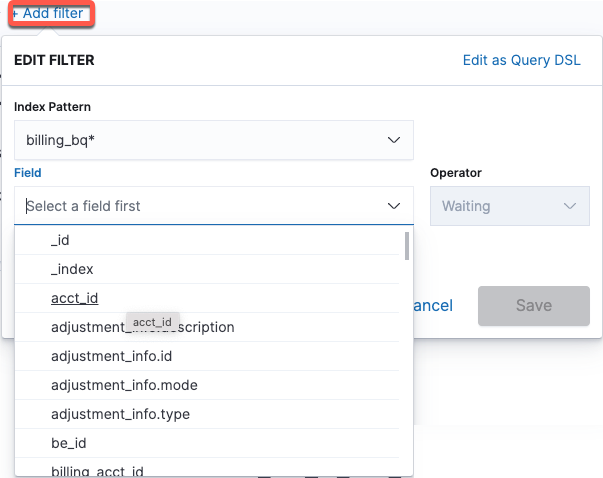
On the top left, there is a comprehensive list of fields you can use for filtering. Click the Add filter link and choose a field. Common filters include acct_id, billing_acct_id, and project_id. You can also choose an operator to filter down to a specific
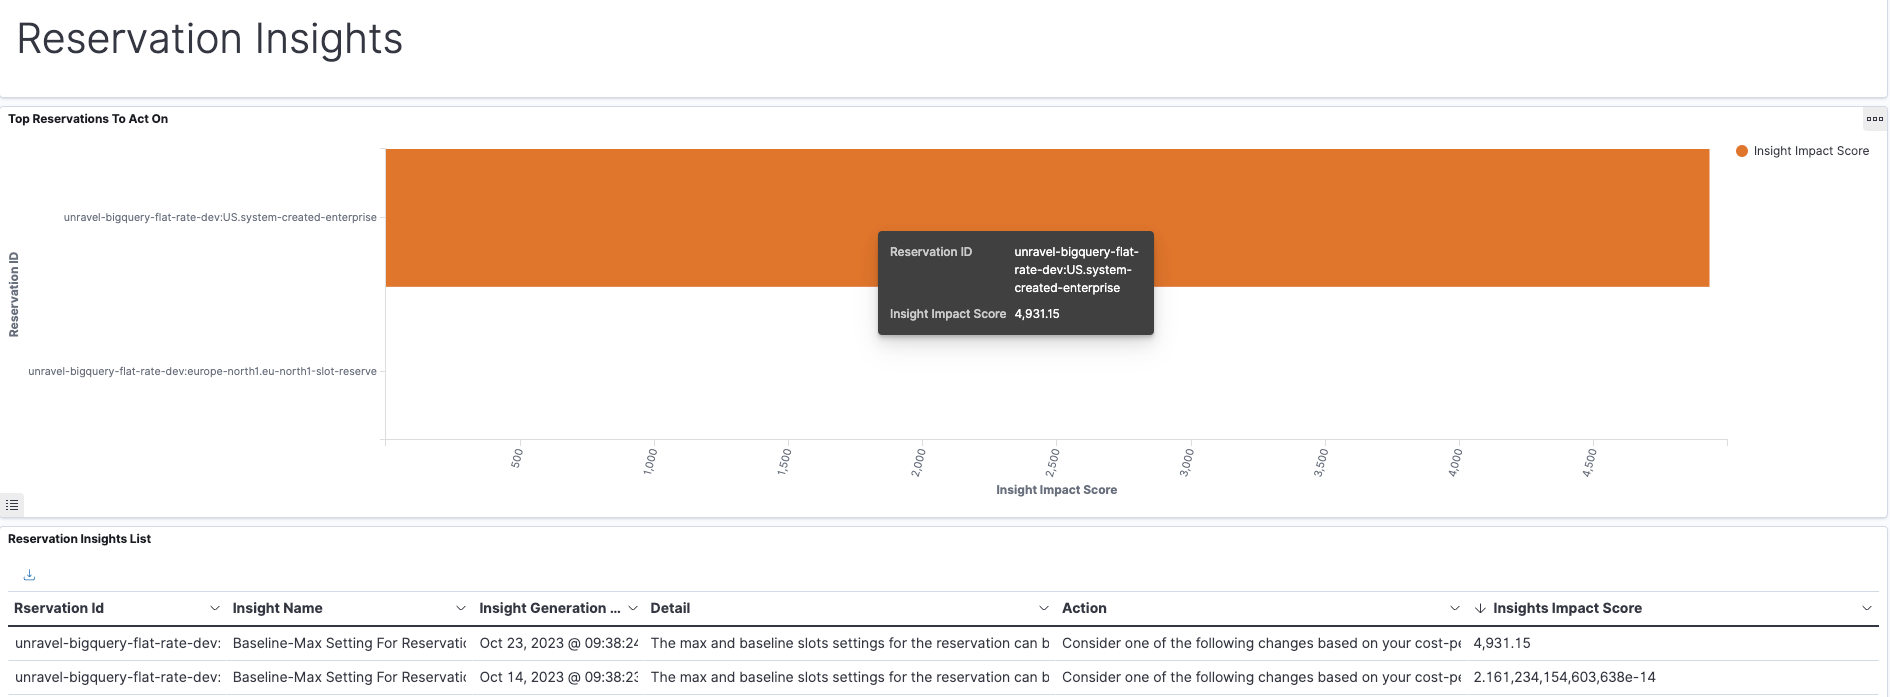
Scroll down to the Reservations Insights section. The top reservations to act upon are highlighted and shown in the trend graph, based on their insight impact score. The details are shown in the table below.
Hover over the action provided for a reservation ID and click
 . The details of the action is shown. You must take the recommended actions to attain cost optimization.
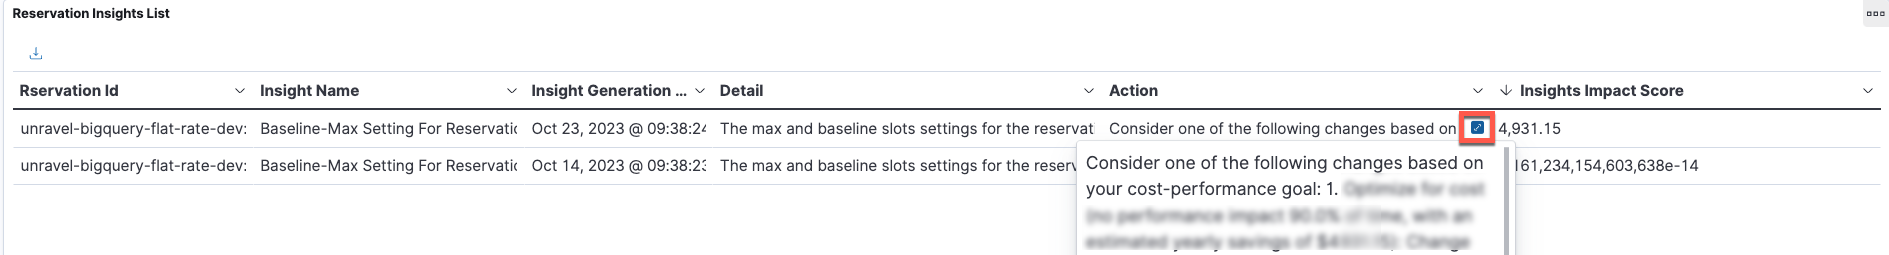
Viewing the Job insights
The Job insights present estimated savings that come with acting upon the assessments. You must address the job insights for improved resource utilization and efficient processing.
Do the following to view Job insights:
From the Unravel UI, click Insights.
Filter the data using the date range or the fields.
On the top right, you will find the date range filter. You can adjust the range to analyze data for specific periods.
On the top left, there is a comprehensive list of fields you can use for filtering. Click Add filter link and choose a field. Common filters include acct_id, billing_acct_id, and project_id. You can also choose an operator to filter down to a specific
Scroll down to the Job Insights section. The top job IDs to act upon are highlighted and shown in the trend graph, based on their insight impact score. More details are shown in the table below.
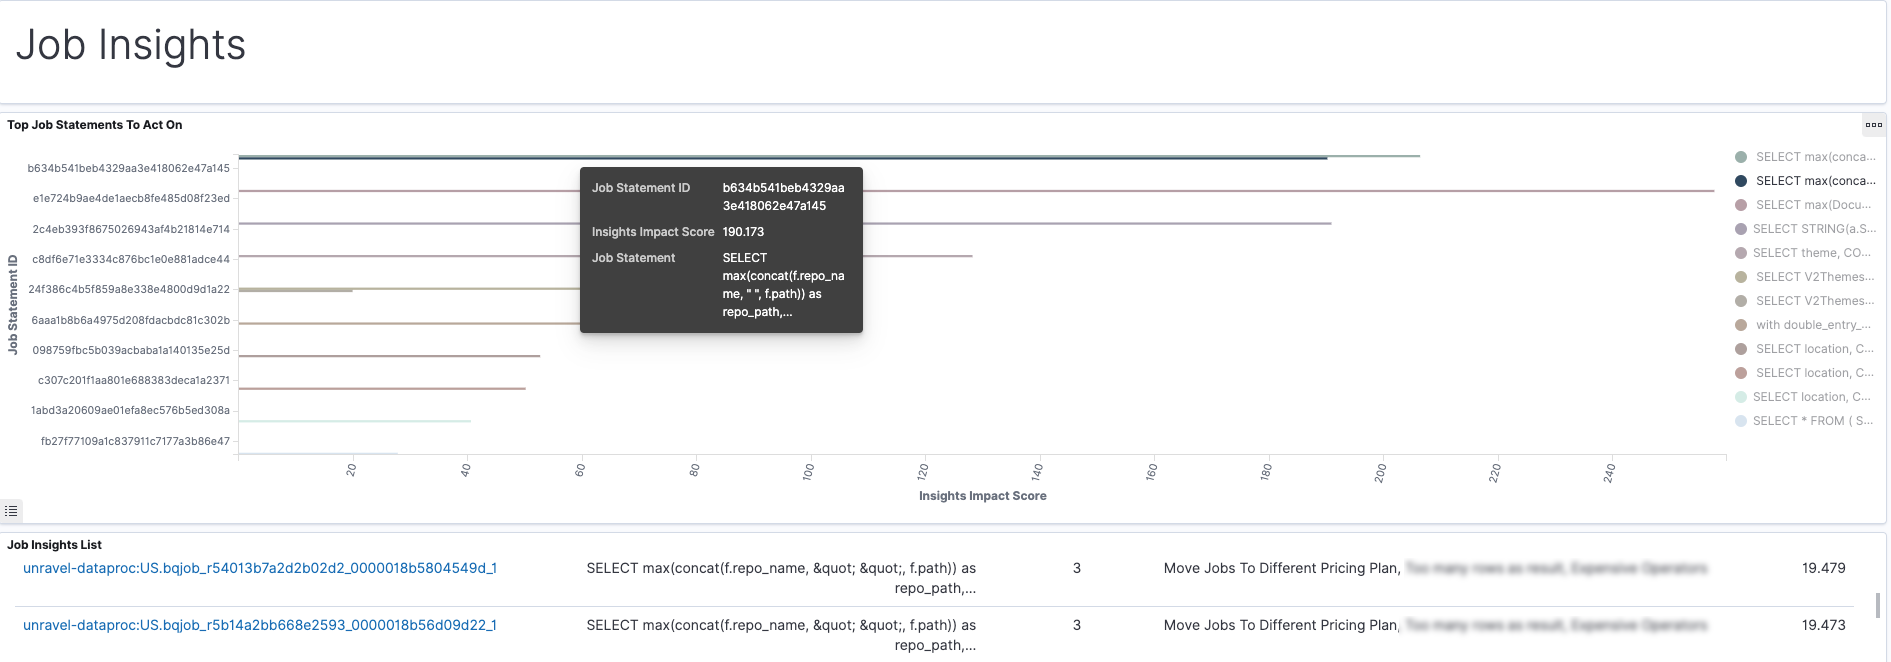
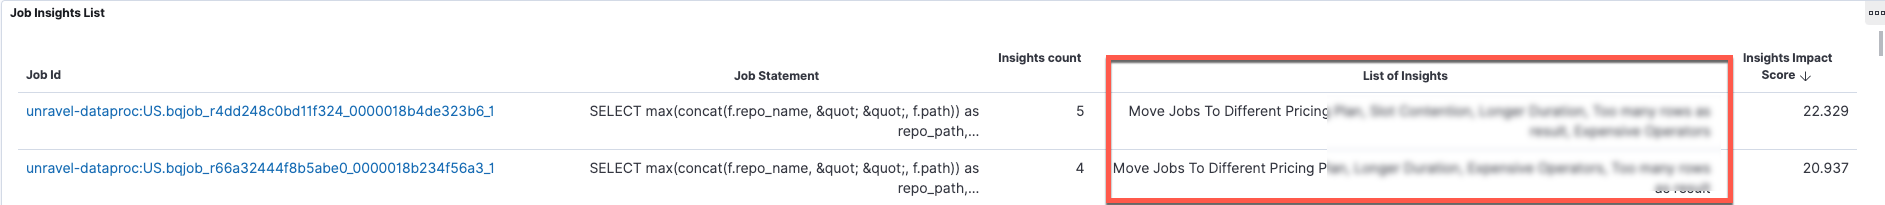
From the Job Insights List table, address the suggestions provided in the List of Insights column. You can also click the Jobs ID link to view the corresponding Job details page.
Viewing the Scheduled Queries insights
Note
The Scheduled Query insights are not available if you have chosen the INFORMATION-SCHEMA polling method.
Schedule Query insights are all about the schedule of a recurring query. These insights are based on how often the queries run and on the recommendations from Unravel for optimization. You can implement the recommendations to enhance query performance.
Do the following to view Scheduled Queries insights:
From the Unravel UI, click Insights.
Filter the data using the date range or the fields.
On the top right, you will find the date range filter. You can adjust the range to analyze data for specific periods.
On the top left, there is a comprehensive list of fields you can use for filtering. Click Add filter link and choose a field. Common filters include acct_id, billing_acct_id, and project_id. You can also choose an operator to filter down to a specific
Scroll down to the Scheduled Insights section. The top schedule config IDs to act upon are highlighted and shown in the trend graph, based on their insight impact score. More details are shown in the table below.
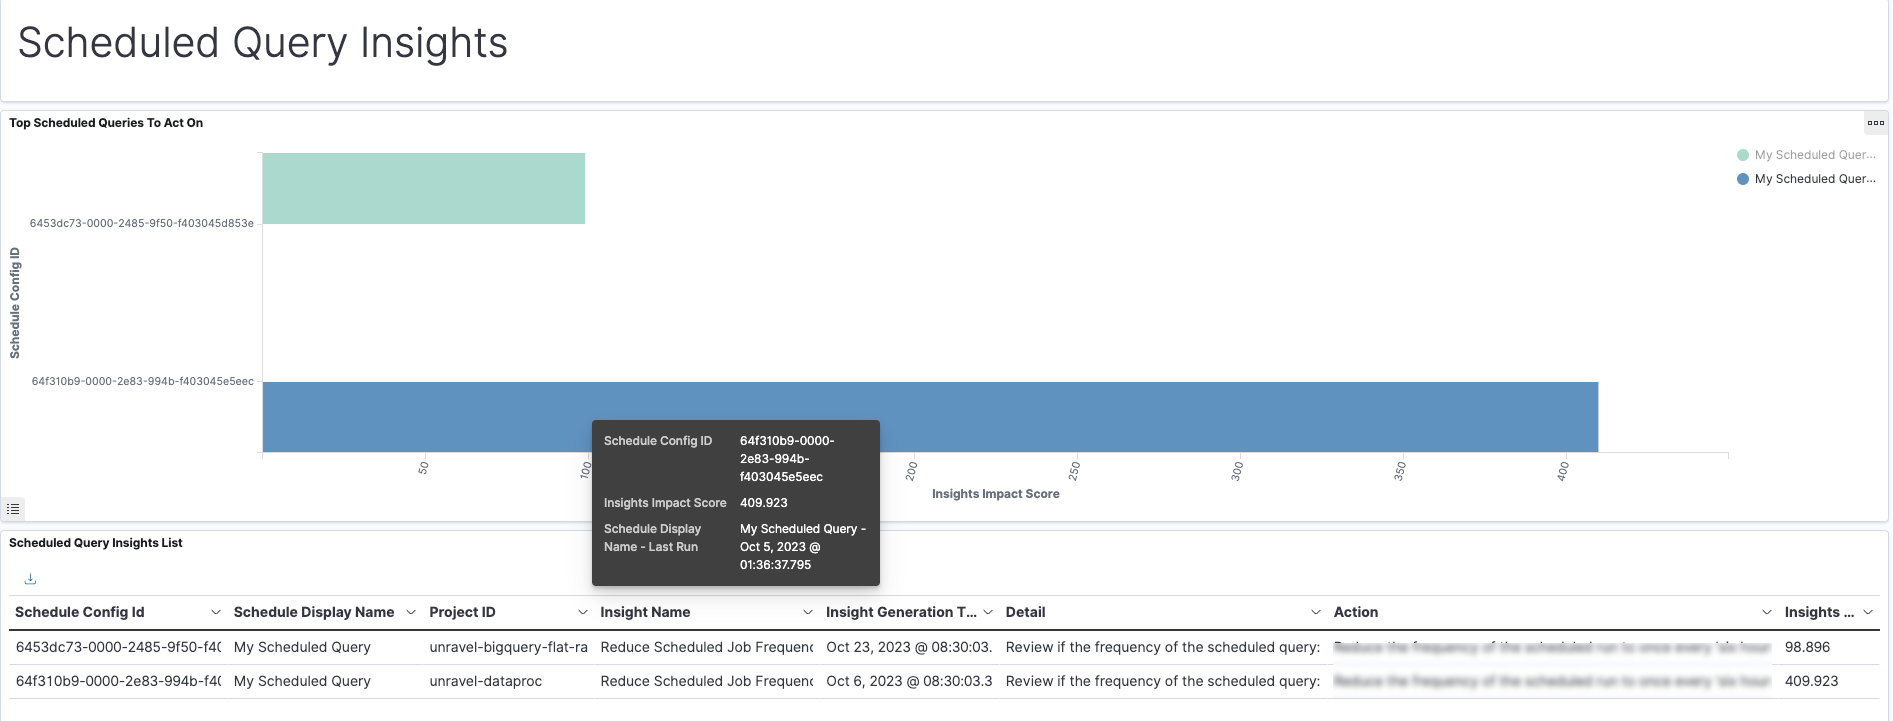
In the Scheduled Query Insights List hover over the action provided for a Schedule config ID in the Action column and click
. The details of the action is shown. You must address the recommended actions from the GCP console. 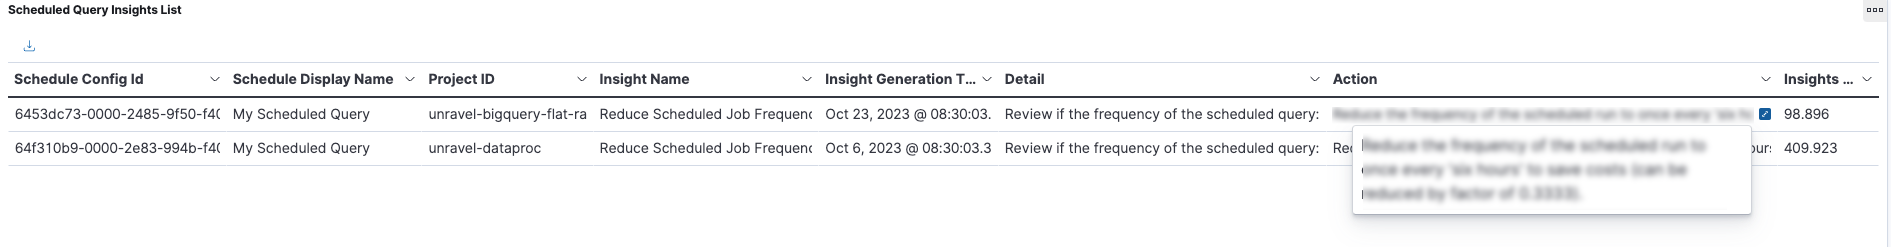
Viewing the Project insights
Project insights recommend setting custom quotas on projects for cost control. Quotas help prevent resource overrun and cost escalation. There are two types of Quotas:
Project-level custom quotas limit the aggregate usage of all users in that project.
User-level custom quotas are separately applied to all users and service accounts within a project.
Set project quotas as recommended by Unravel to control costs effectively.
Do the following to view Project insights:
From the Unravel UI, click Insights.
Filter the data using the date range or the fields.
On the top right, you will find the date range filter. You can adjust the range to analyze data for specific periods.
On the top left, there is a comprehensive list of fields you can use for filtering. Click the Add filter link and choose a field. Common filters include acct_id, billing_acct_id, and project_id. You can also choose an operator to filter down to a specific
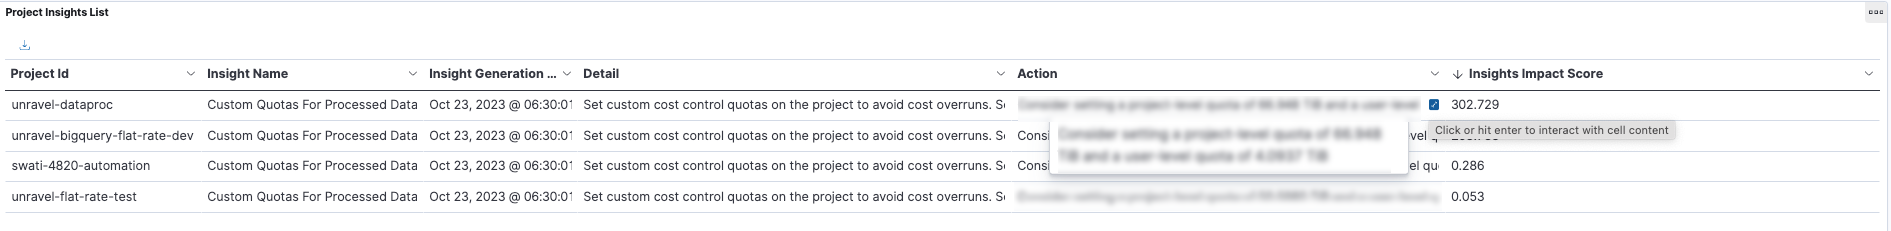
Scroll down to the Project Insights section. The top projects to act upon are highlighted and shown in the trend graph based on their insight impact score. More details are shown in the table below.
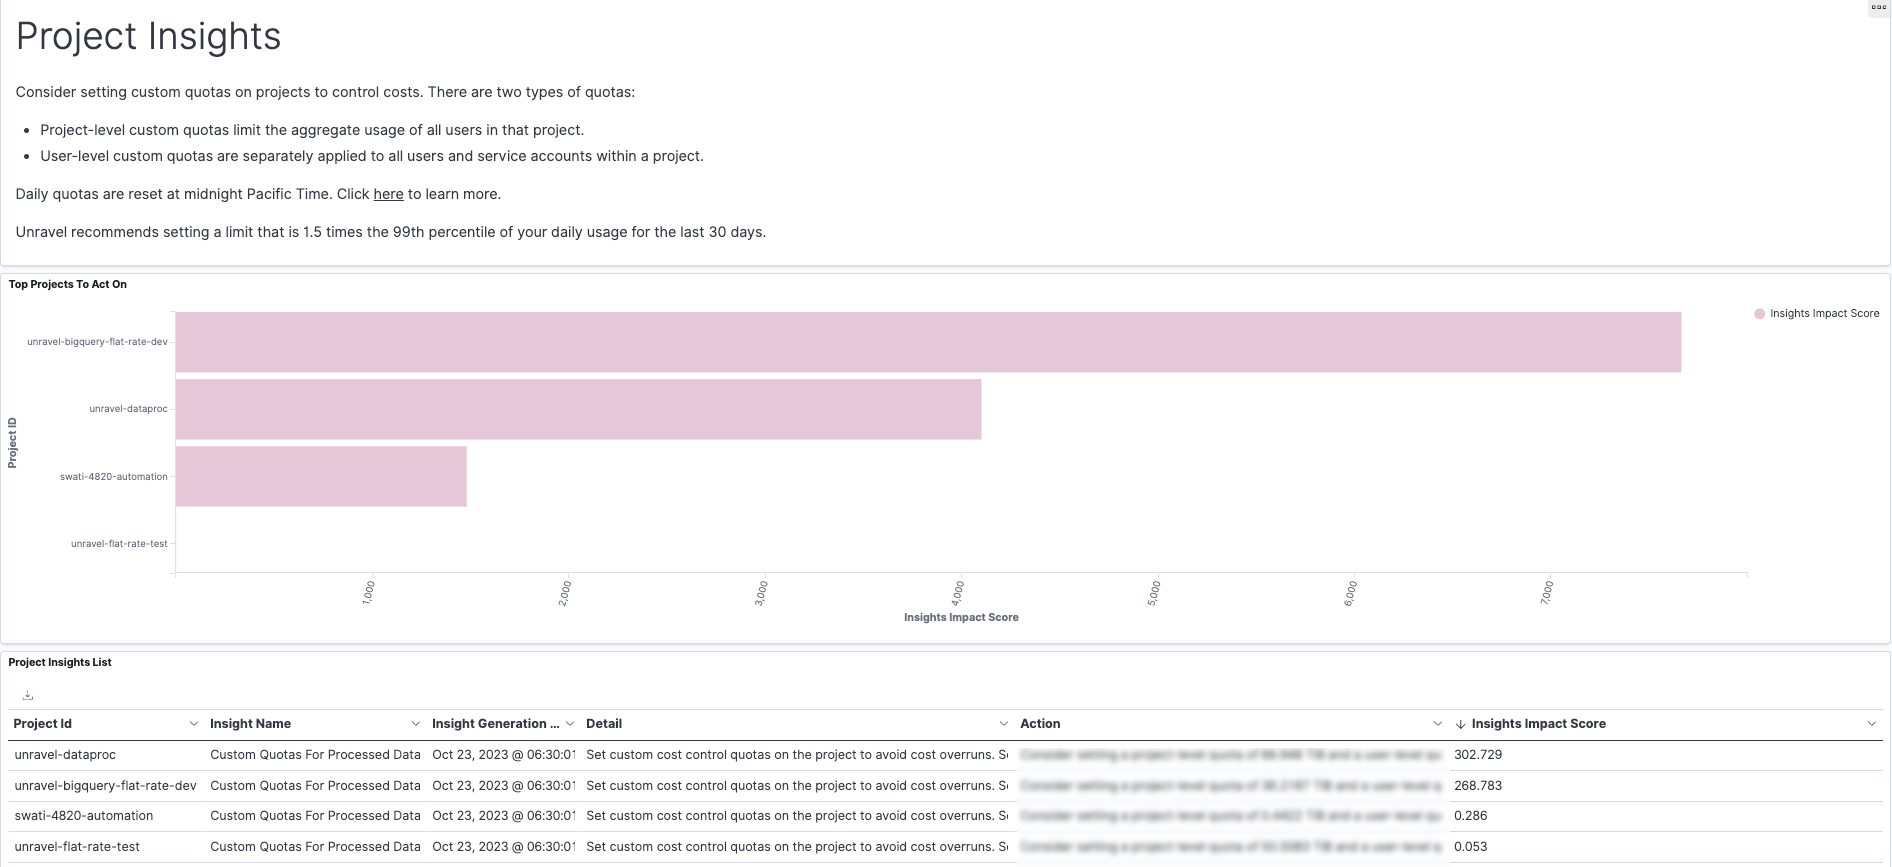
In the Project Insights List, hover over the action provided for a Project ID in the Action column and click
. The details of the action are shown. You must address the recommended actions for setting up the custom quotas.