Alerting
You can create monitors or modify the pre-existing monitor templates to generate alerts, which will inform you when specific alert conditions are met. The following default monitor templates are available for Unravel on BigQuery and Snowflake:
BigQuery
Longest Jobs by Slot Milliseconds (Percentage)
Generate alerts for jobs, above the Xth percentile of slot milliseconds, in a specific range.
Longest Jobs by Slot Milliseconds (Absolute)
Generate alerts when a job exceeds the specified slot milliseconds in a particular range.
Longest Jobs by Duration (Percentage)
Generate alerts for jobs above the Xth percentile of duration in a specific range.
Longest Jobs by Duration (Absolute)
Generate alerts when a job exceeds a given duration in a specific range.
From the Alerting section, you can do the following:
Generating alerts
All the Unravel alerts are disabled by default. Do the following to start receiving notifications.
The monitors can be updated for any of the following types of notification channels:
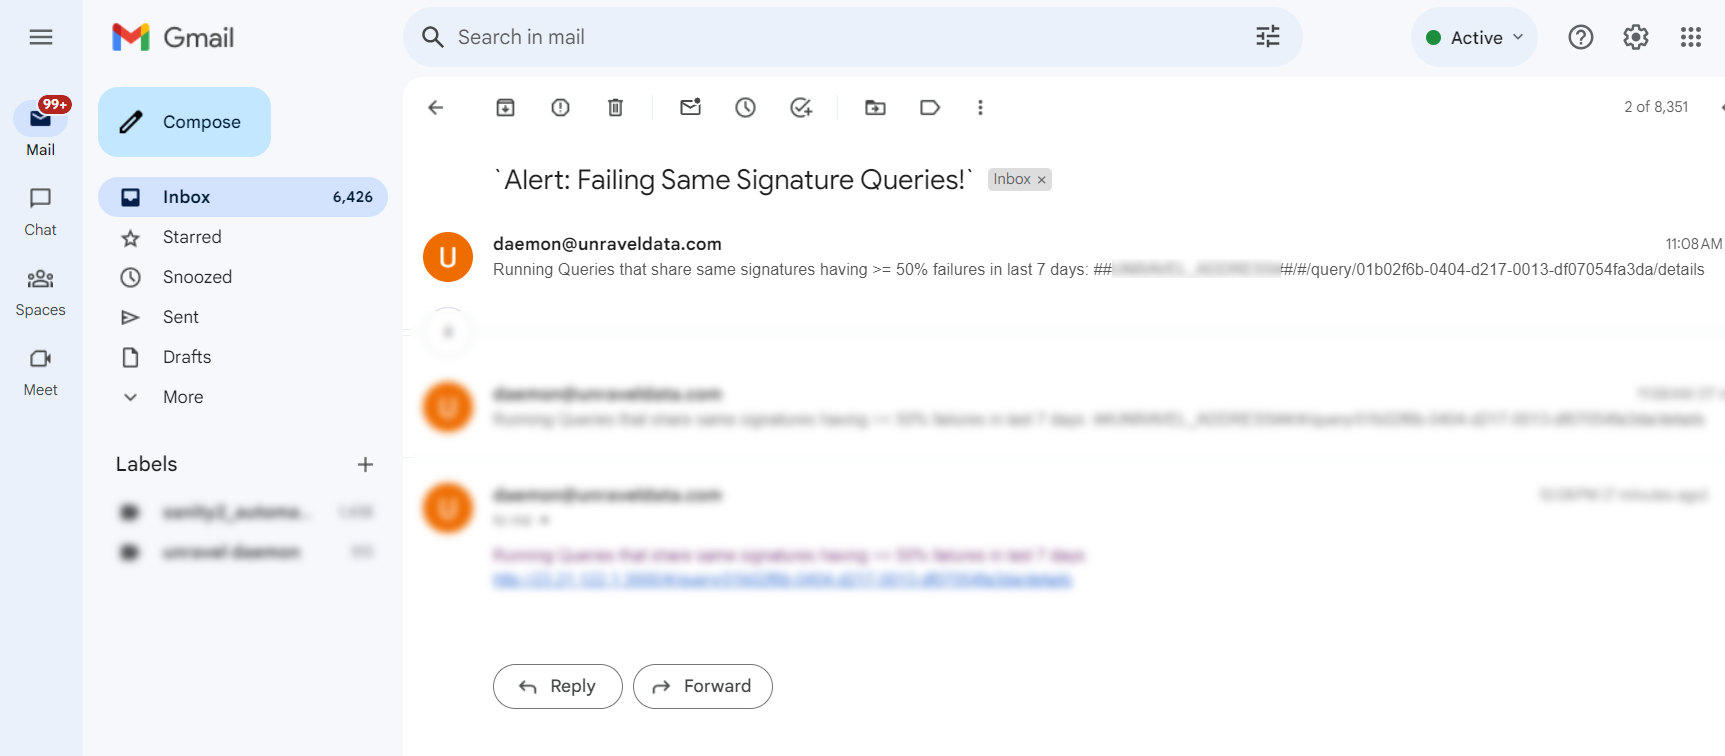
Email
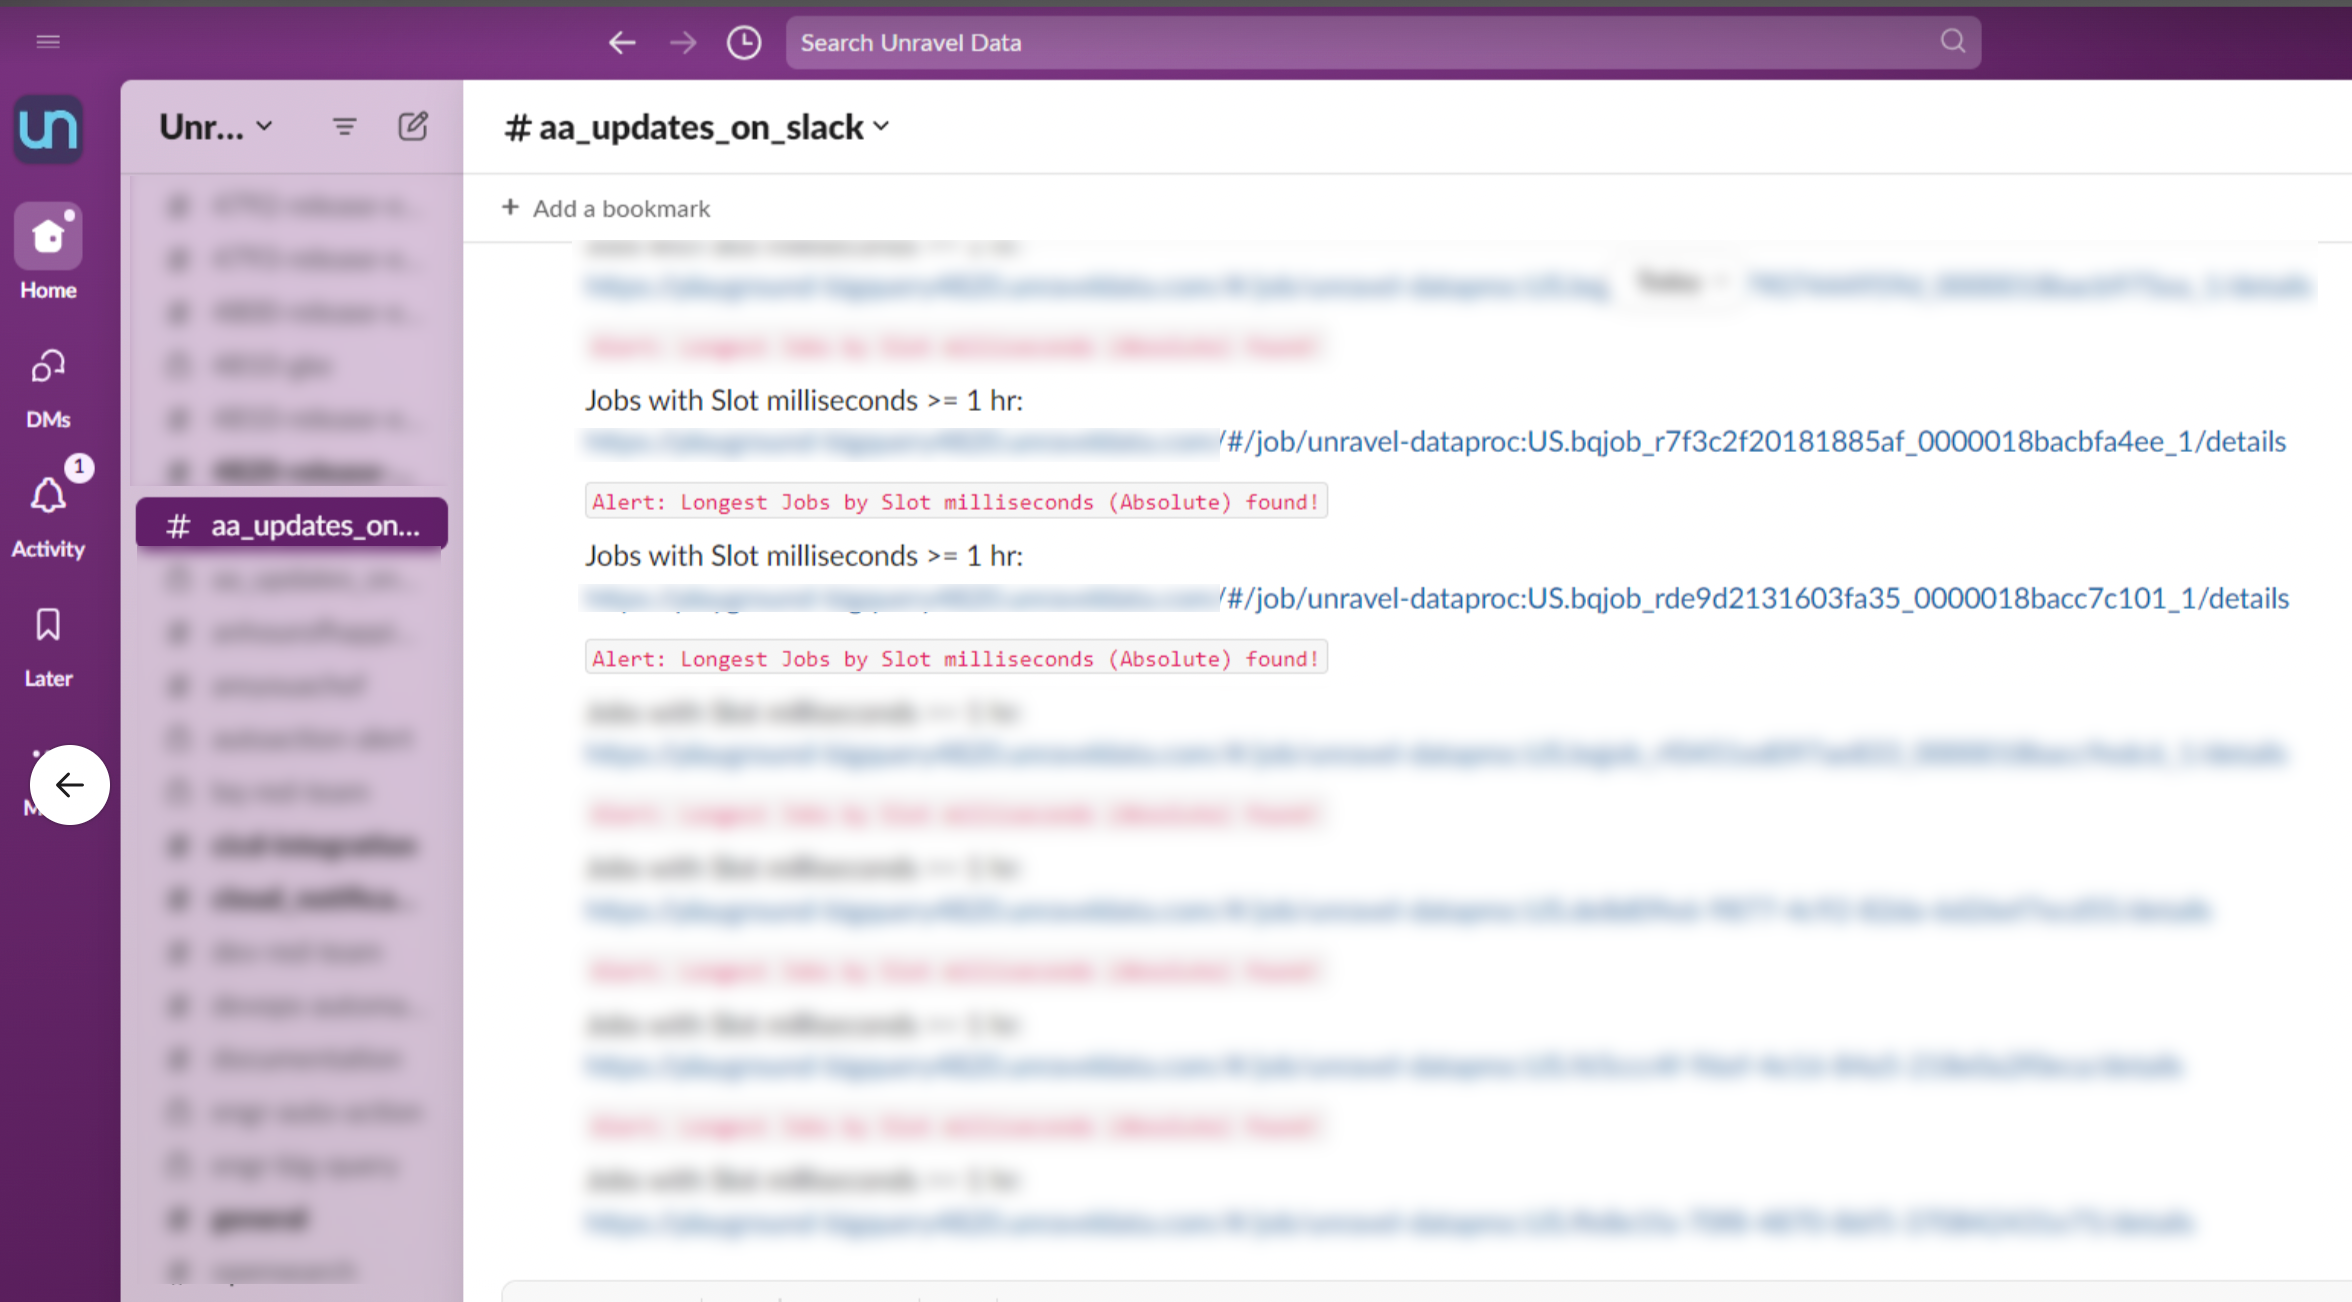
Slack
Microsoft Teams
Do the following:
From the Unravel UI, click the Alerting tab. The Alerting page is displayed.
Click the Monitors tab and select the checkbox corresponding to a monitor that you want for which you want to use a specific notification channel.
Click Edit. The corresponding monitor page is opened in edit mode.
Scroll down to the Trigger section, expand a trigger, and go to Actions section.
Click the Add another action button. A Notification dialog box is displayed.
Select the notification channel where you want to be notified. For example, Email or Slack channel. Refer to Creating notification channels.
In the Message Subject box, specify the subject of the email and enter the notification message. Replace ##UNRAVEL_ADDRESS## with the Unravel host address. For example, https://unravel-dev-bq.com.
Tip
Click the Preview message check box to view a preview of the alert message content.
Click Update.
From the Unravel UI, click the Alerting tab. The Alerting page is displayed.
Click the Monitors tab and select the checkbox corresponding to a monitor that you want to enable.
From the Actions dropdown, select Enable. Likewise, you can select Disable to disable the monitor.
Receiving notifications
After you have enabled a monitor, alerts are generated, which you will receive in the notification channels that you have configured.
Creating a monitor for alerts
From the Unravel UI, click Alerting. The Alerting page is displayed showing two tabs; Alerts and Monitors.
Click the Monitors tab > Create Monitor button. The Create monitor page is displayed.
Enter the following details.
Fields
Description
Monitor Details
Monitor name
Provide a unique name for the monitor.
Monitor type
Specify the monitor type:
Per query monitor
This monitor type executes queries and raises alerts when the query results meet specific trigger criteria.
Per bucket monitor
This monitor type executes queries across different datasets and evaluates the trigger criteria by considering the aggregated values within each dataset.
Per cluster metrics monitor
This monitor type runs API requests to monitor the cluster health of your data platform.
Per document monitor
This monitor type runs queries that return individual documents matching the trigger conditions.
Monitor defining method
Specify the method you want to use to define your query and triggers. You can choose one of the following options:
Visual editor: In this method, you can define the query and triggers from the UI.
Extraction query editor: In this method, you can define the query and triggers from a query editor.
Schedule
Frequency
Specify the frequency, which can be By interval, daily, weekly, monthly, or via custom cron expression. Enter further details that are prompted for the selected option.
Note
Unravel recommends using 5 minutes. This helps reduce alert fatigue, although keep in mind that if your selected metric is less than 5 minutes, you might miss some long-running jobs.
Run every
Specify the period range to run the query. This can be minutes, hours, or days.
Data Source
Index
Select a data source index.
Time field
Choose the time field you want to use for your x-axis.
Query
Metrics
Specify a metric for monitoring.
Time range for the last
Specify a timeframe of the data for monitoring.
Data filter
Specify Data filter. This is optional.
Group by
Specify a group by filter.
Scroll down to the Trigger section, expand the trigger, and click Add Another Action. A Notification dialog box is displayed.
Specify a name for the action and select a notification channel. These channels are listed here only if you have created them. Refer to Creating notification channels.
In the Message subject box, specify the subject of the notification message.
In the Message box, replace ##UNRAVEL_ADDRESS## with the Unravel host address. For example, https://unravel-dev-bq.com (if applicable).
Tip
Click the Preview message check box to view a preview of the alert message content.
Click Update.
Deleting the monitor
From the Unravel UI, click the Alerting tab. The Alerting page is displayed.
Click the Monitors tab and select the checkbox corresponding to a monitor that you want to delete.
From the Actions dropdown, select Delete.