Dashboards (BigQuery)
Unravel collects metadata pertaining to the following and other relevant information from your BigQuery account for monitoring and analytical purposes:
Reservations
Capacity commitments
Queries
Billing data
Projects
Storage
This data is then visually presented through a range of insights, tables, and trend graphs from the Unravel user interface.
You can harness this collected metadata to construct custom dashboards tailored to your specific needs. For example, if your objective is to track the daily Slot MS consumption in BigQuery queries, you can effectively use the Slot MS metadata within Unravel to design a customized dashboard that precisely meets your use case.
Unravel provides the following default dashboards in BigQuery. These can be used as a foundation to create new customized dashboards.
Tip
Unravel recommends that you clone the default dashboards and only then proceed with your customizations.
Cost dashboards (Cost 360 and TopK)
Insights dashboards
From the Dashboards tab, you can do the following:
Viewing default system dashboards
From the Unravel UI, click Dashboards. The Dashboards page is displayed with the listing of all the available dashboards.
Click the link of the Dashboards with the System prefix. All the default dashboards of Unravel are prefixed with the term System.
Create a customized dashboard
The Dashboard UI contains the following main components which are used in creating a customized dashboard.
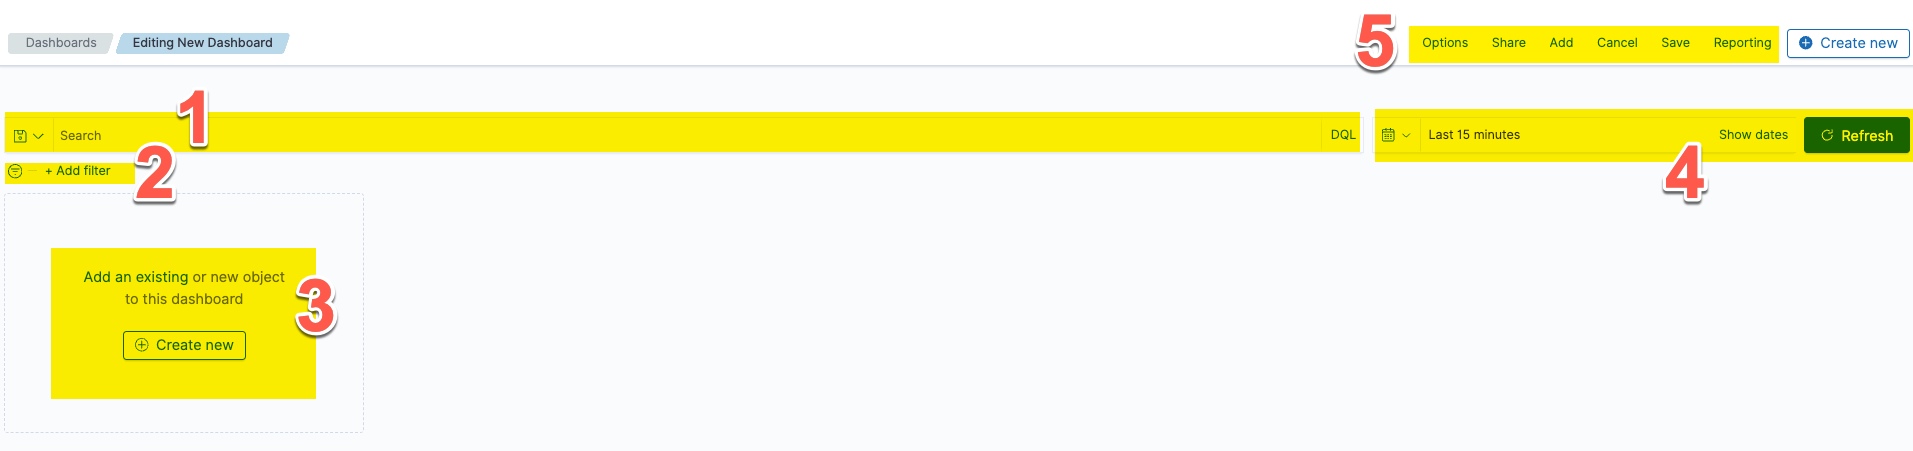
The Search bar allows you to search for documents and other objects and add filters.
The built-in filters lets you search and narrow the dashboard results.
Lets you add existing or new visualizations to a dashboard.
Time filter, which allows you to narrow down the time period for your dashboards.
Toolbar, where you can find the most frequently used commands and shortcuts
Do the following to create a customized dashboard:
From the Unravel UI, click Dashboards. The Dashboards page is displayed with the listing of all the available dashboards.
Click Create > Dashboard.
You can also filter the data using the date range or fields.
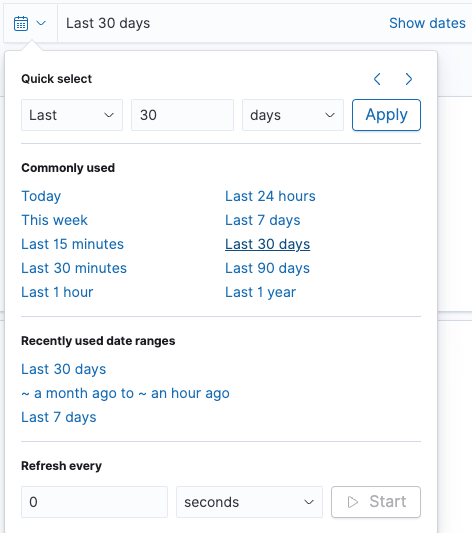
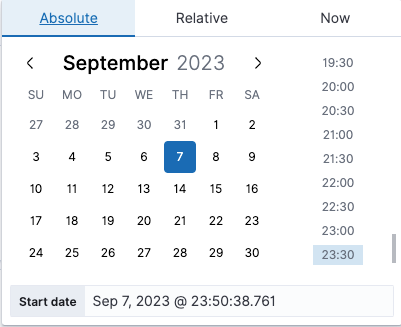
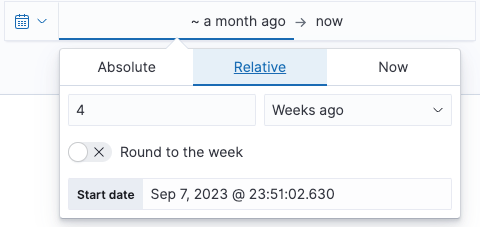
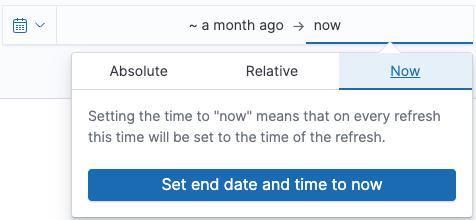
On the top right, you will find the date range filter. You can adjust the range to analyze data for specific periods.
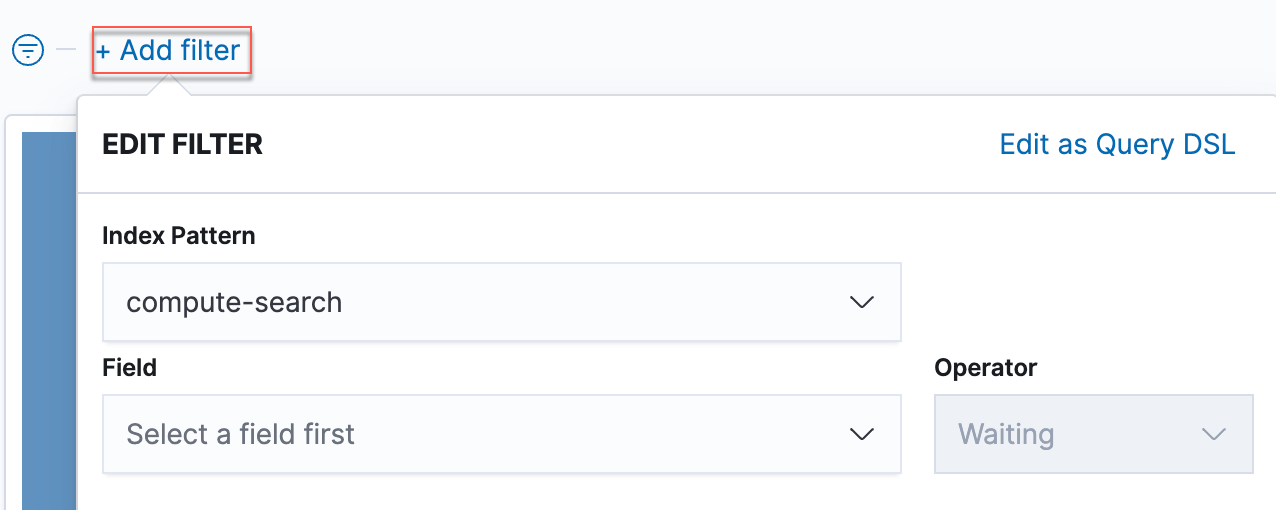
On the top left, you can find a list of fields you can use for filtering. Click the the Add filter link and choose an Index Pattern, Field, and Operator to filter for the required values. You can also create a Custom Label or search using Query DSL.
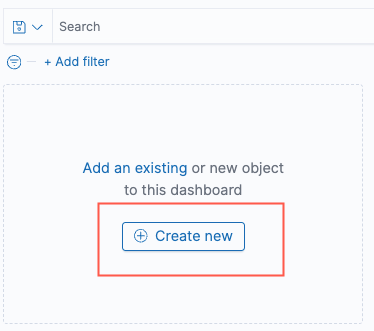
From the panel on the left, either click Add an existing or click Create New. This adds a panel to your dashboard.
Add an existing
When you click Add an existing. The Add panels window is displayed with the existing dashboards. You can search the existing Dashboard and click the dashboard link. The selected item gets added to your dashboard.
Create New
When you click Create New. The New Visualization window is displayed, which displays all the visualization types available to create the dashboard. Click the icon of a visualization type and specify the details. Refer to Understanding the visualization types in OpenSearch Dashboards for more details.
Click Create New.
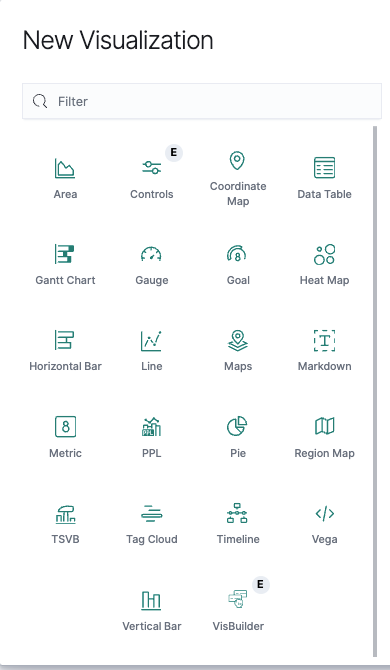
From the New Visualization window. Select a Visualization type. For example, choose Gauge and then select the source. You can further choose the required fields and update them.
From the toolbar, click Save. The Save dashboard box is displayed.

Specify a title and description for the visualization. You can also use the Store time with dashboard toggle. This persists the time filter to the currently selected time every time the dashboard is loaded. For example, if you have selected a range of the Last 7 days in the Date filter, every time you load the dashboard, the data from the Last 7 days gets reflected. Otherwise, the default of 15 minutes is also loaded and reflected.
Click Save. You can add subsequent panels to your Dashboard using Step 4.
Tip
From the Toolbar, you can do the following:
Click
 to view the dashboards in full screen.
 Click
 to share the dashboard using either embed code or permalinks.
 Click
 to duplicate the current dashboard.
 Click
 to generate a PDF or PNG download of the dashboard.
Editing a dashboard
From the Dashboards, select a dashboard that you want to edit.
Click
 at the top right of the toolbar.
  icon is displayed on the right corner of each visualization.
 Tip
If you see Create new at the top right of the toolbar, you are already in edit mode.
Click the
icon and click any of the following based on your requirements.Edit visualization to edit the data details within a visualization.
Edit panel title to edit the title of the panel.
Replace panel to choose another existing visualization panel to replace the current one.
Delete from Dashboard to remove the current visualization panel from the dashboard.
Tip
Click
 to discard any edits done in the visualization panels.
 From the toolbar, click Save. The Save dashboard box is displayed. You can either save with a new name and description, or you can keep the same title for the dashboard and click Save.
Tip
You can also do the following edits from the toolbar:
Click
 to toggle between using margins between the panel and showing panel titles.
 Click
 to add more visualization panels to your dashboard. Either add existing visualization or create new.