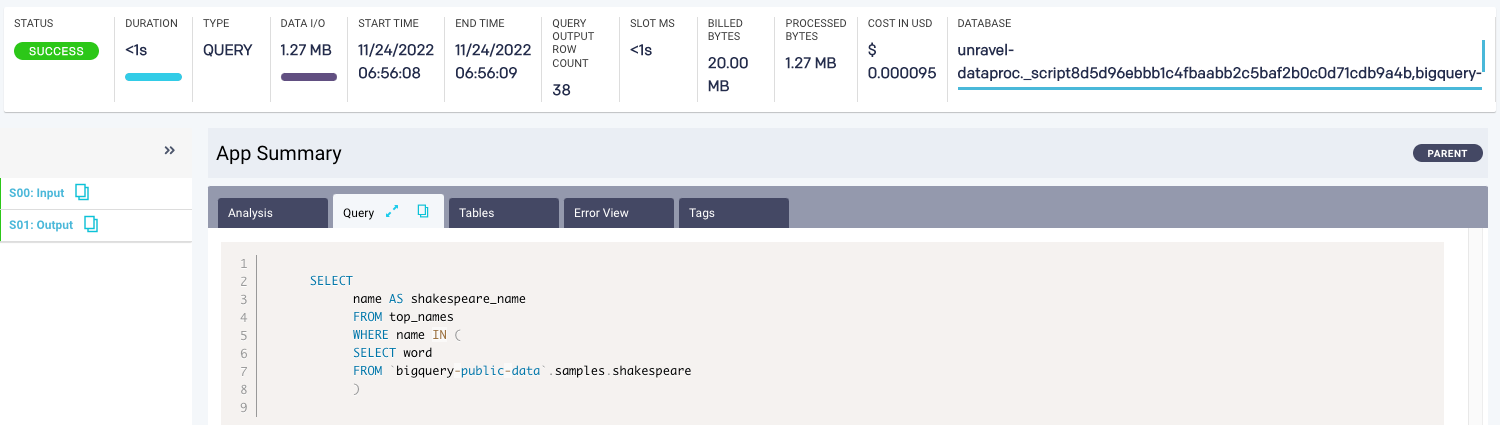
BigQuery details page
From the BigQuery details page, you can get the processing details of all the queries running in your BigQuery jobs. Moreover, you can also identify the utilization of resources based on each stage and the performance of a query.
Menu bar
When you open a BigQuery details page, the following details are displayed in the upper section of the page:

Item No | Description |
|---|---|
1 | Name of the BigQuery. Click the |
2 | An email ID of the owner or the service account of the owner who has run the job. |
3 | Name of the project where the job is run. |
4 | Type of the queue.
|
NoteClick the | |


KPIs

Option | Description |
|---|---|
Status | Displays the status (Success, Failed, or Running) of the job. |
Duration | Total time of the job run. |
Type | Displays the type of job run in BigQuery. For example, the following job types are displayed:
NoteBased on the job type, the available KPIs are displayed. |
Data I/O | Total data read and written by the job. |
Start Time | Start time of the job. |
End Time | End time of the job. |
Query Output Row Count | Total number of rows that the BigQuery job has provided as an output. |
Slot MS | Total time of the job run in the virtual CPU. |
Billed Bytes | A number of bytes (data) on which BigQuery is charging the amount. BigQuery provides the initial 1GB of data free of cost. |
Processed Bytes | The number of bytes the job has processed. |
Cost in USD | The cost associated with the query. The cost is displayed in Cents. The cost is computed based on the BigQuery pricing for the billed bytes related to on-demand pricing. |
Database | Name of the database where the job runs. |
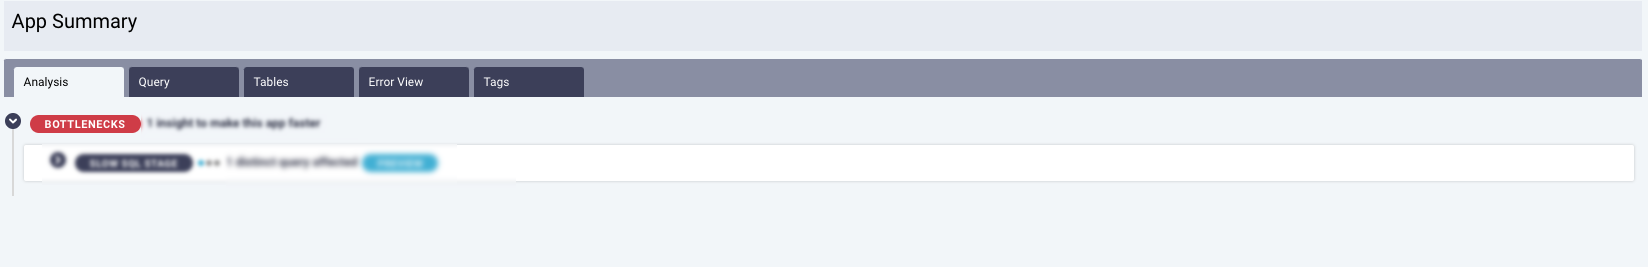
App Summary
The following tabs are displayed in the App Summary section:
Tab name | Description |
|---|---|
Analysis | The Unravel intelligence engine helps you manage your jobs and pipelines by analyzing its run and providing insights based on the runs. Unravel's analysis results show where the efficiencies of your job can be improved. The number of efficiencies found is noted in the tab. When an Efficiency leads to a suggested parameter or property change, those suggestions are listed as Recommendations.
|
Query | Displays the query that was run. |
Tables | Lists the names of the tables that were involved in the query run. The tables are categorized into Input and Output columns. After you click the table name, the Data page is displayed (if the table information is recorded on the Data page). The |
Error View | Lists the errors for the failed queries. From the Error View tab, you can do the following:
|
Tags | Lists tags associated with BigQuery. For example, department, person name, location, and so on. For more information, see Tagging. |
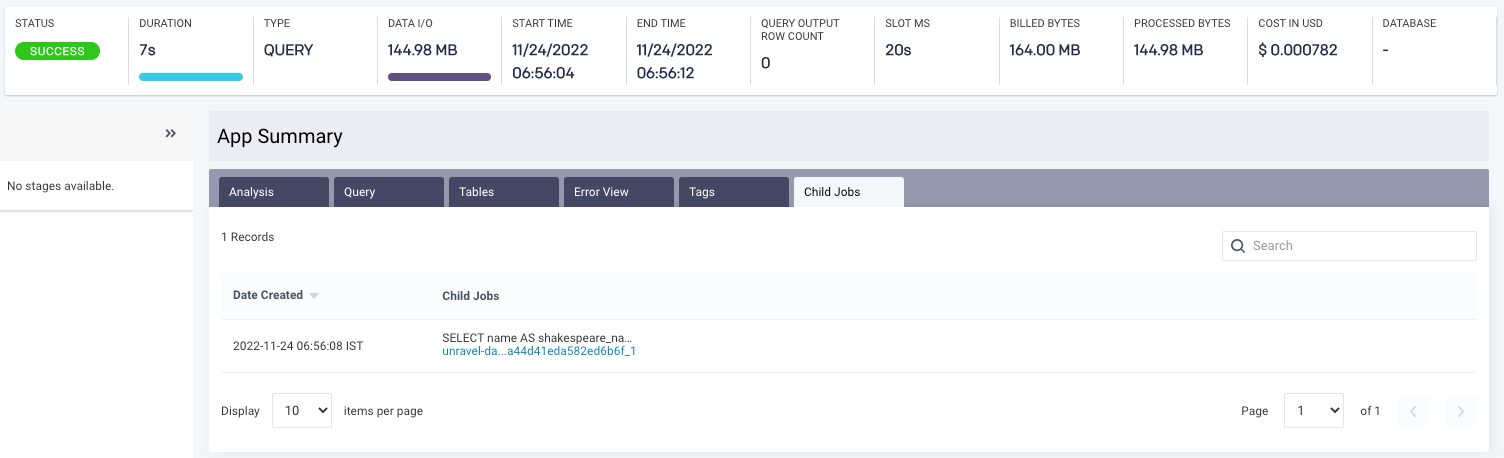
Child Jobs | Lists child jobs of the selected parent job. Displays the date and timestamp when the child job is executed. Click the job ID link to return to the child App Summary page. |


For cached queries, the following labels are displayed in the App Summary section:
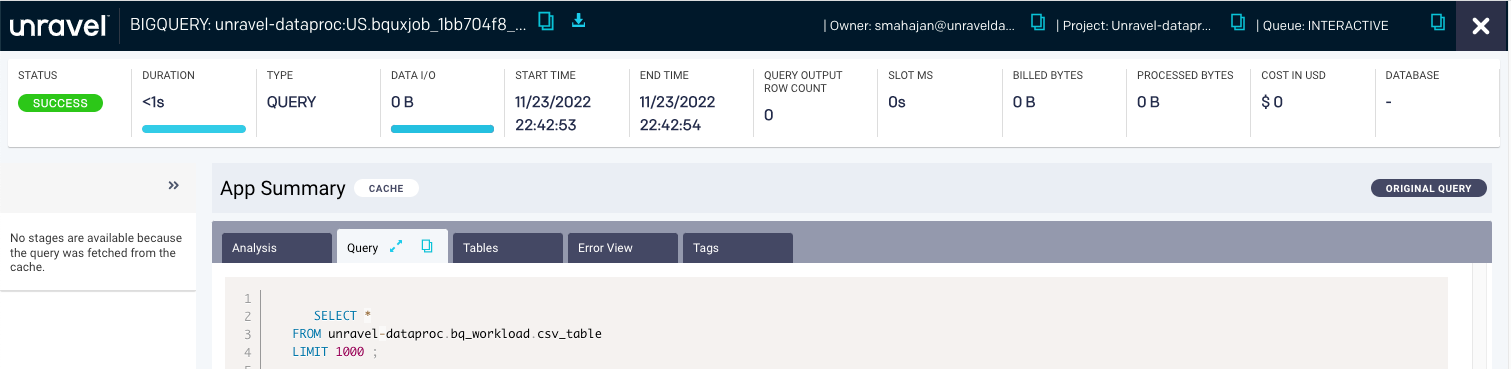
CACHE: Indicates that the query is retrieved from the BigQuery cache. Therefore, the KPIs are not displayed.
ORIGINAL QUERY: Enables you to return to the original query. The original query is the first run (in the last 24 hours) for the selected cache query. You can view the KPIs for the original query.
When you run two queries at a time in your BigQuery job, BigQuery executes two separate queries; however, three queries are processed in Unravel. On the BigQuery details page, you can view the parent, child, and cache queries. A similar method is used when the queries are executed through the stored procedure.
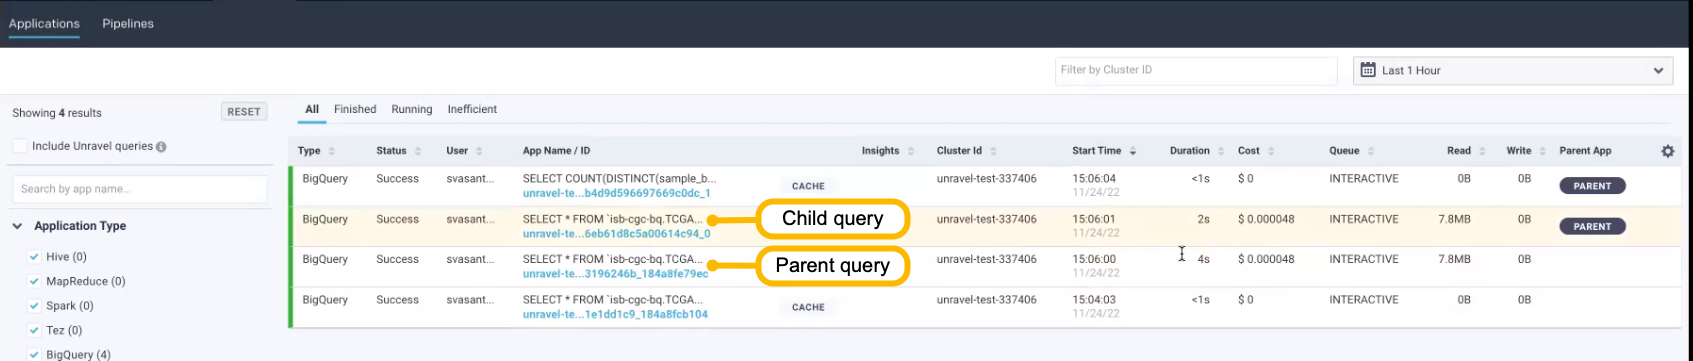
For parent queries, the Child Jobs tab is displayed. Click the child job ID link to view the child query.
For child queries, the PARENT label is displayed on the BigQuery details page and in the AppSummary section. You can click the PARENT label to return to the parent query.
Note
In some cases, the child query can be a cache query. In such cases, the child query can have the CACHE and ORIGINAL QUERY labels.
Stages
A query is executed in a series of stages. The details of each stage are shown on the BigQuery details page.
Multiple stages are executed parallel to increase time and efficiency when a query runs. For example, INPUT, SORT, and JOIN. For example, a JOIN stage that generates far more output rows than input rows can indicate an opportunity to filter earlier in the query. These stages improve data distribution throughout query workers.
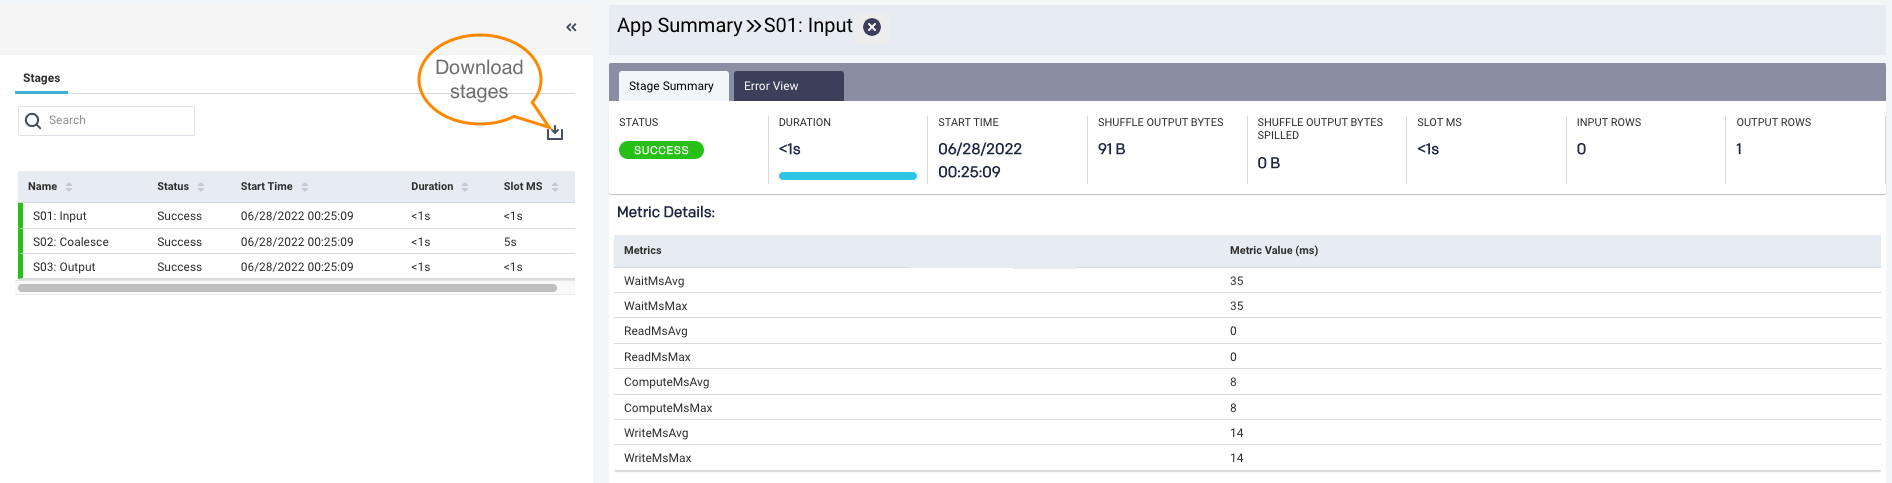
To view the details of all the stages, click the  expander arrows on the left panel of the BigQuery details page. In the Stages section, you can perform the following actions:
View timeline details along with the name and status of the stage. The timeline details include Start Time, Duration, and Slot MS.
Search for a specific stage.
Download stages into a CSV file.
After you click each stage, the selected stage summary is displayed in the right section.
Click the Close icon to return to the App Summary page.
Stage Summary: Lists KPIs of each stage, such as Status, Duration, Start Time, Shuffle Output Bytes, Shuffle Output Bytes Spilled, Slot MS, Input Rows, and Output Rows. You can also view metric details of a specific stage.
Error View: Lists errors of each failed stage.
Metrics: Lists all the metrics involved in running the job, their values, and corresponding definitions.
For information about query stages and their metrics, see Google BigQuery documentation.