Interesting Impala Queries report
Interesting Impala Queries report presents a summary of Impala queries that were breached based on the specified threshold values.
Click Generate Reports > New button.
In the New Report dialog box, enter the following details.
Items
Description
General
Name
Name of the report.
Environment
Select your platform. The reports corresponding to the selected platform are only listed in the Report type. If you select the All option, all the reports are listed.
Report type
Type of report. Select Interesting Impala Queries reports.
Schedule
Select the checkbox to schedule the report. From the EXAMPLE dropdown, you can select an option (daily, hourly, 12 hourly weekly, or monthly) to schedule the report run.
Retention
The number of days to retain the report files. All the reports are stored in the
unity-one/src/assets/reports/jobsdirectory. After completion of the retention period, the report files are automatically purged.Parameters
Look Back
The period ranges in days when applications can be selected for report generation. A notification is displayed above this option that informs about the duration when data is available for the report.
Users
Select the users who must be included in the report. You can select multiple users.
Pools
Select the queues that you want to be included in the report. You can select multiple queues. If none are selected, all queues detected will be included in the report.
Thresholds
Click Thresholds and specify any of the following details:
Memory Spilled in bytes
Specify the value in bytes for the Memory Spilled threshold.
Rows Produced
Specify the value for the Rows Produced threshold.
Query Duration in seconds
Specify the value in seconds for the Query Duration threshold.
Estimated Per Node Peak Memory in bytes
Specify the value for the Estimated Per Node Peak Memory threshold.
Per Node Peak Memory
Specify the value for the Peak Node Peak Memory threshold.
Aggregate Peak Memory in bytes
Specify the value for the Aggregate Peak Memory threshold.
Admission Wait Time in seconds
Specify the value in seconds for the Admission Wait Time threshold.
HDFS Remote Bytes Read in bytes
Specify the value in bytes for the HDFS Remote Bytes threshold.
Statistics corrupt or missing
Select a boolean option. True or False.
Notifications
Email to
Email ID to send the notification when the report is generated. You can select the Attach Files to Email checkbox to receive the reports as an attachment.
Advance Options
Profile Memory
Select this option if you want to generate logs that help to troubleshoot scenarios where the report takes excessive time to generate or fails to generate.
Caution
The option will increase the report run time excessively.
Click OK. The generated reports will be listed under Reports on the App UI.
Select the generated report and then click Run. After the report is successfully run, the details of the report runs are listed in the Run box on the right.
Click the following:
HTML files link to view the report details.
Input parameters link to view the parameters you chose to run the report.
Log file link to view the logs of the report.
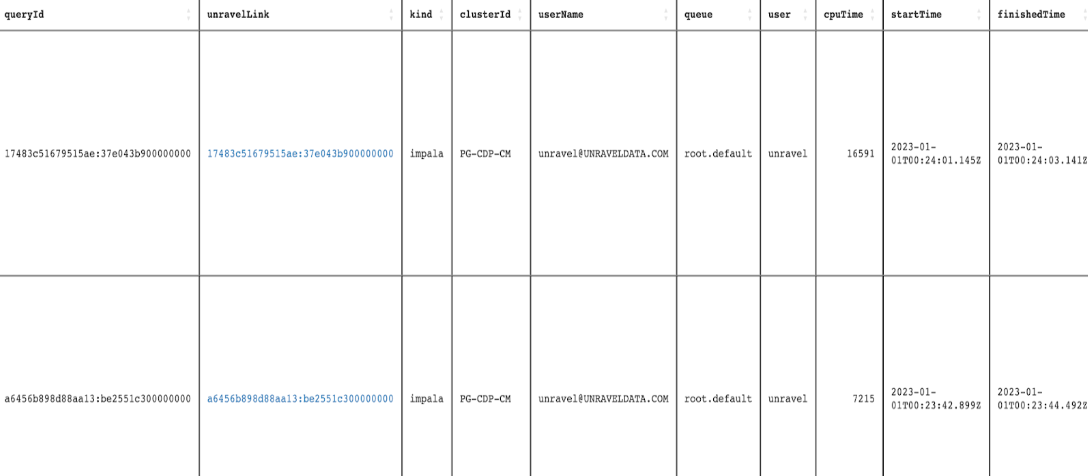
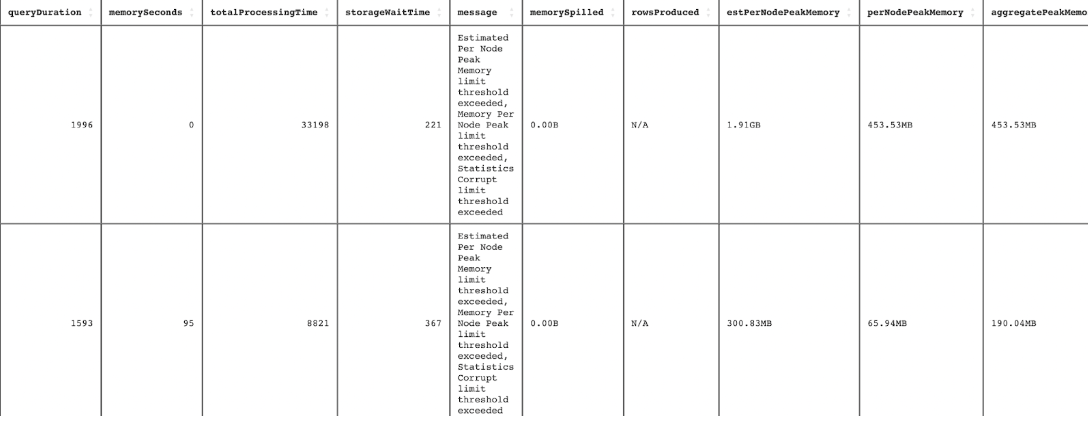
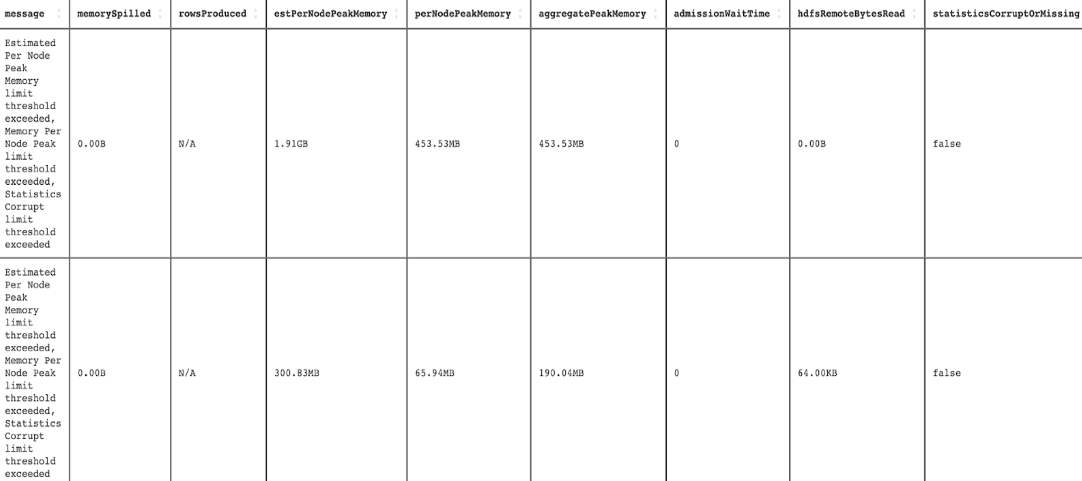
The following report is generated, which presents the queries that were breached based on the specified thresholds: