Job Trends
The Clusters > Job Trends tab plots the trends of all the jobs running in a cluster for a specific period.
The Clusters > Job Trends tab has the following two sections:
Graphs: Plots the trend of the job count over a specified period.
Tables: Displays the list of the running applications with the following details displayed for the specified period.
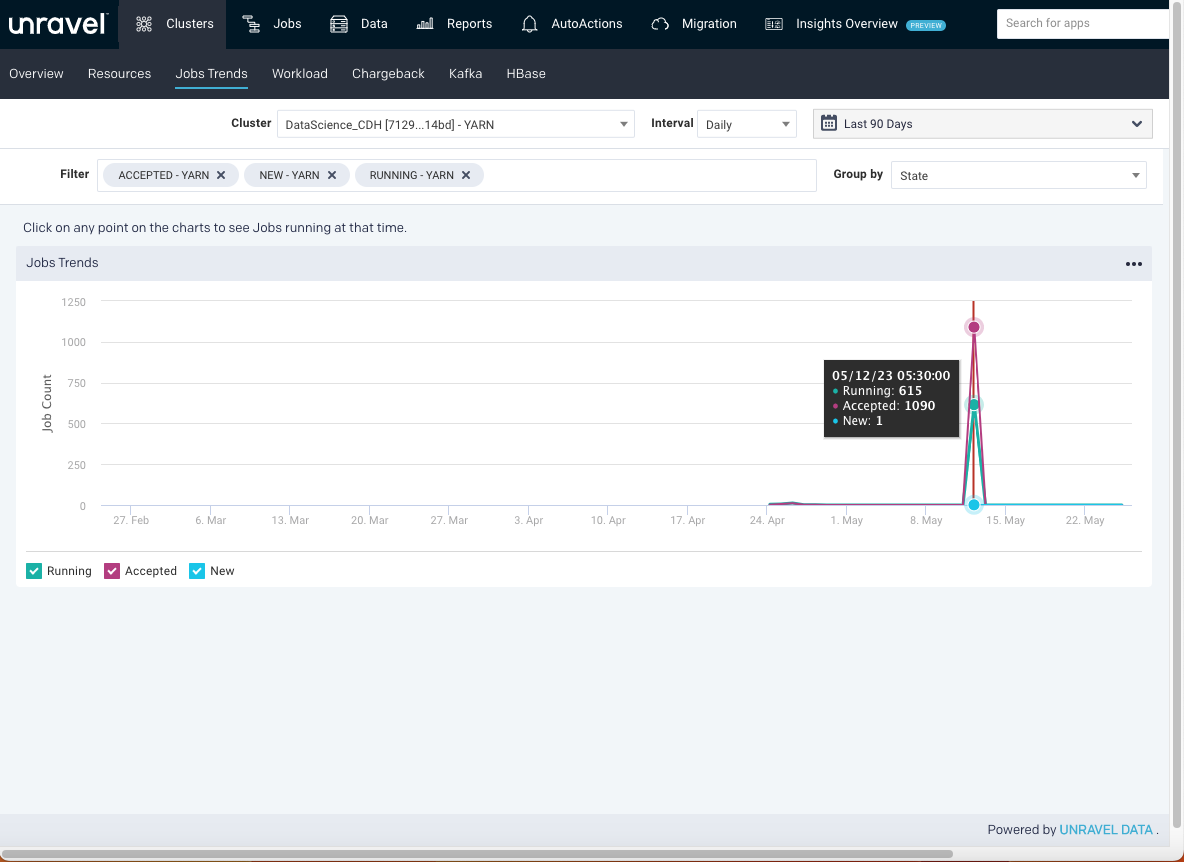
Viewing Job Trends
To view the resources usage, do the following:
Go to the Clusters > Jobs tab.
From the Cluster drop-down list, select a cluster.
Select the period range from the date picker drop-down. You can also provide a custom period range. The graphs corresponding to the selected filters are displayed.
From the Interval drop-down list. Based on the selected period range, the interval options are changed.
From the Group By drop-down, select an option. You can group job trends using any one of the following options:
State
Application type
User
Queue
You can filter the Group By options further from the Filter options box. Click
 next to an option to deselect it.
For example, if you select Application Type as a Group By option, all the application types are listed in the Filter options box. You can then drill down to a specific application type, such as Spark.
Click
 in the upper-right of a graph to export the graph data to PDF, PNG, JPEG, SVG, CSV, or XLS formats.
 Click any point in the graph.
The following details of the resources used for the running jobs are displayed in a table:
Items
Description
Type
The type of application where the job is running.
State
Status of the job.
User
Name of the user running the job.
App Name/ID
Name or ID of the application where the job is running.
Start Time
The time when the job was started.
Duration
The period until the job has been running.
Note
The duration shown in the Clusters > Job trends page may vary from the App details page. This is because the duration in Clusters > Job trends page is calculated as follows:
Selected data point (interval) - Start time
The selected data point is within a time interval. Therefore the time of the selected data point can be from a range within the interval.
Queue
Queue
Progress
Percentage of the progress of the running job.
Memory MB
Memory in MB that is used by the job.
VCores
Number of VCores used by the job.
Running Containers
Number of running containers.
Cluster
Cluster name and ID along with the resource type (Yarn/Impala)
Click the
 button in the upper-right of a table to export the table data as a CSV file.
 Click
 in the table to select the columns that must display.
Click
 to select the number of items to be displayed per page.