Pipelines
This tab lists all the tagged workflows, also called pipelines, in the workspace.
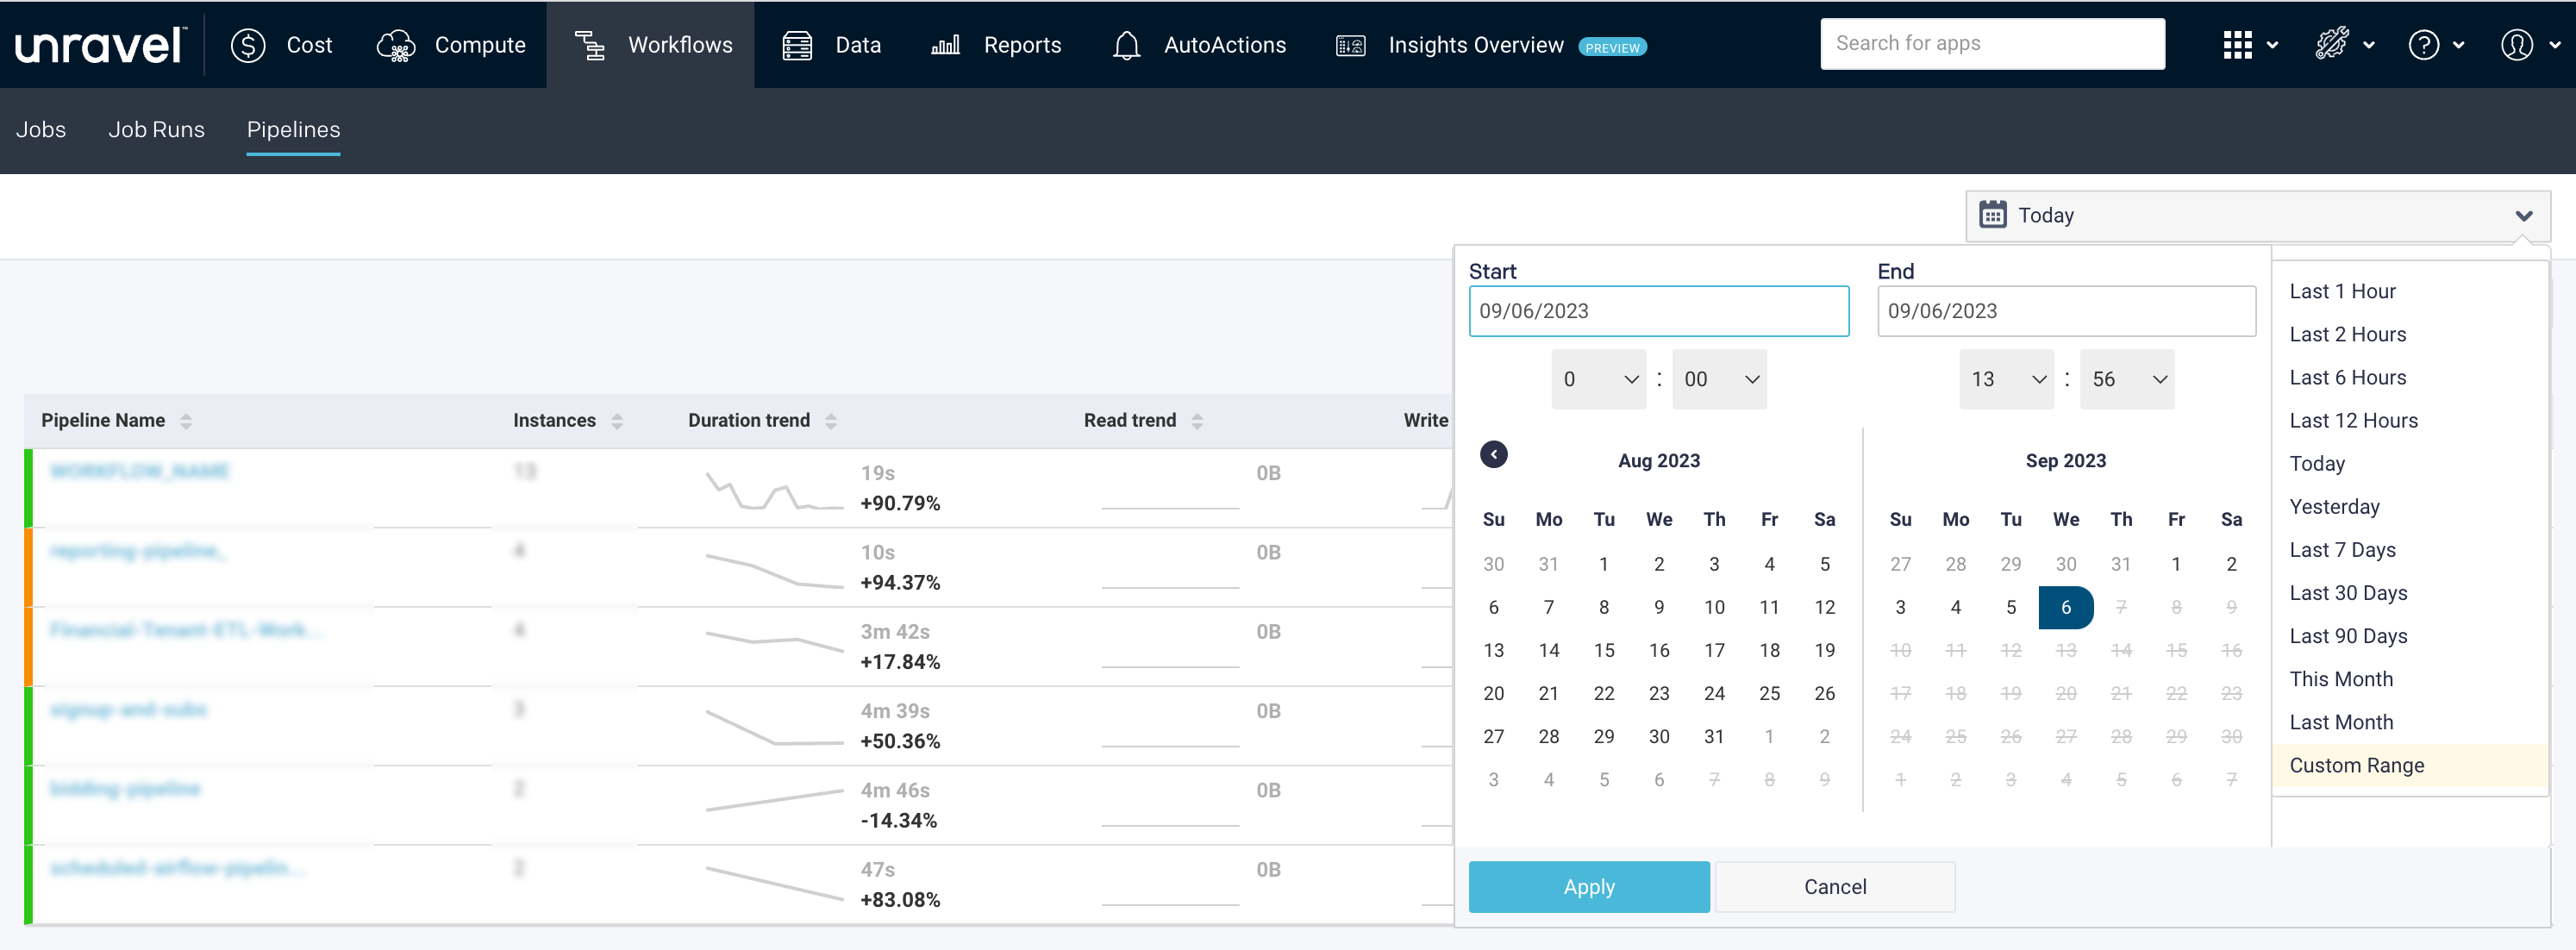
To filter and view the pipelines, specify any of the following, and the matching pipelines are displayed.
Click in the Search by job name or user text box and specify a pipeline name or user name.
From the date picker, select a time range.
The pipeline status is noted by a colored bar on the left-hand side of the row.
Color code | Description |
|---|---|
| Running applications. |
| Successful applications. |
| Failed applications. |
| Unknown applications. NoteTagged pipelines are always displayed with Unknown status. |


The table columns in the pipeline list are:
Columns | Description |
|---|---|
Pipeline Name | Name of the pipeline |
User | Pipeline owner |
Start Time | The start time of the nth instance. The time displayed is rounded to the nearest second. |
Instances | The number of times the pipeline has run. |
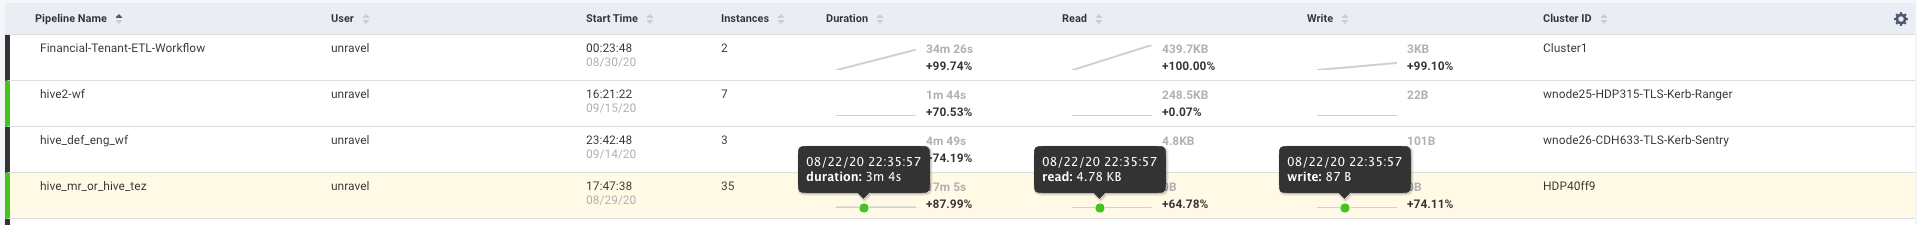
Duration | Length of time for the pipeline to complete execution. This shows a trend line mapping from the first to the last instance. You can hover over the trend line to view the instance's date, time, and duration. Adjacent to the trendline is the percent of duration change between the last two runs (if there was any delta), and the absolute value of the last run. |
Write trend | Total amount of memory written by the pipeline. This shows a trend line mapping from the first to the last instance. You can hover over the trend line to view the instance's date, time, and write bytes. Adjacent to the trendline is the percent of write changes between the last two runs (if there was any delta), and the absolute value of the last run. |
Read trend | Total amount of memory read by the pipeline. This shows a trend line mapping from the first to the last instance. You can hover over the trend line to view the date, time, duration, and read bytes of the instance. Adjacent to the trendline is the percent of read change between the last two runs (if there was any delta), and the absolute value of the last run. |
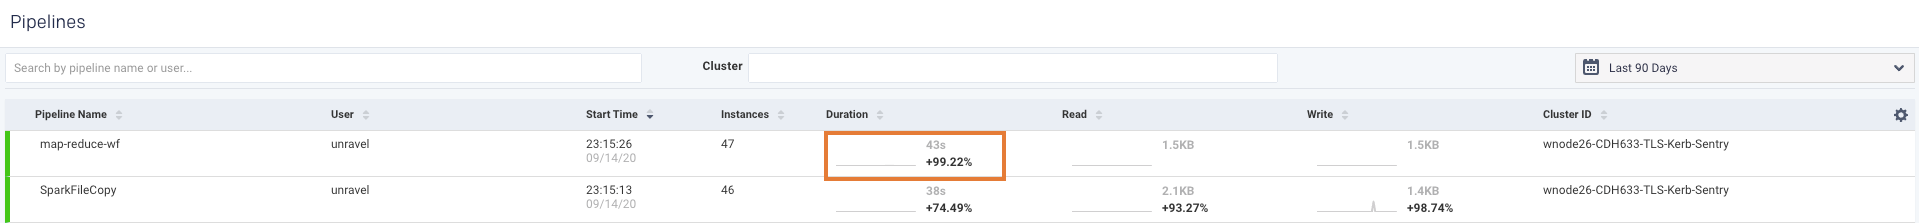
Example of Duration
In the following example, there are two pipelines. The first job shows a difference of +99.22% increase in time with the absolute duration of 43s.
Example of Read and Write trend
Hover over the trendline to view more details.
Pipeline details page
The Pipeline details page provides a summary of the instances that are run for a specific pipeline.
Click a pipeline row to bring up the corresponding pipeline details page.
The following details are noted on the upper right corner of the page:
Pipeline owner
Cluster ID
Queue
The following details are provided in the upper left side of the pipeline details page:
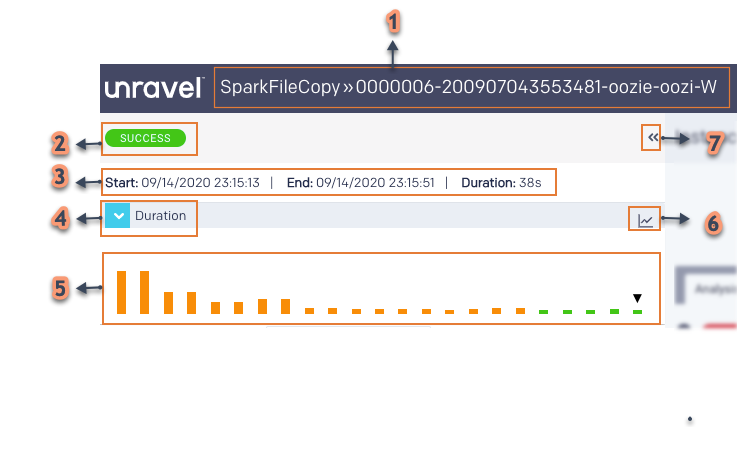
Item | Description |
|---|---|
1 | Shows the name of the pipeline. |
2 | Shows the status of the application in the pipeline. |
3 | Start time of the application run. End time of the application run. Duration of the application run. |
4 | A drop-down to select any of the following metrics to update the graph:
|
5 | Graph that plot the metrics that you have selected. Click a point in the graph to view more details. |
6 | Click to toggle between bar graph and line graph. |
7 | Click to expand the Instance Summary view. |
The details page initially opens displaying the insights for the last instance within the Analysis tab. In case there are no insights, the Resources page is not displayed.
Navigation
The Navigation tab lists the pipelines in a cluster with the following details;
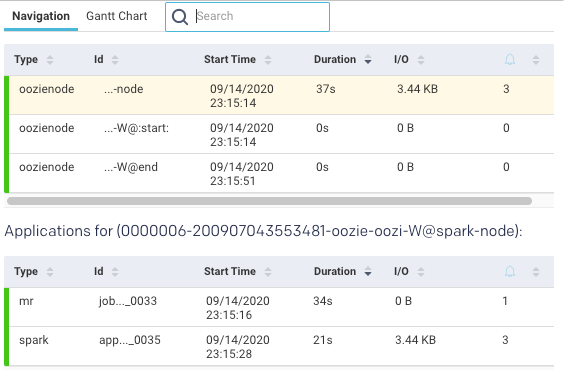
Type: Type of the pipeline.
ID: Name of the pipeline.
Start Time: Time when the pipeline started.
Duration: Time when the pipeline ended.
I/O: Input/Output data processed.
 : The number of insights/recommendations for a specific pipeline.
Click a row within the pipeline list. The corresponding applications within a pipeline are displayed. When you click a row within the applications list the corresponding app details page is shown.
Gantt Chart
The Gantt tab visually displays the progress of all the pipelines in the cluster along with their corresponding status in the color-coded bar against a timescale.
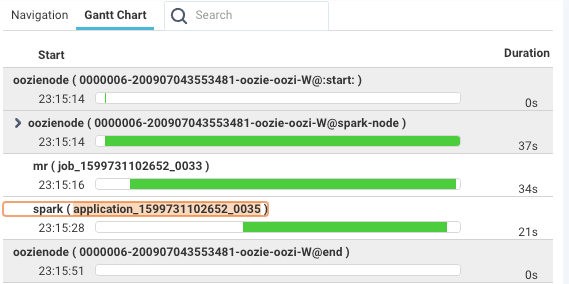
You can expand each pipeline to view applications in a pipeline and the progress of their corresponding jobs. Further, if you click an application, you can view the details of the app in the app details page.
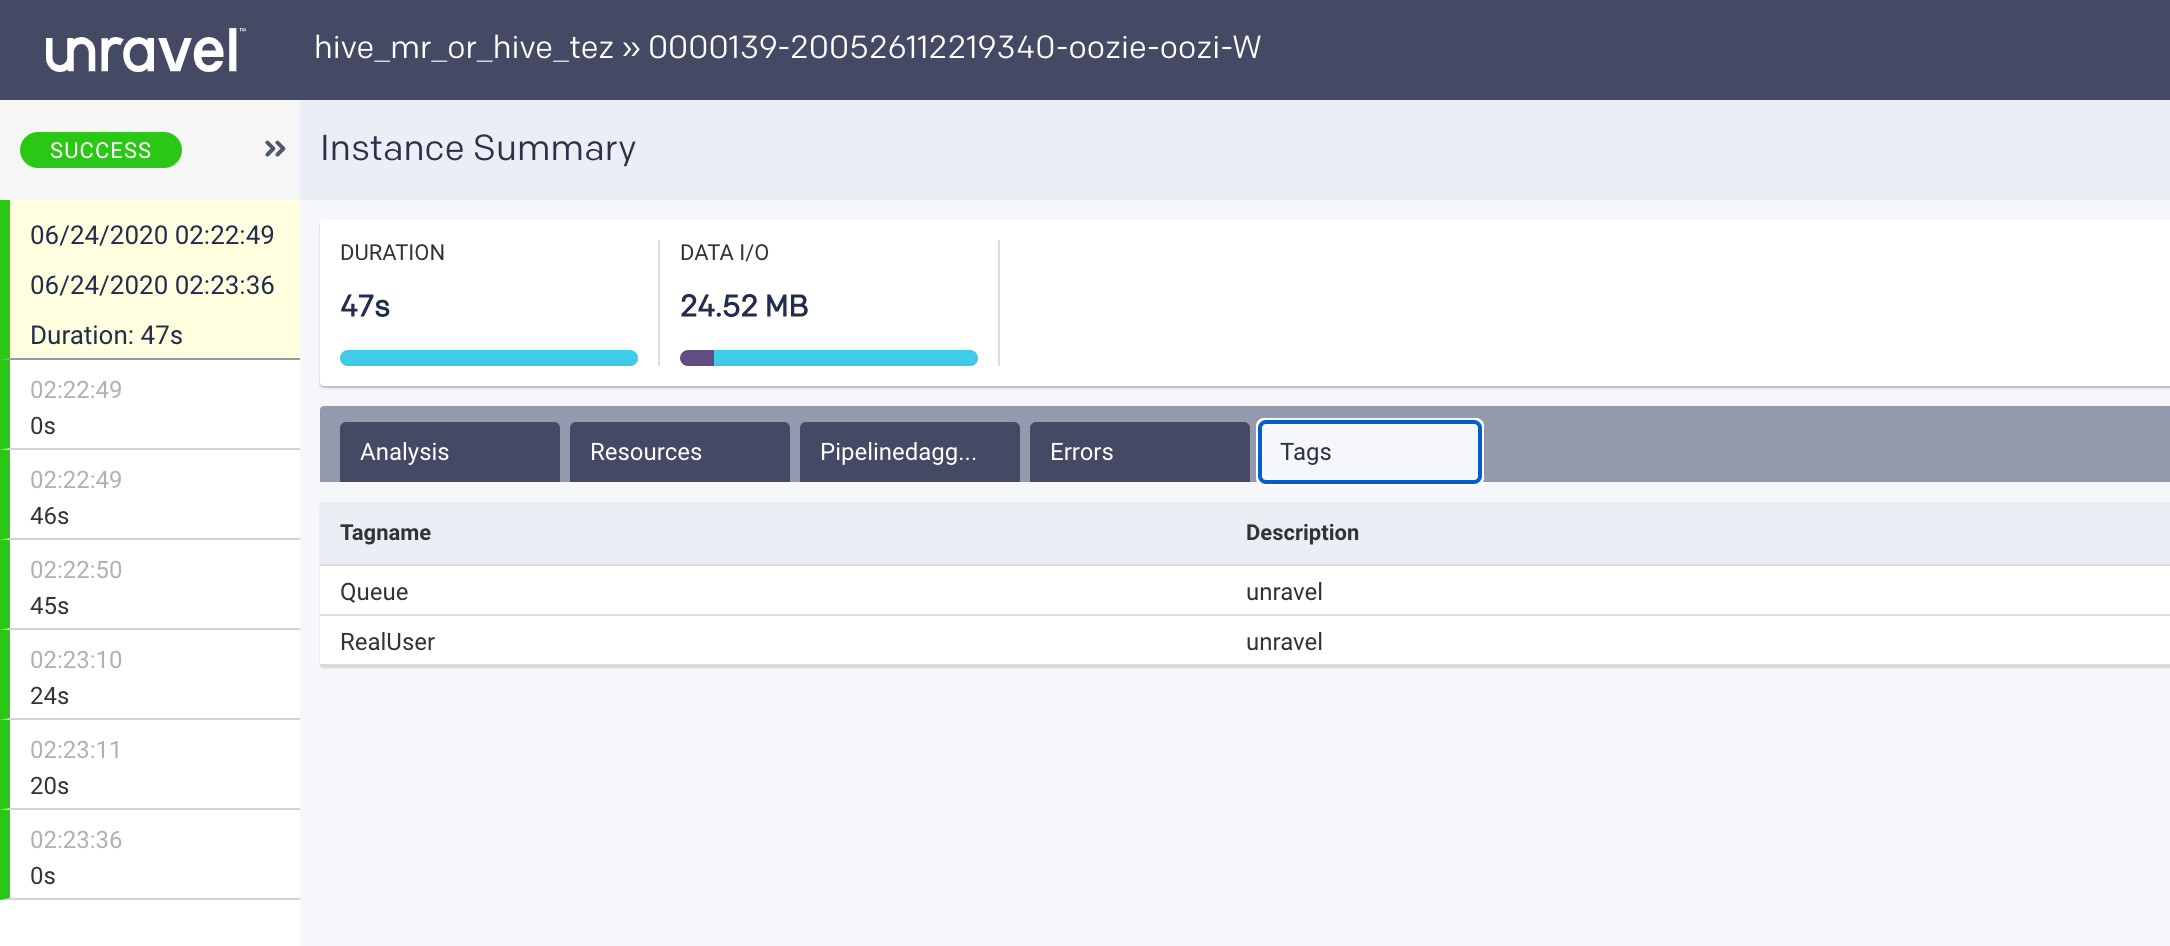
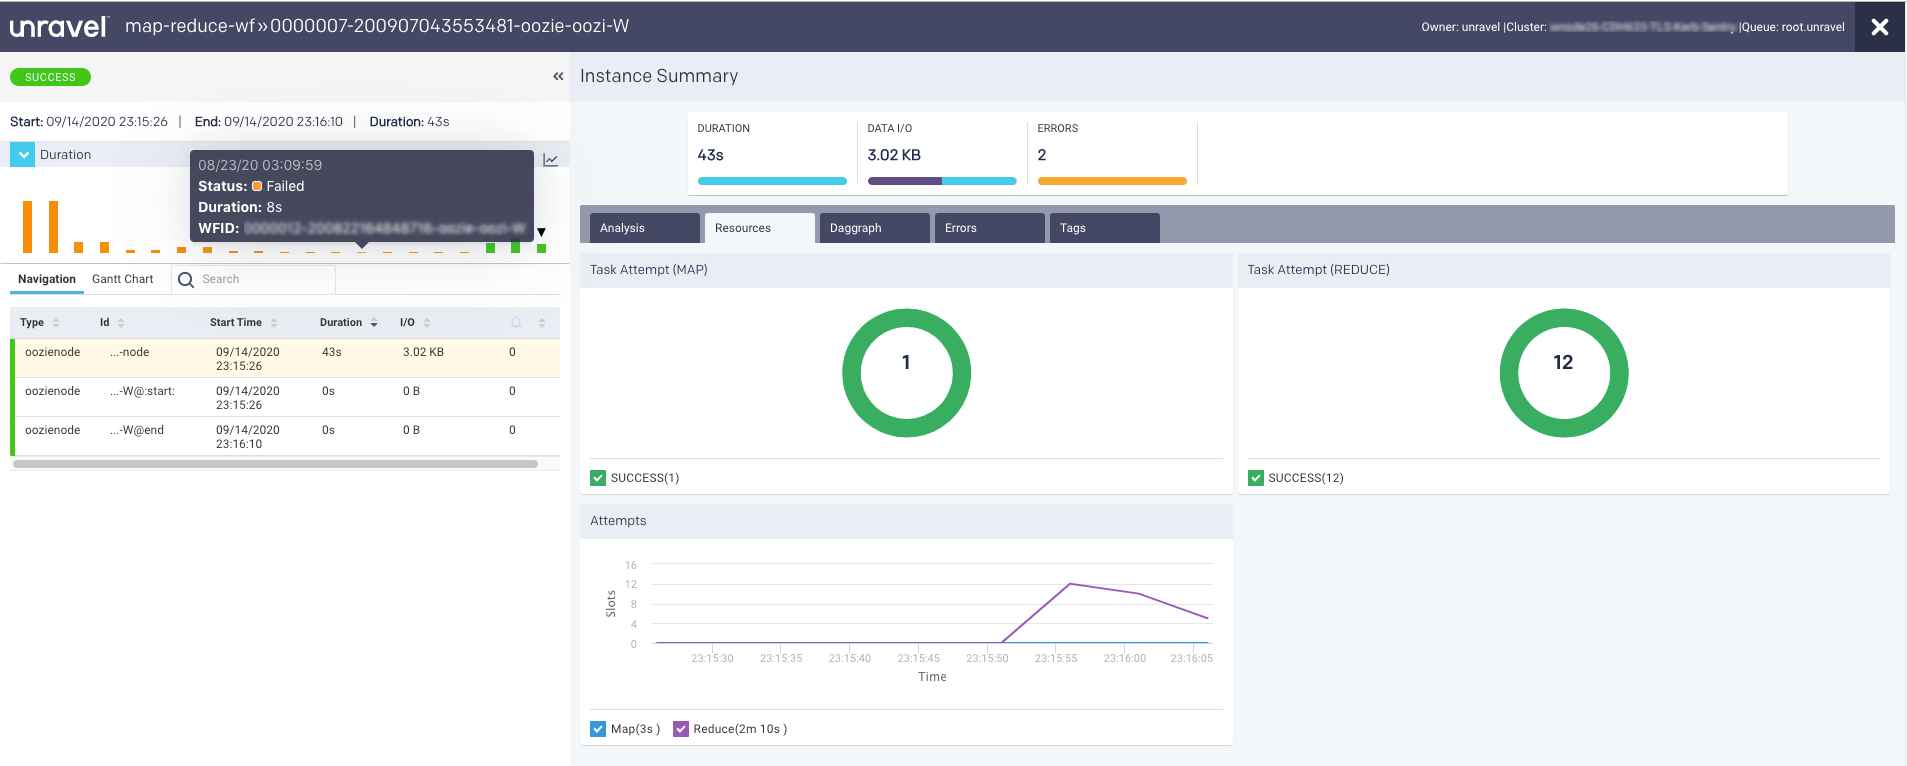
Instance Summary
The Instance Summary page provides the details of a pipeline instance from the following tabs:
From this tab, you can view the cluster insights. Unravel's analysis results show where the efficiencies of your app can be improved at the cluster level.
The number of efficiencies found is noted in the tab. When Efficiency leads to a suggested change, those suggestions are listed as Recommendations.
Efficiency: Suggest areas to examine to improve efficiency. For example, inefficient usage of resources. Expand the Efficiency of reading the in-depth analysis. While some are only configuration property suggestions, others point to areas for examination. For example, inefficient storage, problems with a query, and so on.
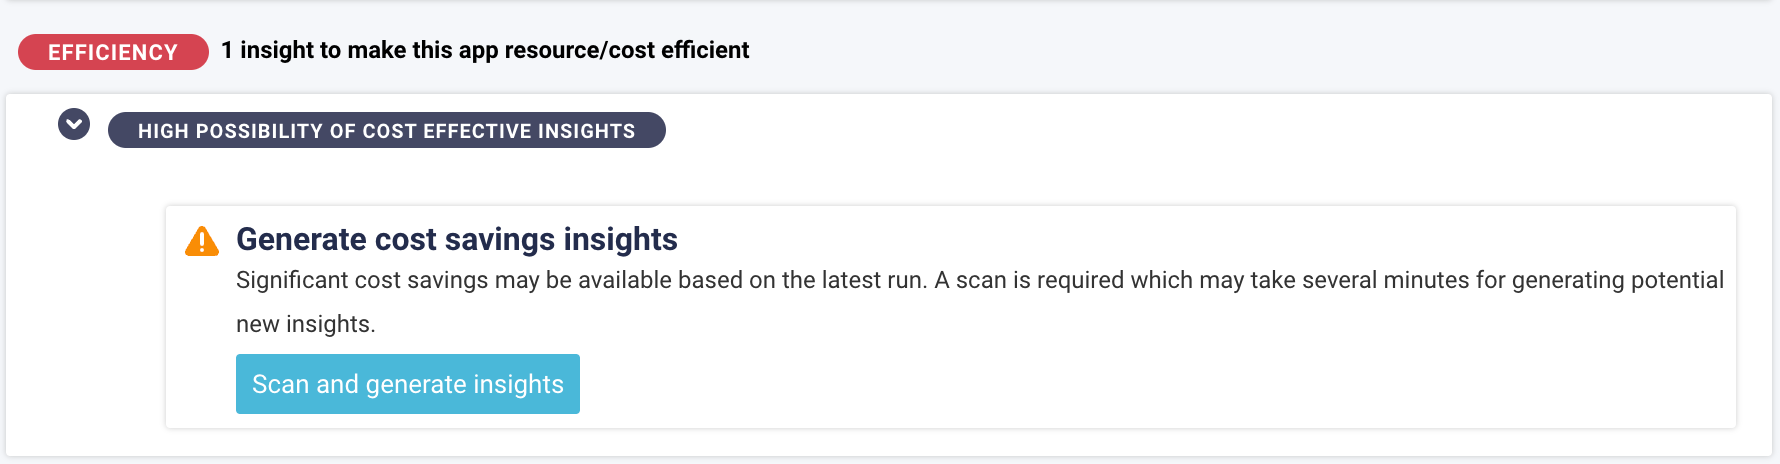
You also get prompts to scan and generate insights when a high possibility of cost savings may be available.
Note
The cost savings insights are not available for Databricks version 13.0 and later.
To scan and generate insights:
Click Generate and Scan Insights in the Analysis tab of the Compute > App Summary page to start the analysis. Wait till the insights are generated.
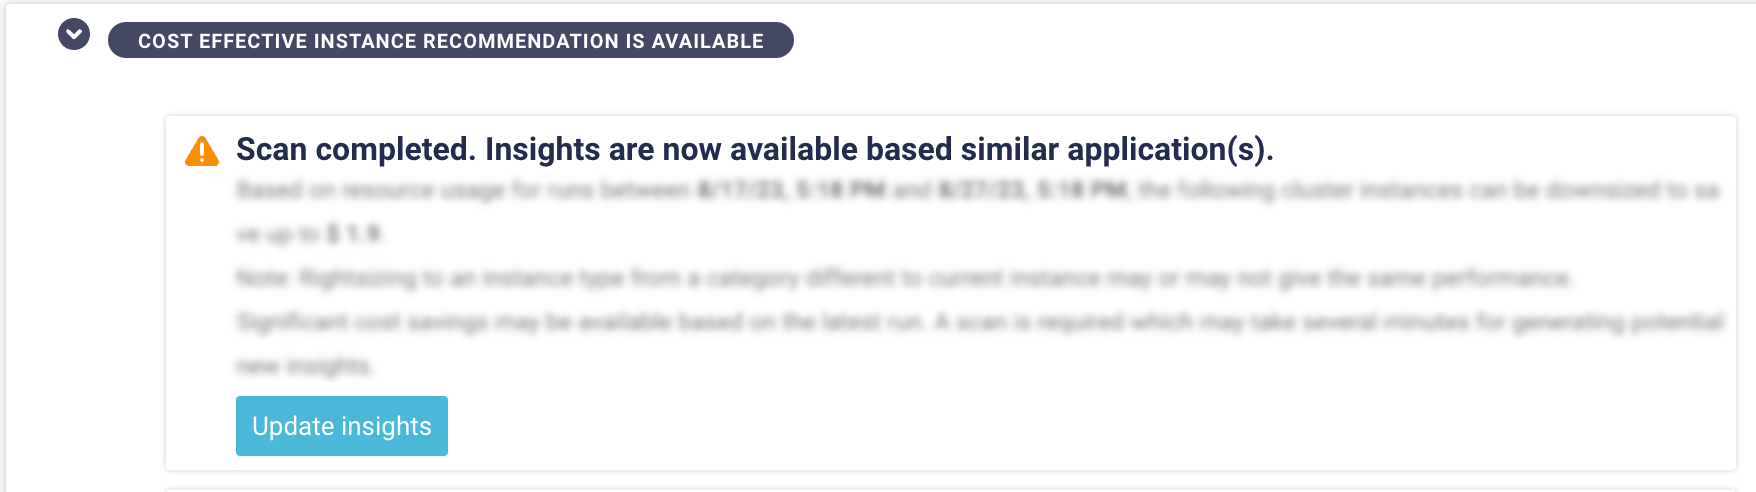
Note
Insight generation may take several minutes. The Update Insights button will remain disabled until insights are generated. Refresh the page to confirm completion of insights generation.
Utilize these insights to achieve cost-effective resource allocation. You can click Update Insights to generate updated insights at any time.
Recommendations: Suggestions to update a property or configuration parameter. Click to view the current and recommended value.
Bottlenecks: Suggestions to make your apps run faster.
Resources
The resources contain the following charts:
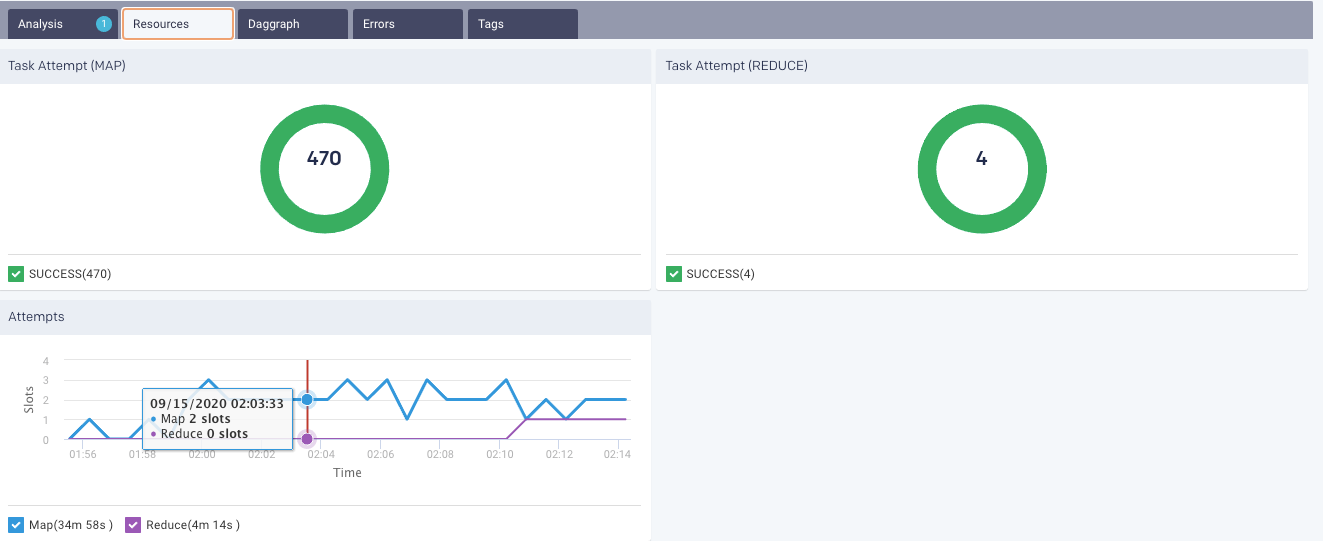
Task Attempt (Map): Graphs the successful and failed Map attempts.
Task Attempt (Reduce): Graphs the successful and failed Reduce attempts.
Attempt: Graphs Slot over Time for Map and Reduce tasks.
Pipeline Dag Graph
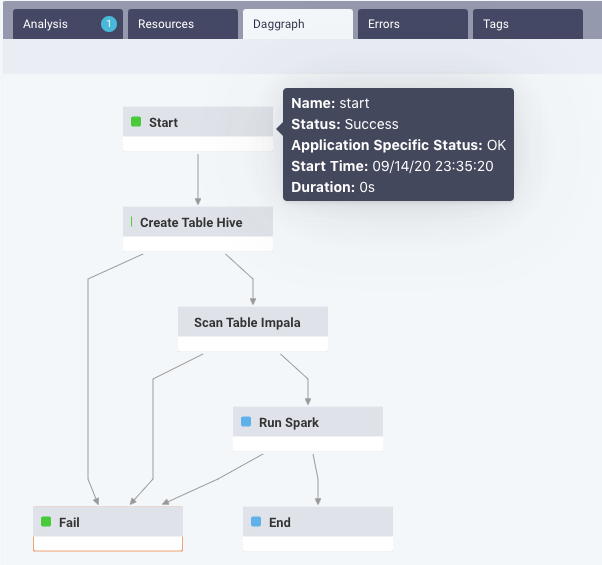
This tab presents the Dag graph of the pipeline. You can click on the stages to view the details and status of each stage.
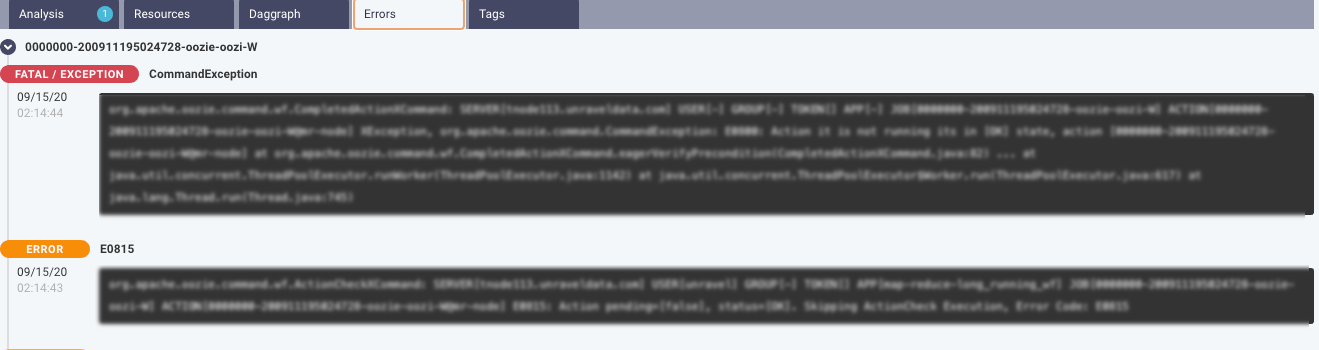
Errors
This tab lists the errors that were encountered during the instance run.
Tags
This tab lists the tags used in the pipeline instances. Refer to Tagging.