HDFS and Small file report
A report to track file system trends and small file occurrences for tenants, projects, databases, and tables. This report is useful if you want to keep track of how much quota has been allocated and used by your tenants and also you can also track small file trends for each tenant or table level.
Important
To run this report, you must schedule an FSImage processor script. This script should be running at least 7 days prior.
Prerequisites
Fsimage File Path: A valid path to the Fsimage file is required for report generation.
Unravel Forecasting Page: The Unravel forecasting page should be accessible and operational. If not configured, certain graphs related to HDFS utilization may be missing in the generated report.
Configuration
To configure the HDFS report generation, follow these steps:
Update the cluster name and Fsimage file path in the attributes.yaml file.
Location: unityone/src/reports/attributes.yaml
Click Generate Reports > New button.
In the New Report dialog box, enter the following details.
Items
Description
General
Name
Name of the report.
Environment
Select your platform. The reports corresponding to the selected platform are only listed in the Report type. If you select the All option, all the reports are listed.
Report type
Type of report. Select HDFS Usage Analysis reports.
Schedule
Select the checkbox to schedule the report. From the EXAMPLE dropdown, you can select an option (daily, hourly, 12 hourly, weekly, or monthly) to schedule the report run.
Retention
The number of days to retain the report files. All the reports are stored in the
unity-one/src/assets/reports/jobsdirectory. After completion of the retention period, the report files are automatically purged.Parameters
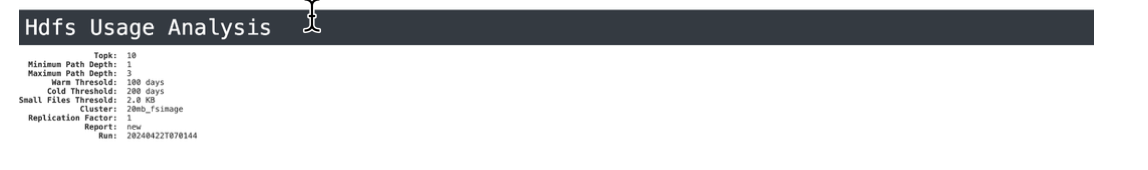
Top K
Specify the top k (e.g., top 10 or top 20) users and paths for analysis.
Minimum Path Depth
Define the minimum path depth of the range for analysis.
Maximum Path Depth
Define the maximum path depth of the range for analysis.
Warm threshold in days
Set the threshold for files accessed within a specified number of days. Files accessed within this threshold are considered hot.
Cold threshold in days
Set the threshold for files accessed within a certain range of days. Files accessed within this range are considered warm, while those untouched beyond this threshold are considered cold.
Small files threshold in KB
Specify a size limit for small files, e.g., 10 KB. Files with sizes equal to or smaller than this threshold are considered small.
Replication Factor
Specify the number of file replications held by users (default is 1).
Cluster
Select the cluster name for analysis.
Download CSV
Choose whether to download the report in CSV format, including the complete list of users and paths within the specified range.
Notifications
Email to
Email ID to send the notification when the report is generated. You can specify multiple email IDs with comma separation. You can also select the Attach Files to Email checkbox to receive the reports as an attachment.
Small Files Count Threshold Alert
Set a threshold for small file counts. If exceeded, an email alert will be triggered.
Small Files Alert Mail
Specify the email address to receive the small files count threshold alert.
Advance Options
Profile Memory
Select this option if you want to generate logs that help to troubleshoot scenarios where the report takes excessive time to generate or fails to generate.
Caution
The option will increase the report run time excessively.
Click OK. The generated reports will be listed under Reports on the App UI.
Select the generated report and then click Run. After the report is successfully run, the details of the report runs are listed in the Run box on the right.
Click the following:
HTML files link to view the report details.
Input parameters link to view the parameters you chose to run the report.
Log file link to view the logs of the report.
The following reports are generated:
HDFS utilization report
This report contains the analysis of HDFS and small files. The following charts are included:
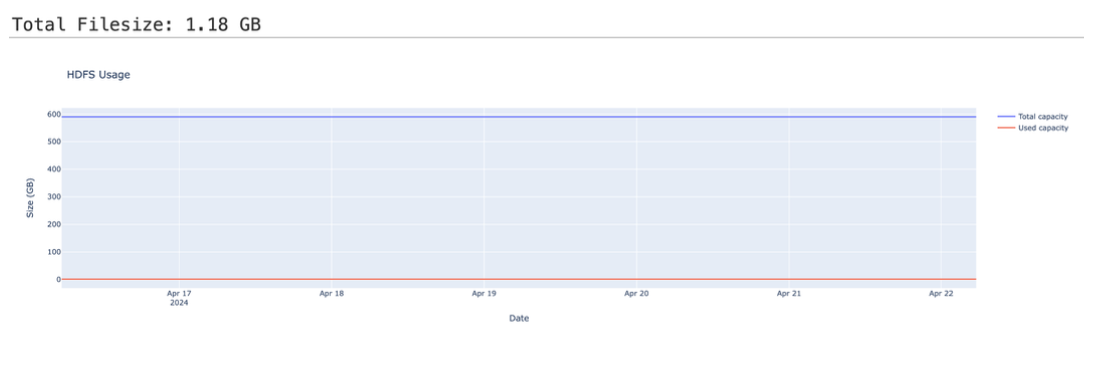
HDFS Usage Analysis
Total Filesize
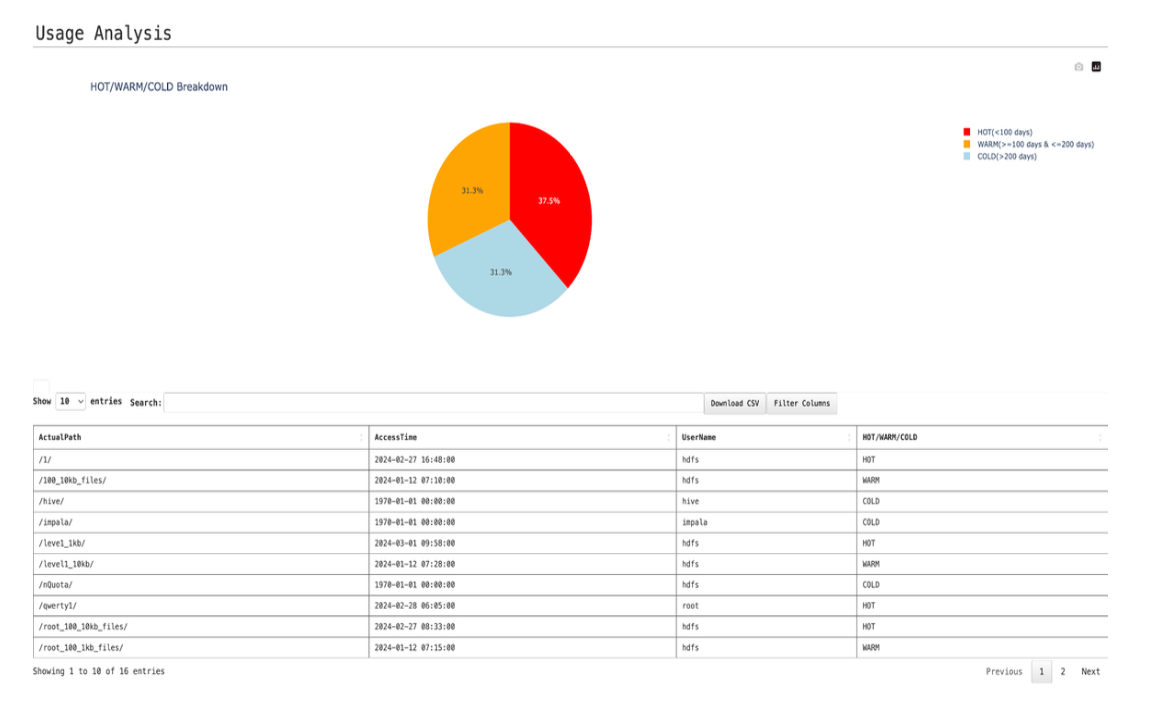
Usage Analysis
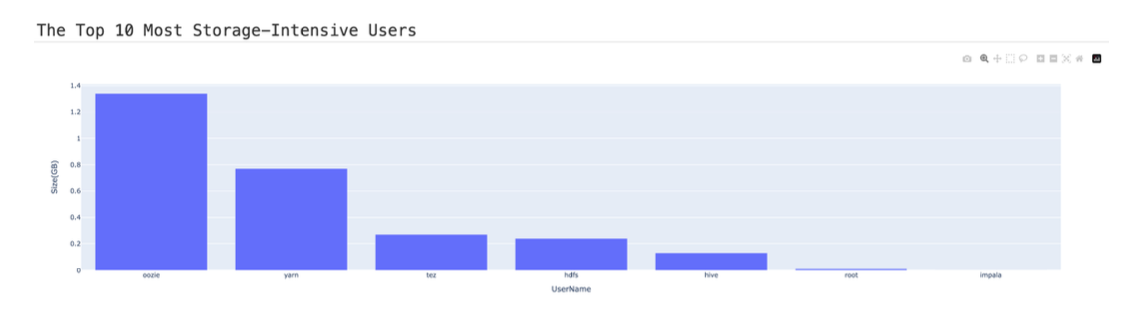
Top 10 Most Storage-Intensive Users
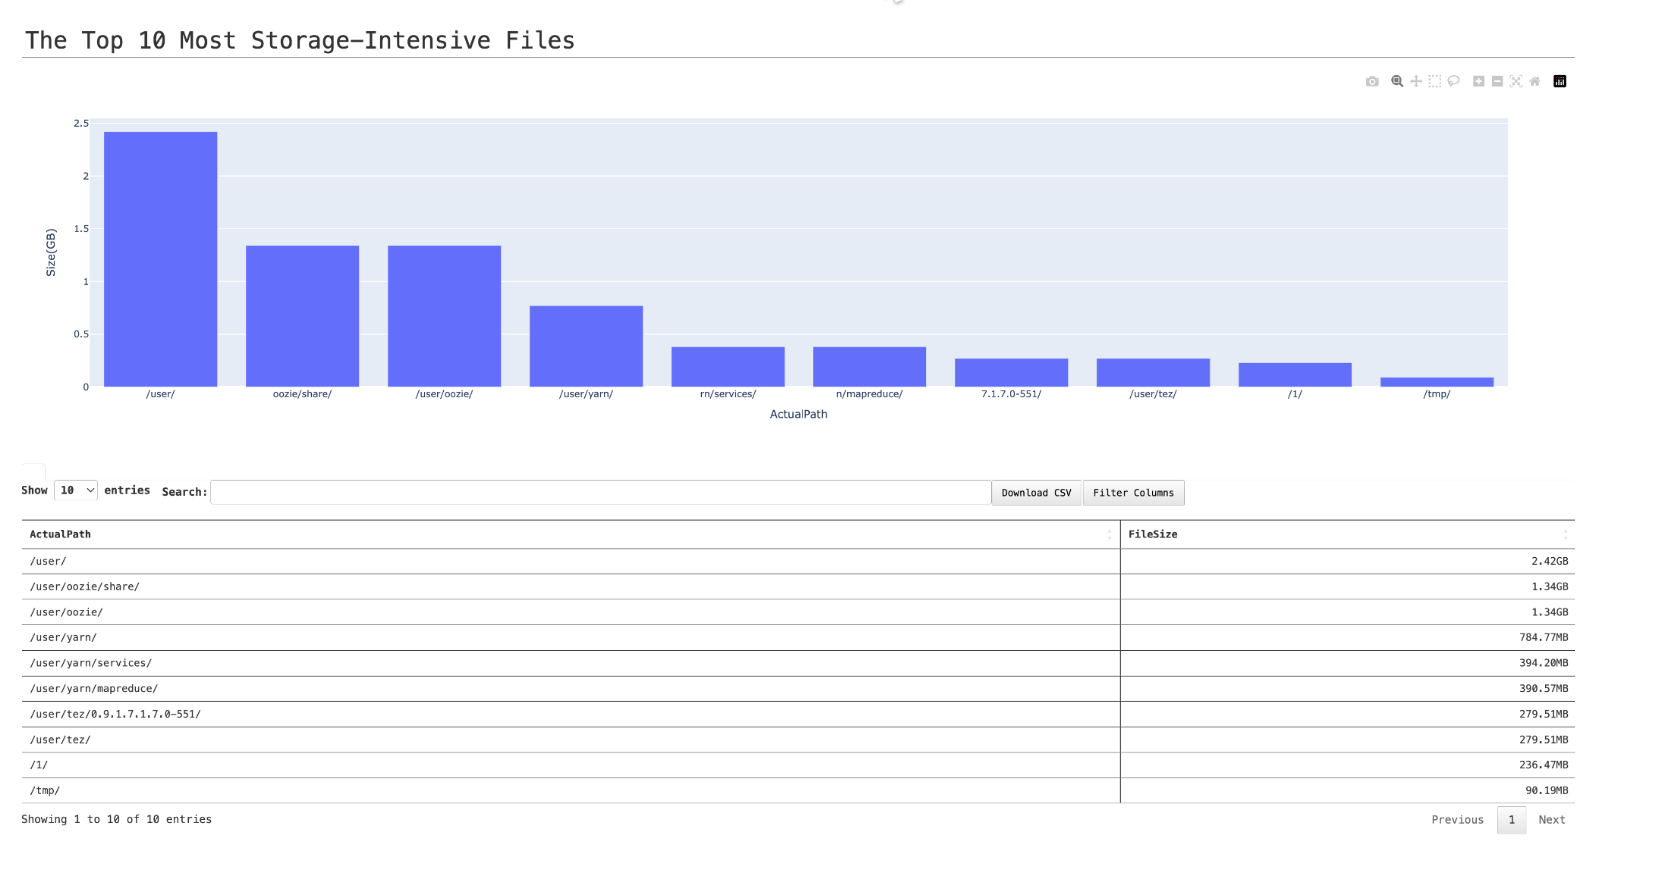
Top 10 Most Storage-Intensive Files
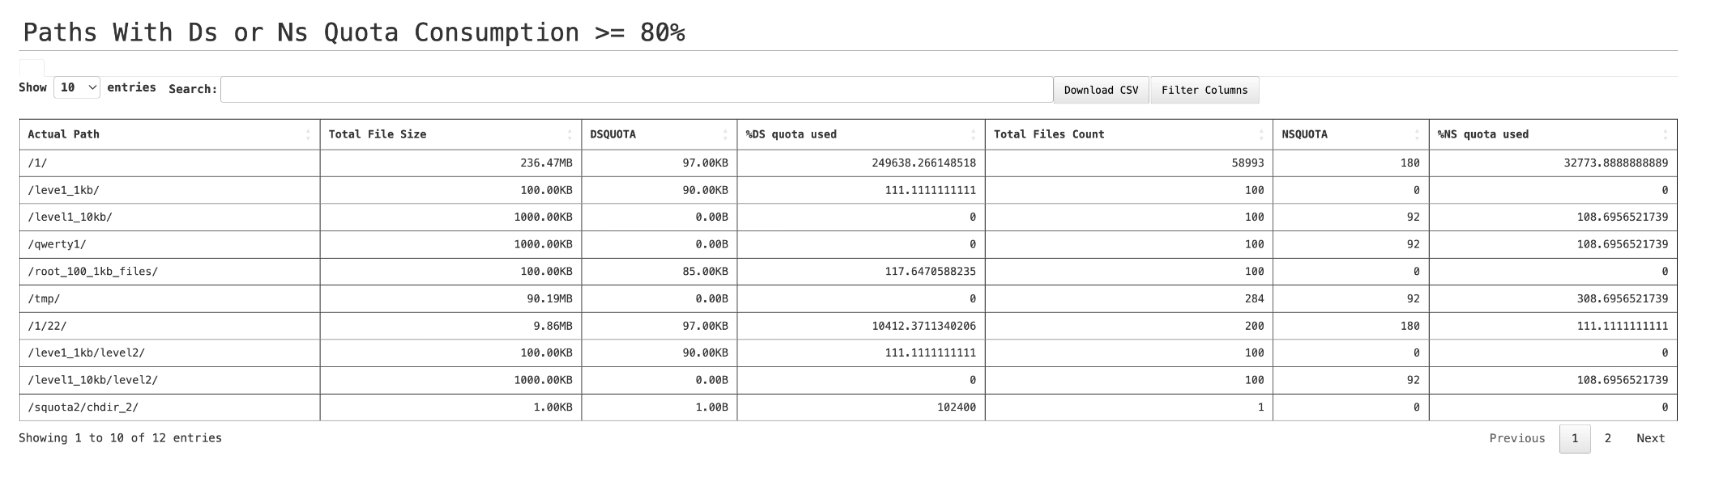
Paths with Ds or Ns Quota Consumption >=80%
Small files report
This report contains the analysis of small files. The following charts are included:
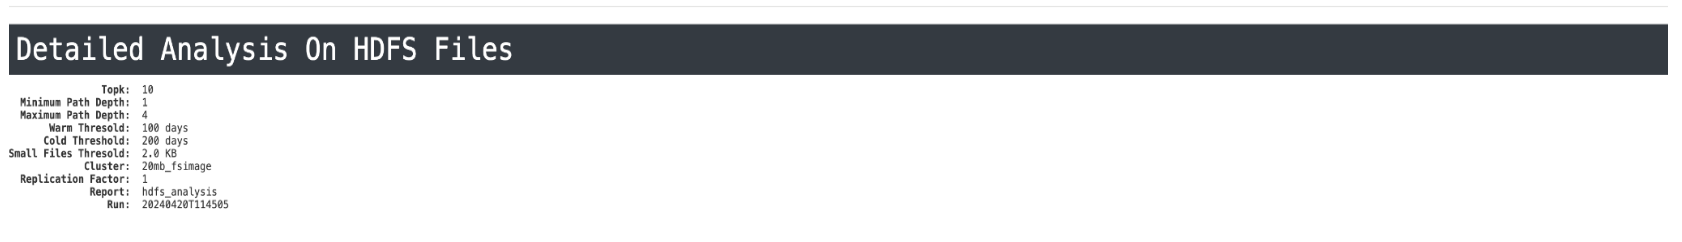
Detailed Analysis on HDFS Files
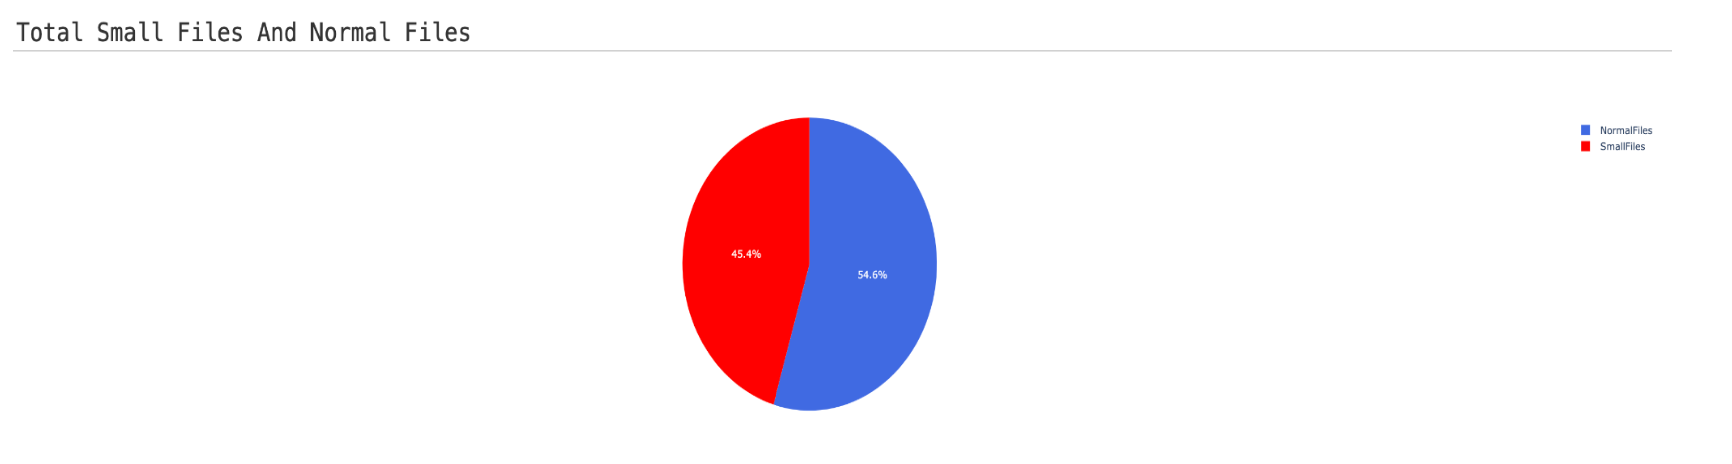
Total Small files and Normal files
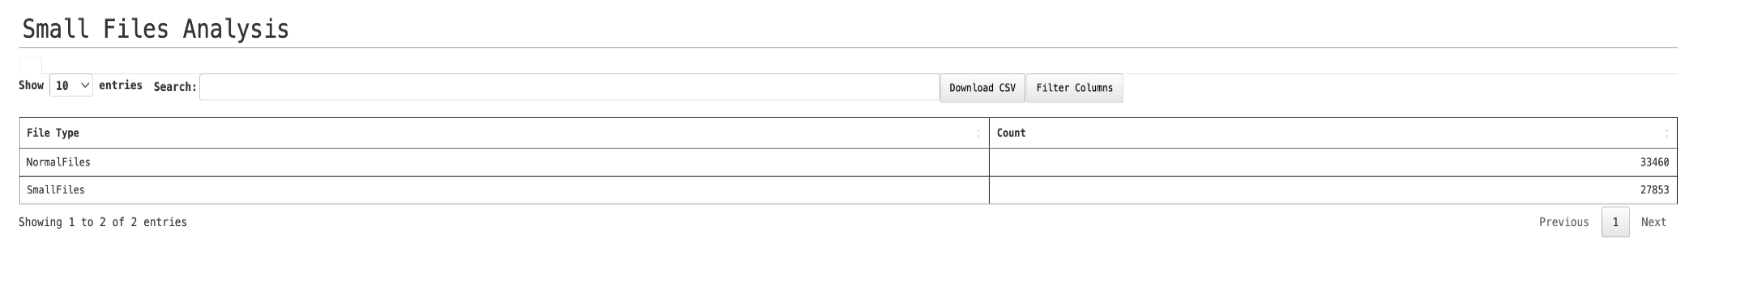
Small Files Analysis
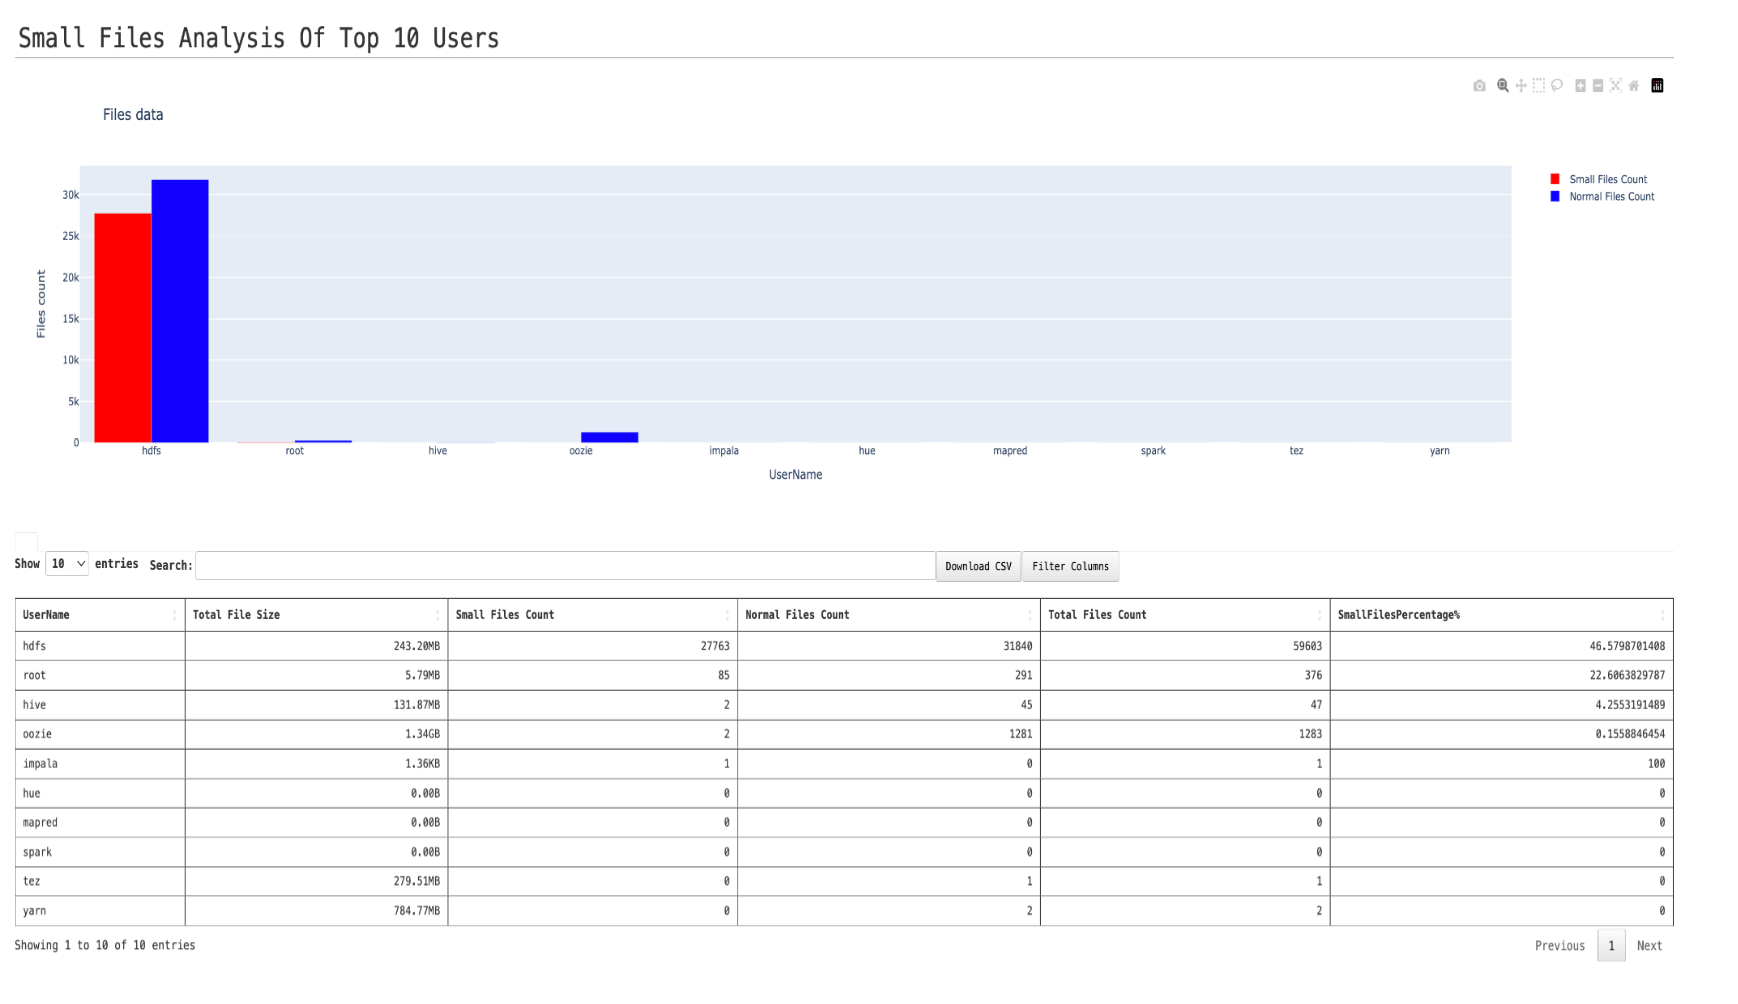
Small Files Analysis of Top 10 Users
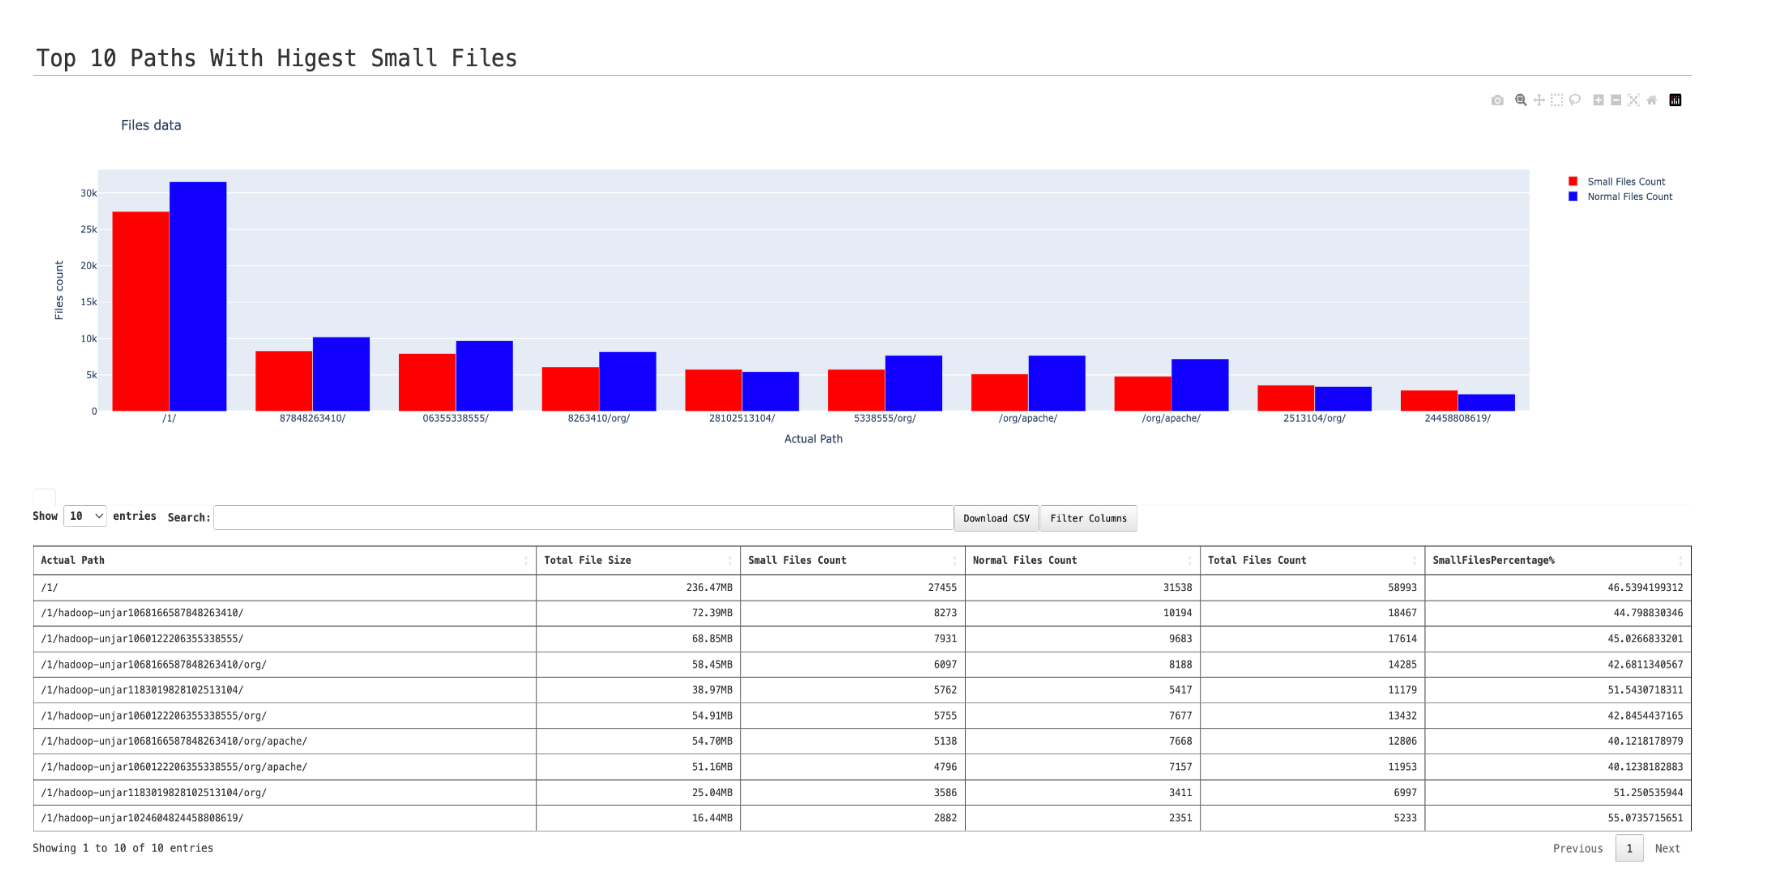
Top 10 Paths with Highest Small Files
Viewing metrics and insights
Open the report and click any app link from the Signature column.
The Metrics tab displays the trend charts for the Duration, IO, MemorySeconds, and CPU metrics. The dots plotted on the trend charts are the app runs. The app info is provided in the right panel.
You can select any of the following features to view the metric trends:
status
cluster id
cluster UID
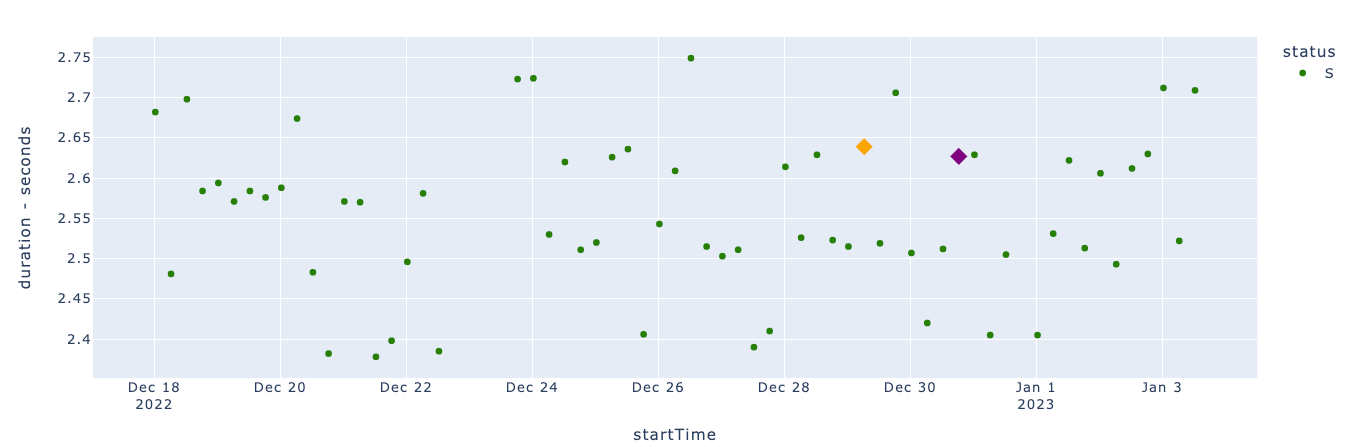
Click any dot on any of the Metric trend charts. This becomes the app target run. The details of the app target run appear in the App Run info panel on the right.
In the App Run info panel, click the ID link. This is the ID link of the app target run. The Metric tab is shown with the app target run you have chosen in a different color. The details of the app target run are displayed in the App Target Run panel on the right. Click the View in Unravel link to view the app's details in Unravel.
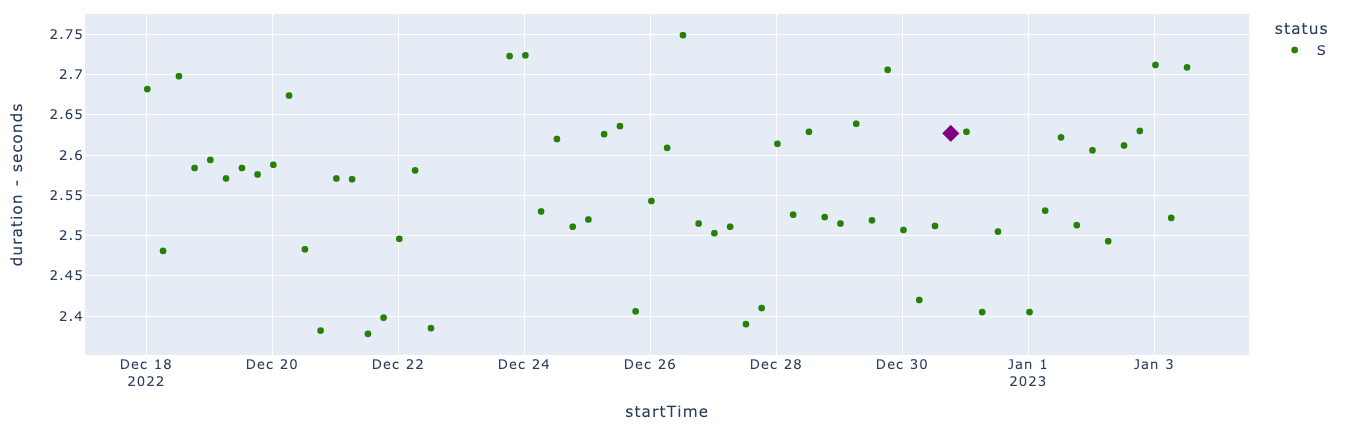
Select any dot (other than the dot for the app target run) on any of the Metric trend charts. This becomes the app baseline run. This is highlighted in a different color. The details of the app target run are displayed in the App Baseline Run panel on the right. Click the View in Unravel link to view the app's details in Unravel.
In the App Baseline Run panel, click Compare.
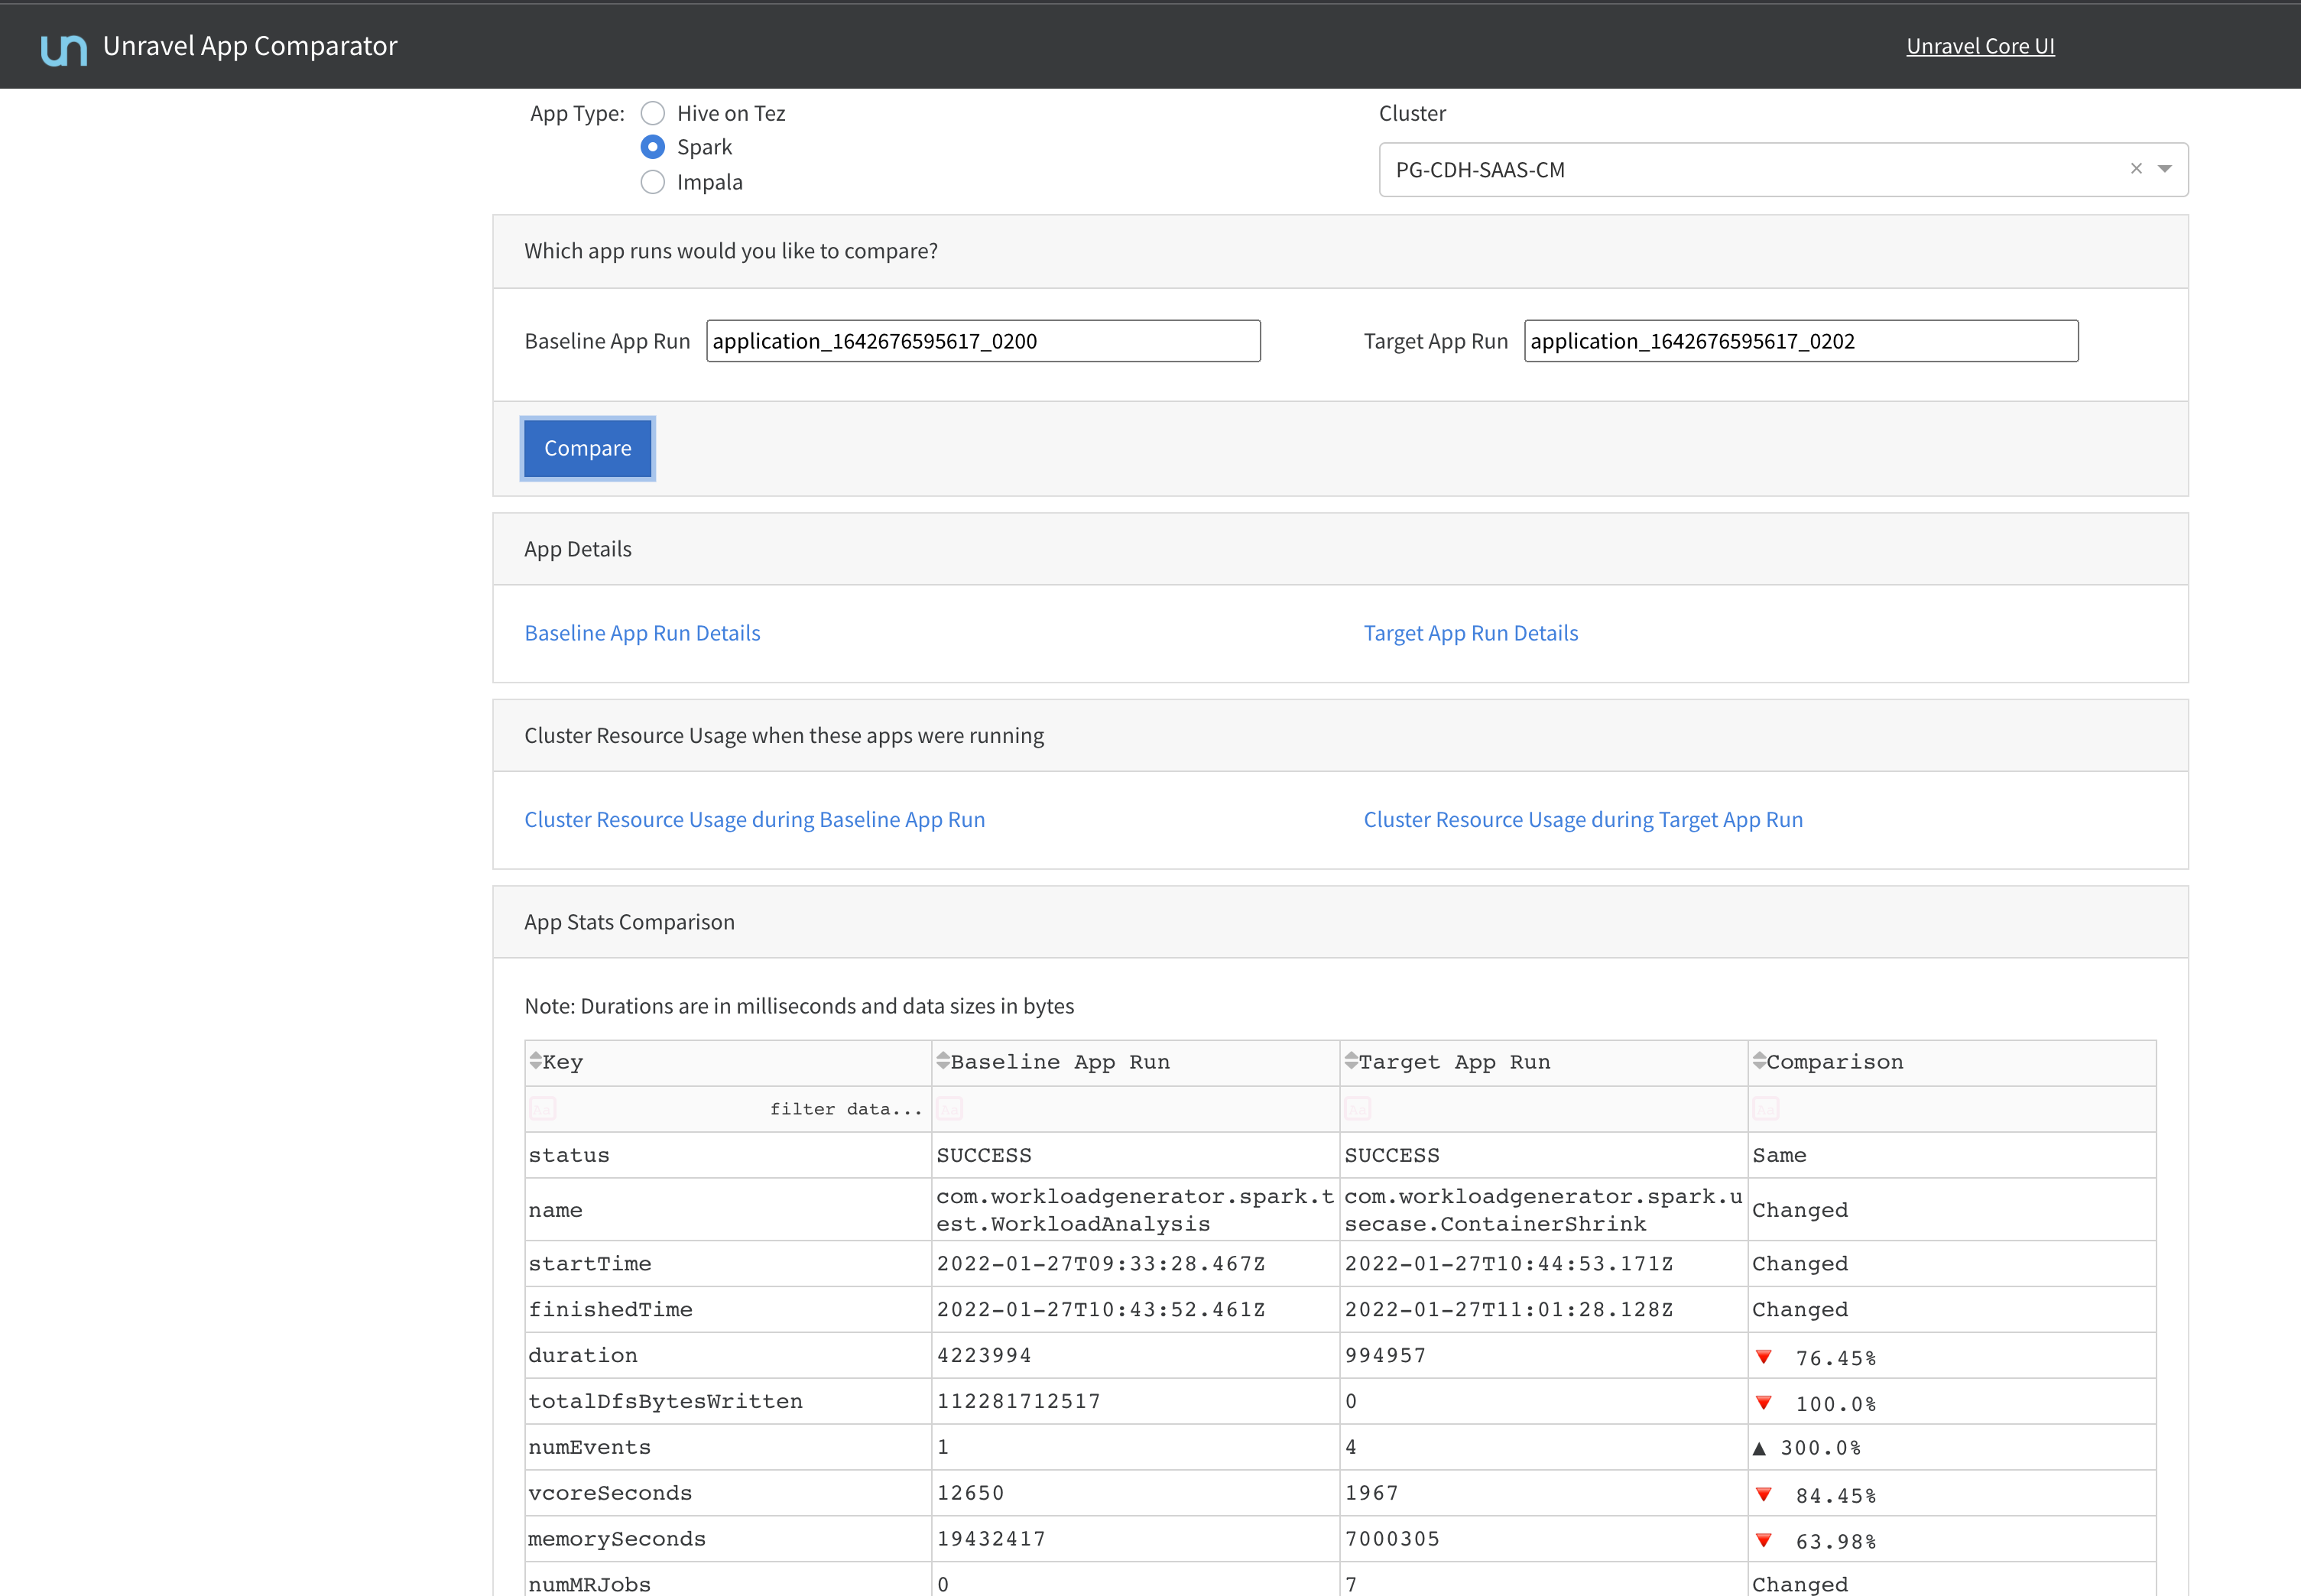
Select an app from the App Type options:
Hive on Tez
Spark
Impala
From the Cluster, select a cluster.
Specify the app runs that you want to compare.
Baseline App Run: Specify the ID of the baseline app.
Target App Run: Specify the ID of the target app with which you want to compare the baseline app.
Click Compare. The following app details are given for the baseline and target app run:
App details
Cluster resource usage when these apps were running
App statistics comparison details
App config comparison details
Query string comparison details
Query plan comparison details
In the App Baseline Run panel, click Refresh Insights. The insights are provided in the following sections.
Baseline comparison
The results of the comparison are displayed.
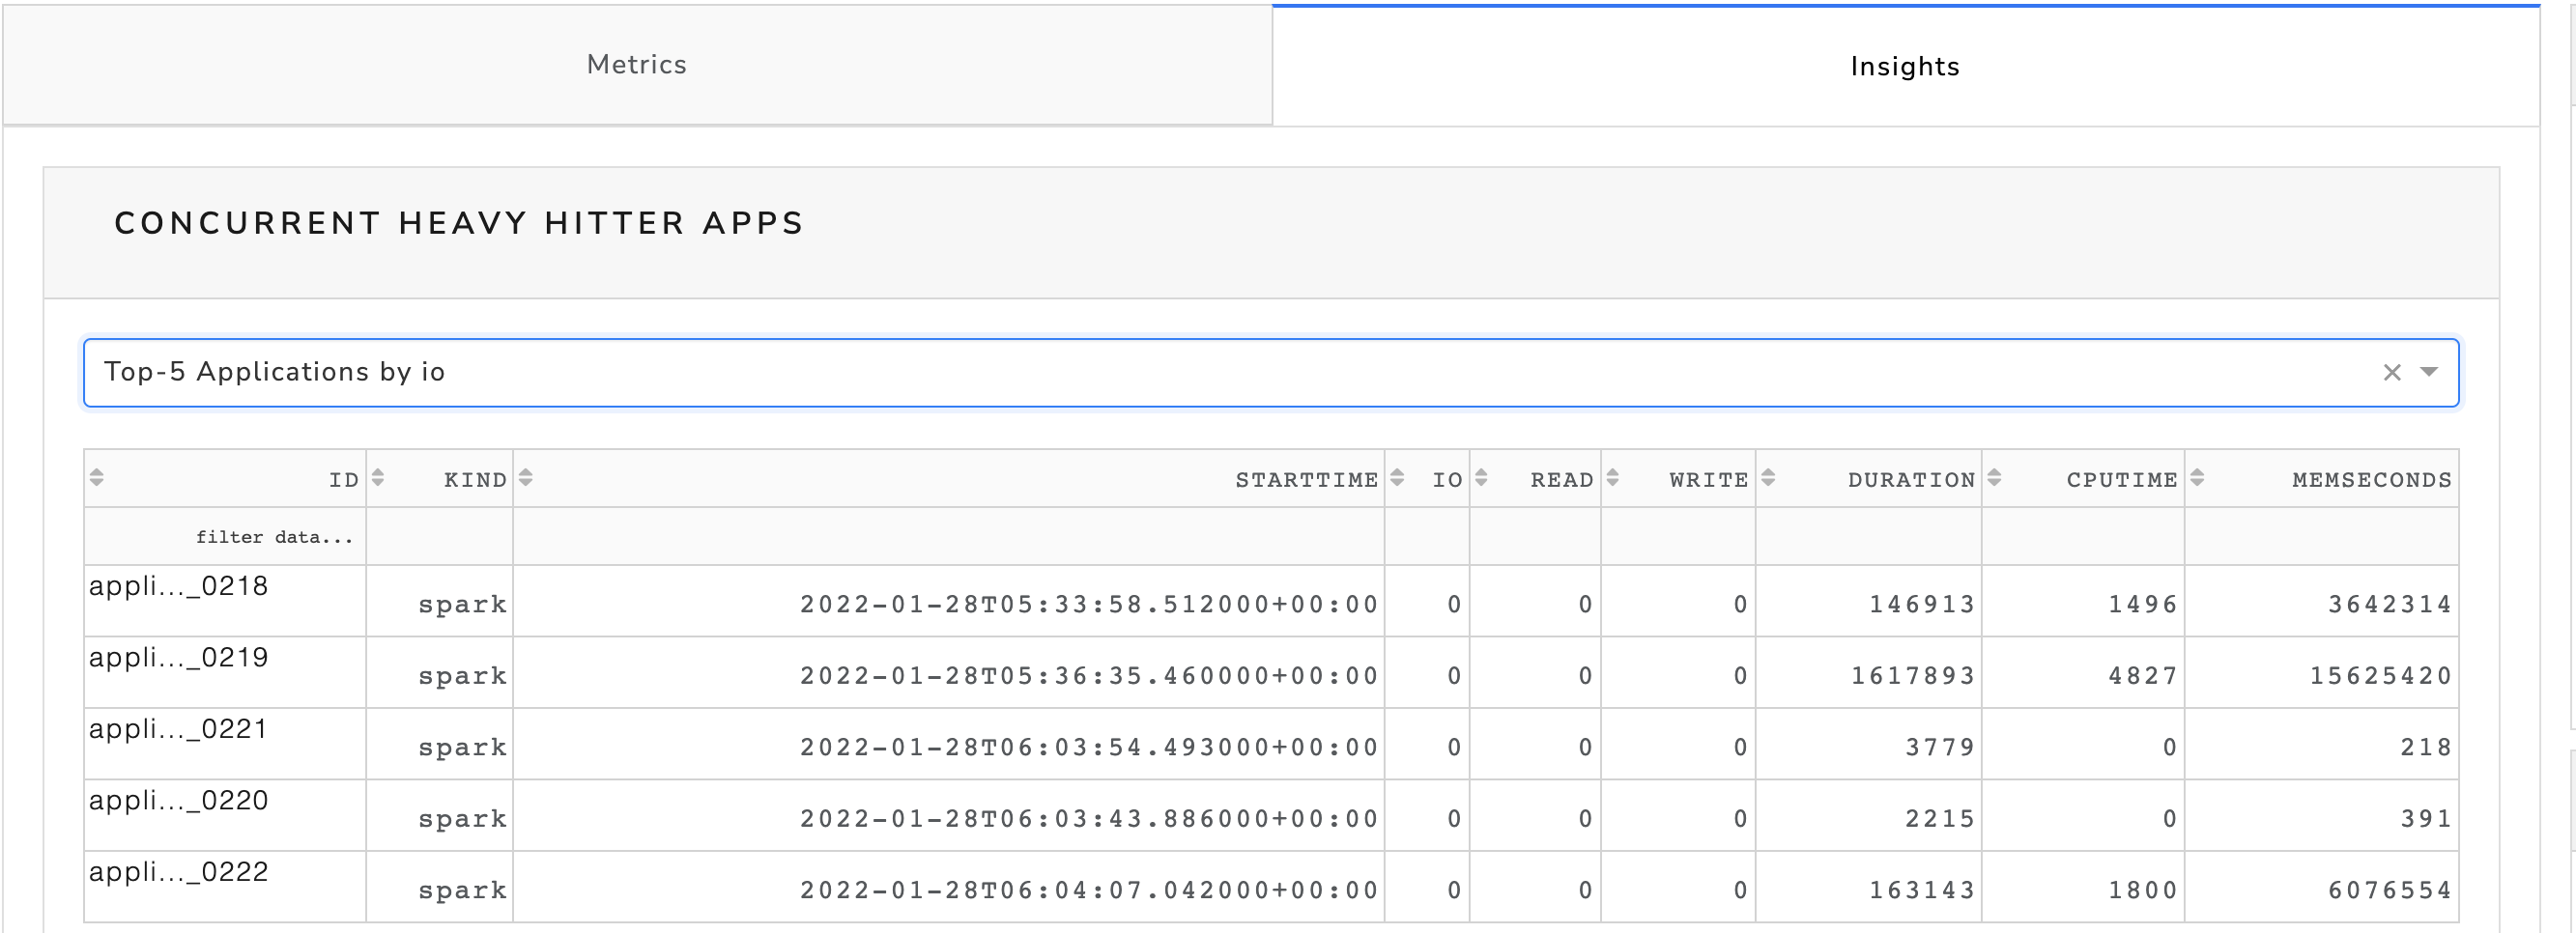
Concurrent heavy hitter apps
This section will show up only when the information is available.
Select this option to view the top five applications in a specific category.
Click the Concurrent heavy hitter apps option.
Select any option from the Top-5 Applications option.
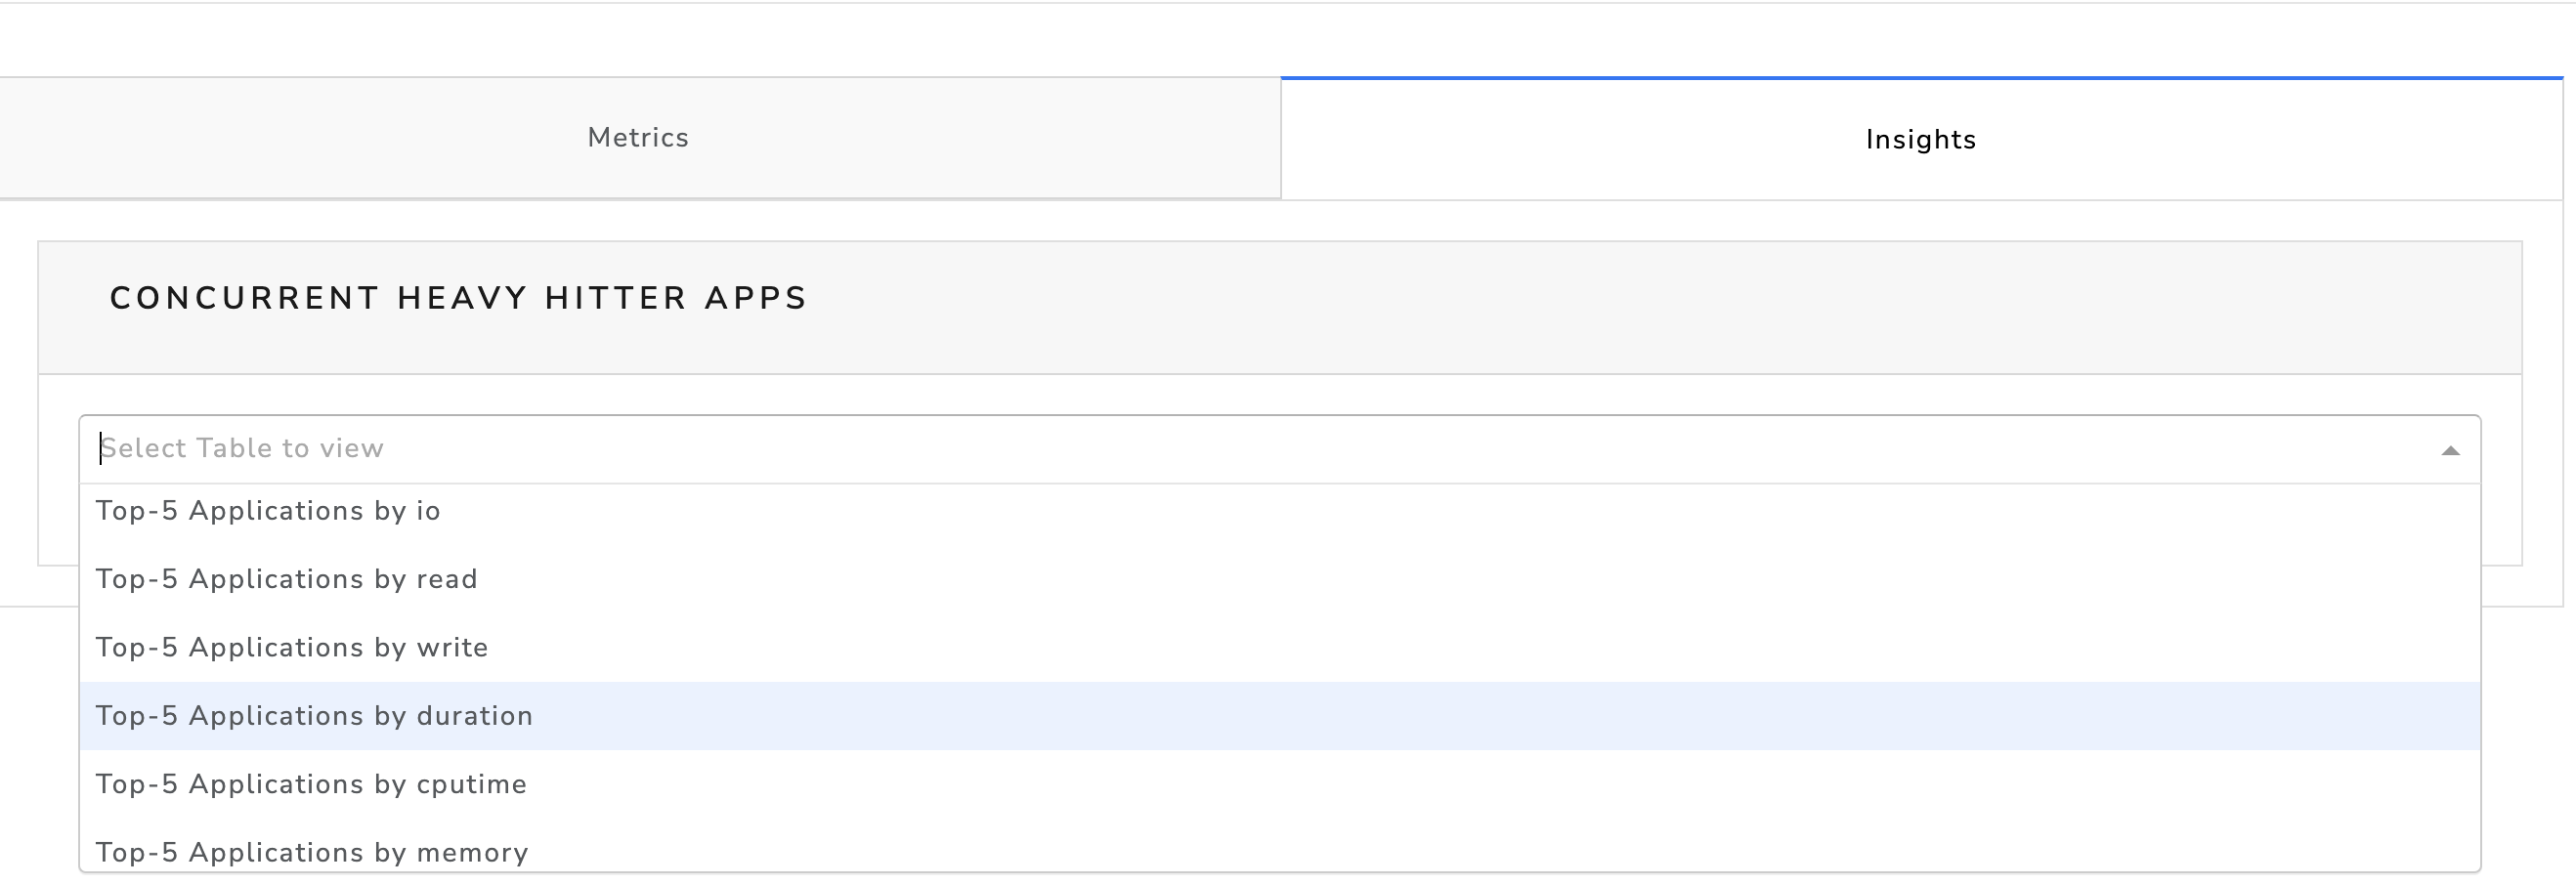
The corresponding details are displayed.