Applications
From the Applications tab, you can view the details of all the jobs running in your cluster based on the application types. By default, all the Jobs running for all the applications in the last hour are displayed. The required job details of an application can be listed quickly by:
Cluster-ID
Job ID and Keyword
Date/time range
These filters can vary based on the tab that you are viewing. For instance:
You can only filter the All and Running list of jobs by keyword or job ID.
You can filter all the views by Application Type.
The total number of applications that meet the filtering criteria is shown at the top of the left panel. You can easily filter the jobs from any of the following tabs and by the corresponding options provided on the left panel:
All: All the jobs in all the applications are listed, for a selected time range, regardless of the status.
Running: All the applications in running status during the selected time range are listed.
Inefficient: All the applications with inefficient events during their run are listed.
Note
These settings are not propagated across views. In other words, changing any of these values does not alter the settings for the other tabs. Like across the UI, your state is saved when you leave the view.
The Reset button sets all criteria, except date range, to the defaults. Therefore, the only filter applied is the date range.
Click any listed jobs to bring up the Application details page .
Click
 in the header row to select the columns to be displayed.
All applications
This tab displays all the jobs running on various application types. By default, this tab shows all the jobs running in all the applications in the past hour. The jobs are sorted in descending order on Start Time. To sort the results by another column, click the sort arrows ( ) next to the column header. Click the top arrow to sort the column in ascending order and the bottom in descending order. The column the list is currently sorted on has the sort choice highlighted (
 ). For cached queries, the Cache label is displayed next to the App Name/ ID.
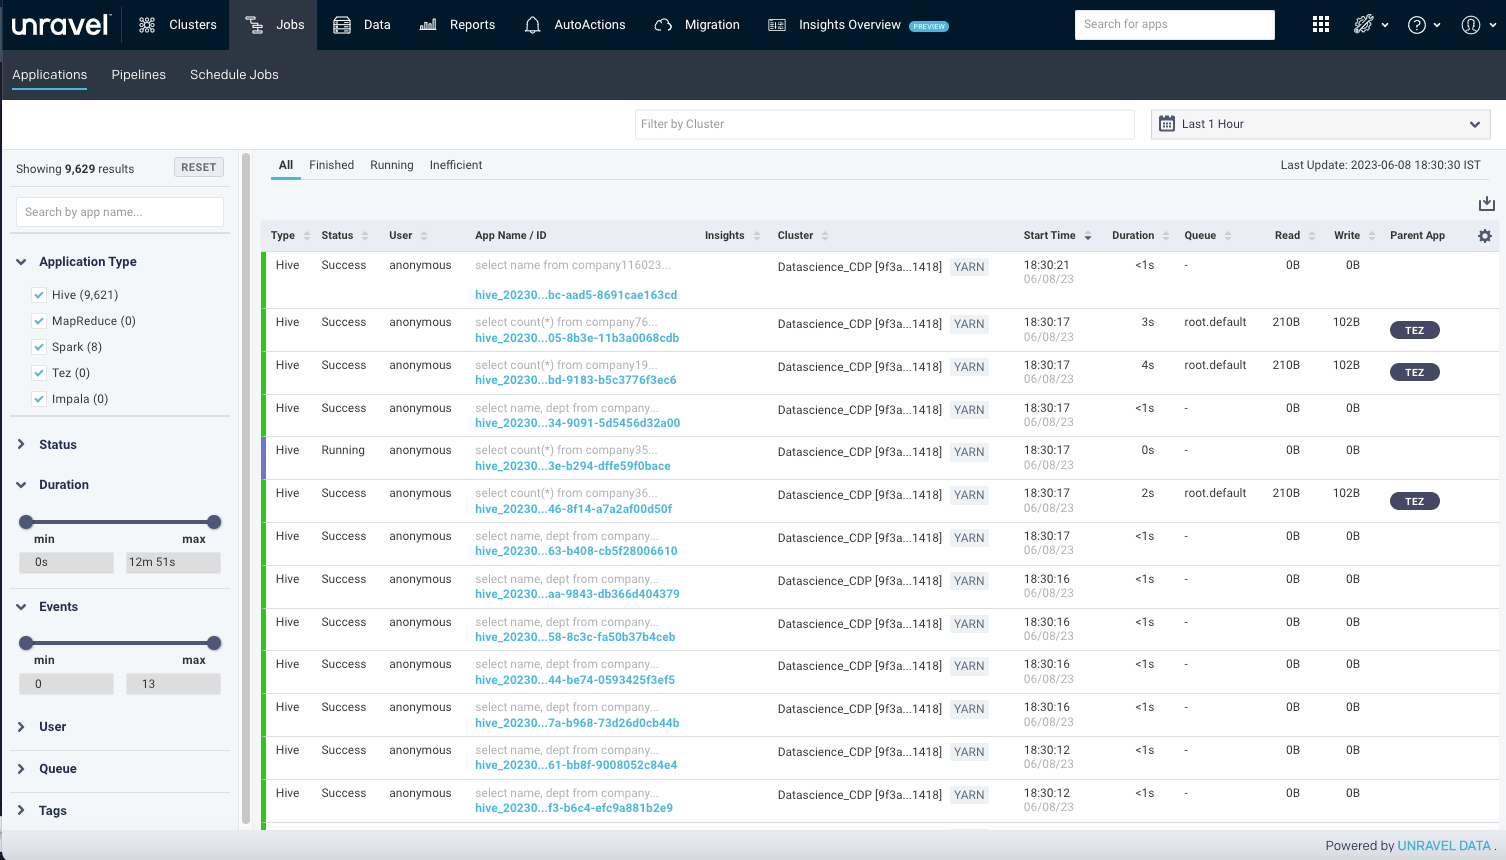
You can filter the applications by:
Entering an app name or string in the text box in the left pane.
Selecting a Cluster ID from the pull-down menu next to the date range picker.
You can further filter the jobs using any of the following options:
Filter Options | Description |
|---|---|
Application Type | Lists all the application types that are running on your cluster. Select the checkboxes corresponding to the application types to filter and list the jobs as per those application types. You can also click Only corresponding to an application type to filter only the jobs for that application. Click Show all , and all the jobs in all the application types are listed. |
Status | Select any of the following statuses to list the jobs that are specific to these states: 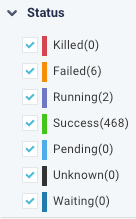 The colors corresponding to the status options serve as the legend for the all Applications table. 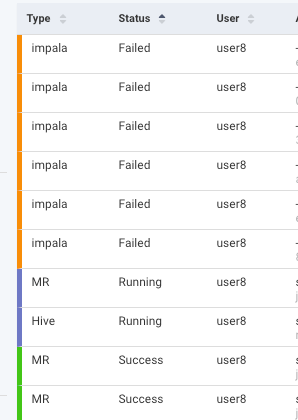 You can also click Only corresponding to status to list only the jobs in a specific status. Click Show all , and all the jobs for in all the statuses are listed. |
Duration | Lists the jobs as per the selected duration of the job run. Use the range slider to adjust the duration. The range of duration for the currently displayed apps, for example, 00:00:21 - 01:12:03. |
Events | The upper and lower bound of the events, for example, 1-10. You can select the bounds to use by adjusting the events slider for min and max values. |
User | Lists the jobs based on the user. Click in the text box for valid options. Click an option to select it or the |
Queue | Lists the jobs based on the queue. Click in the text box for valid options. Click an option to select it or the |
Tags | All possible tag keys are listed. Select the check box next to the key . Once selected, a text box is displayed below the tag. Click within the box for the key's tag values . Click a value to select it, and click the |

The application list displays the following columns:
Columns | Description |
|---|---|
Type | Type of applications. For example, Spark, Hive, and so on. |
Status | Status of the jobs running on the application. One of the following statuses is displayed. |
User | The name of the user running the jobs on the application. |
App Name/ID | Name or ID of the application. You can click the link to view the corresponding application details page. |
Insights
| Whenever Unravel has an analysis for the jobs that are run for an application, the Insights column displays this ( |
Cluster ID | The ID of the cluster where the jobs on the application are run. |
Start Time | Date and time when the jobs on the applications started. |
Duration | The period since the application started. |
Cost | Cost related to that query. Currently, the cost is calculated based on the on-demand pricing model of BigQuery. |
Queue | The queue to which the jobs belong. |
Read | The number of bytes read by the applications. |
Write | The number of bytes written by the application. |
Events | The upper and lower bound of the events, for example, 1-10. You can select the bounds to use by adjusting the events slider for min and max values. |
Parent App | The Parent App column has a link to the parent application of the job or related application. Click the link to bring up the details page of the parent application. |

Running applications
This tab lists all the running applications on the cluster.
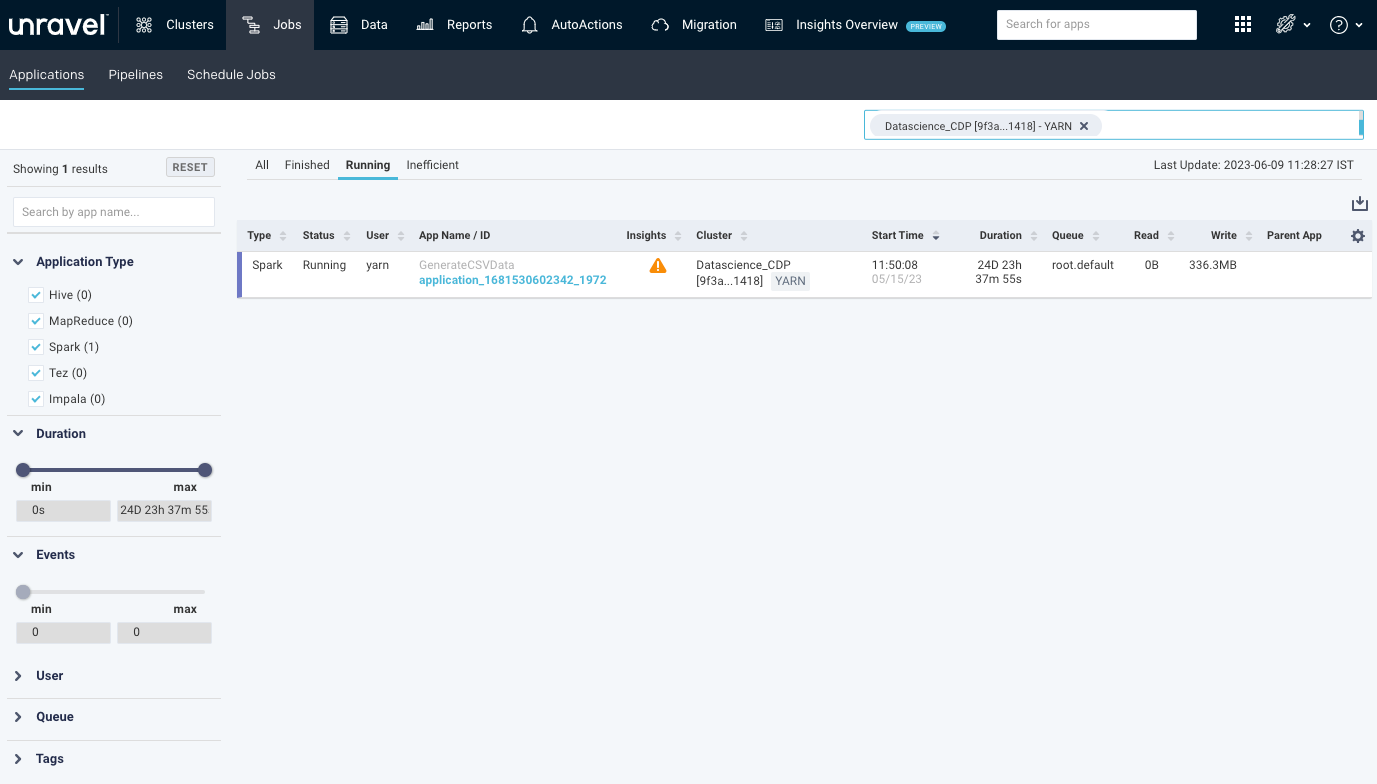
Unravel polls the Resource Manager every 90 seconds to get the resources (vCores, Memory MB, and running containers) for all running and pending apps.
Apps that run less than 90 seconds are usually not captured; that is, unless the application is running at the exact moment the Resource Manager is polled, the application data is not captured. Therefore, for any given point in time, the total number of apps running does not match the number of apps in Applications > Applications if you filter simultaneously.
See All applications above for details on the filter options. This view does not have a status filter or date picker for time since it only shows the running jobs.
Inefficient Apps
This view lists all the apps which have inefficient events.
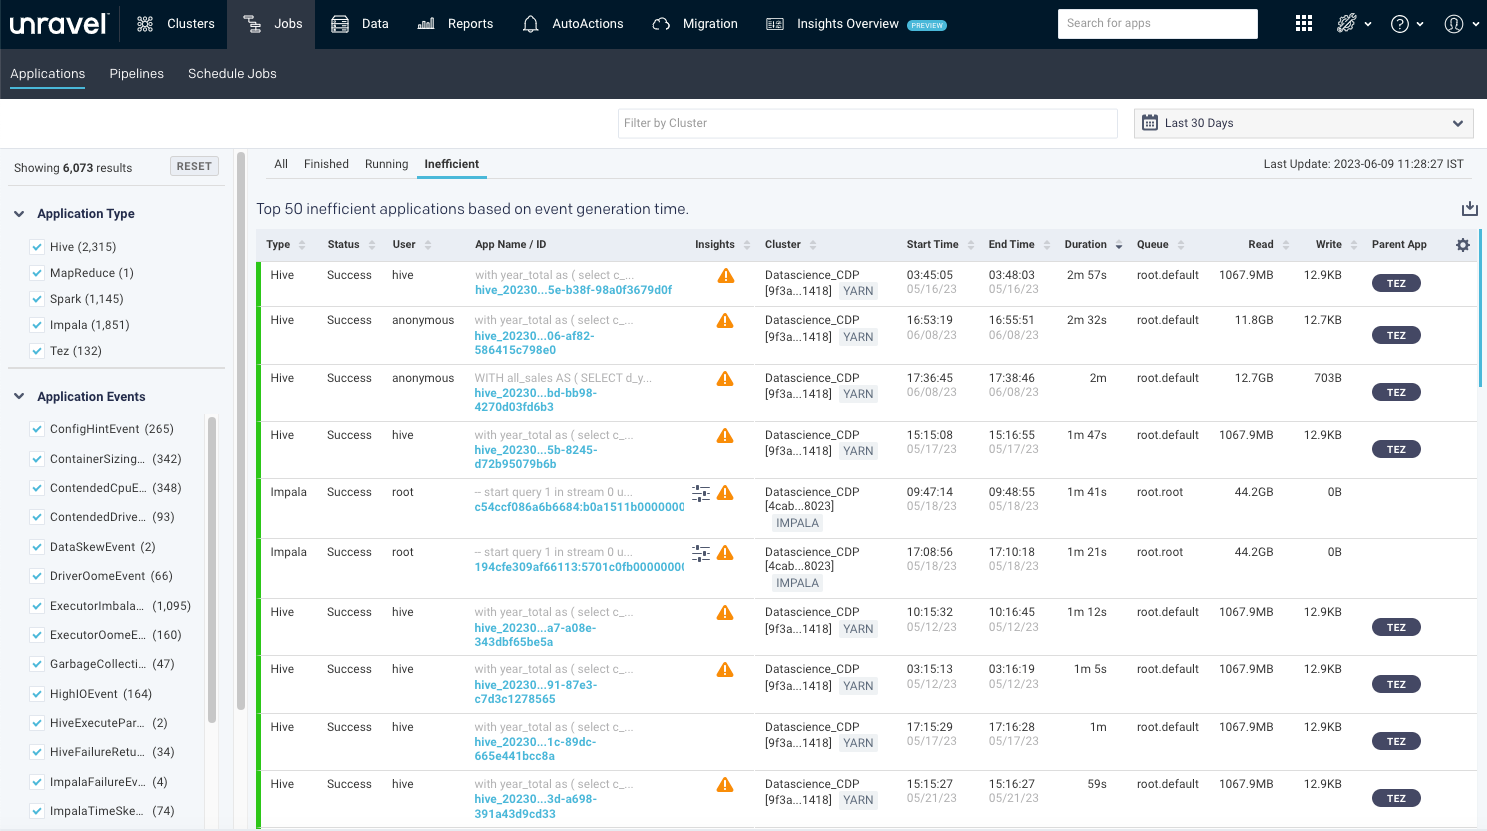
The only filter options are Application Type and Application Events. Hover over the Application Event names to see the complete name. Click the job to bring up the job on its APM page. Go to the analysis tab for complete explanations of the job's inefficiencies.
Click the  Download CSV icon to download inefficient jobs as a CSV file.