User and Usage report
Using this report, you can analyze users and usages. You can understand the usage of the cluster by joining cluster-level resource information with business-level metadata. This report is relevant for analyzing MR, Hive, Spark, and Impala applications.
Click Generate Reports > New button.
In the New Report dialog box, enter the following details.
Items
Description
General
Name
Name of the report.
Environment
Select your platform. The reports corresponding to the selected platform are only listed in the Report type. If you select the All option, all the reports are listed.
Report type
Type of report. Select User and Usage report.
Schedule
Select the checkbox to schedule the report to run daily, hourly, weekly, or monthly. You can also set the schedule can using a cron expression. You can expand the Example drop-down and select the corresponding options. The next four sample run times are displayed for reference.
Retention
The number of days to retain the report files. All the reports are stored in the
apps-insights-reports/src/jobsdirectory. After completion of the retention period, the report files are automatically purged.Parameters
Application Kind
Select the type of application. Options are MR, Hive, Spark, and Impala.
Look Back
The period range in days when applications can be selected for report generation. A notification is displayed above this option that informs about the duration when data is available for the report.
Resource Metric
Specify the resource metric you want to be included in the report. This can be either memory or CPU.
Use External User Details
Check this option to specify if you want to include external users in the report. You can use the CSV report to provide the information. Here is a sample of the CSV file.
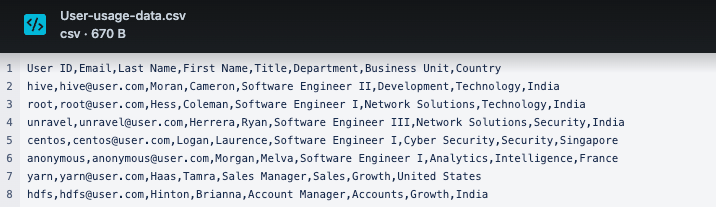
Further, you must provide the following details:
Path to user details file (csv)
Specify the path where you have copied the CSV file with user details.
User Id Column Name
Specify the column name of the User ID.
Aggregation Columns Name (Separated by comma)
Specify the column names that you want to aggregate separated by a comma. You can use any three columns from the CSV file. For example, Title, Department, and Business Unit. The resource usage is aggregated by the values in these columns and a summary will be presented in the report to show the usage distribution across users belonging to each of these aggregation columns.
Country Column Name
Specify the column name that lists the country name of the external users. This will be used to produce a GeoMap distribution of users across the globe.
Notifications
Email to
Email ID to send the notification when the report is generated. You can specify multiple email IDs with comma separation. You can also select the Attach Files to Email checkbox to receive the reports as an attachment.
Advance Options
Profile Memory
Click OK. The generated reports will be listed under Reports on the App UI.
Select the generated report and then click Run. After the report is successfully run, the details of the report runs are listed in the Run box on the right.
Click the following:
HTML files link to view the report details.
Input parameters link to view the parameters you chose to run the report.
Log file link to view the logs of the report.
The following reports are generated:
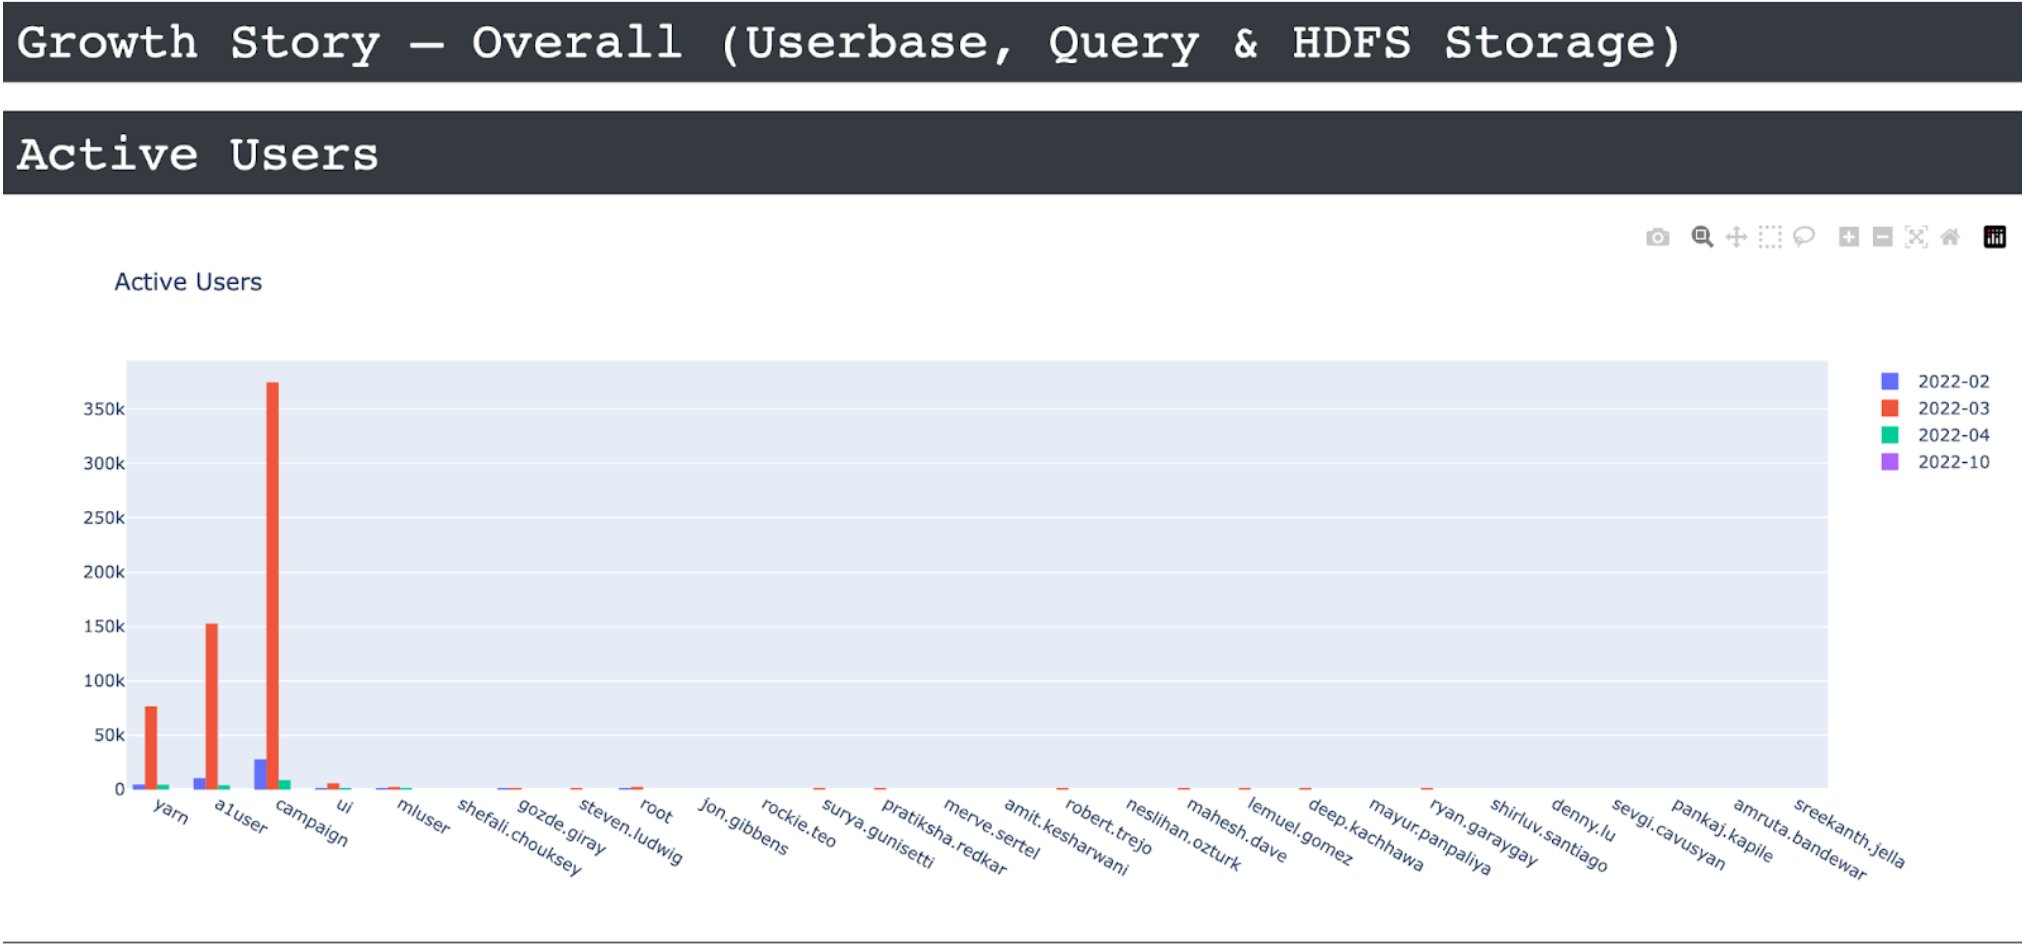
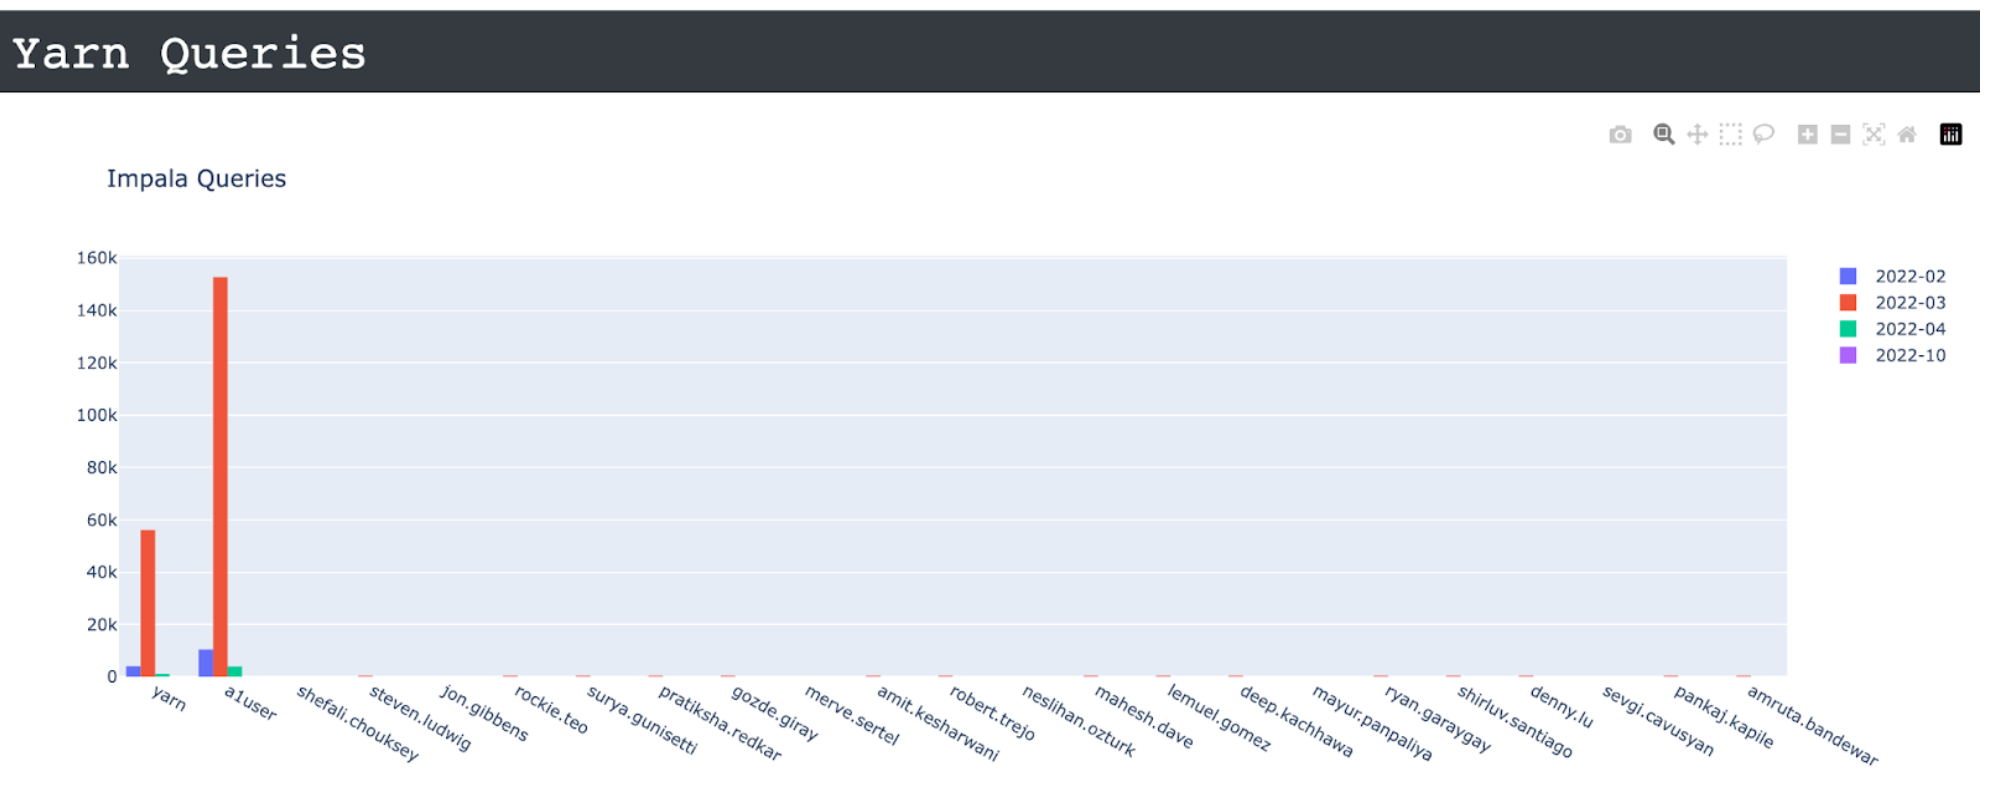
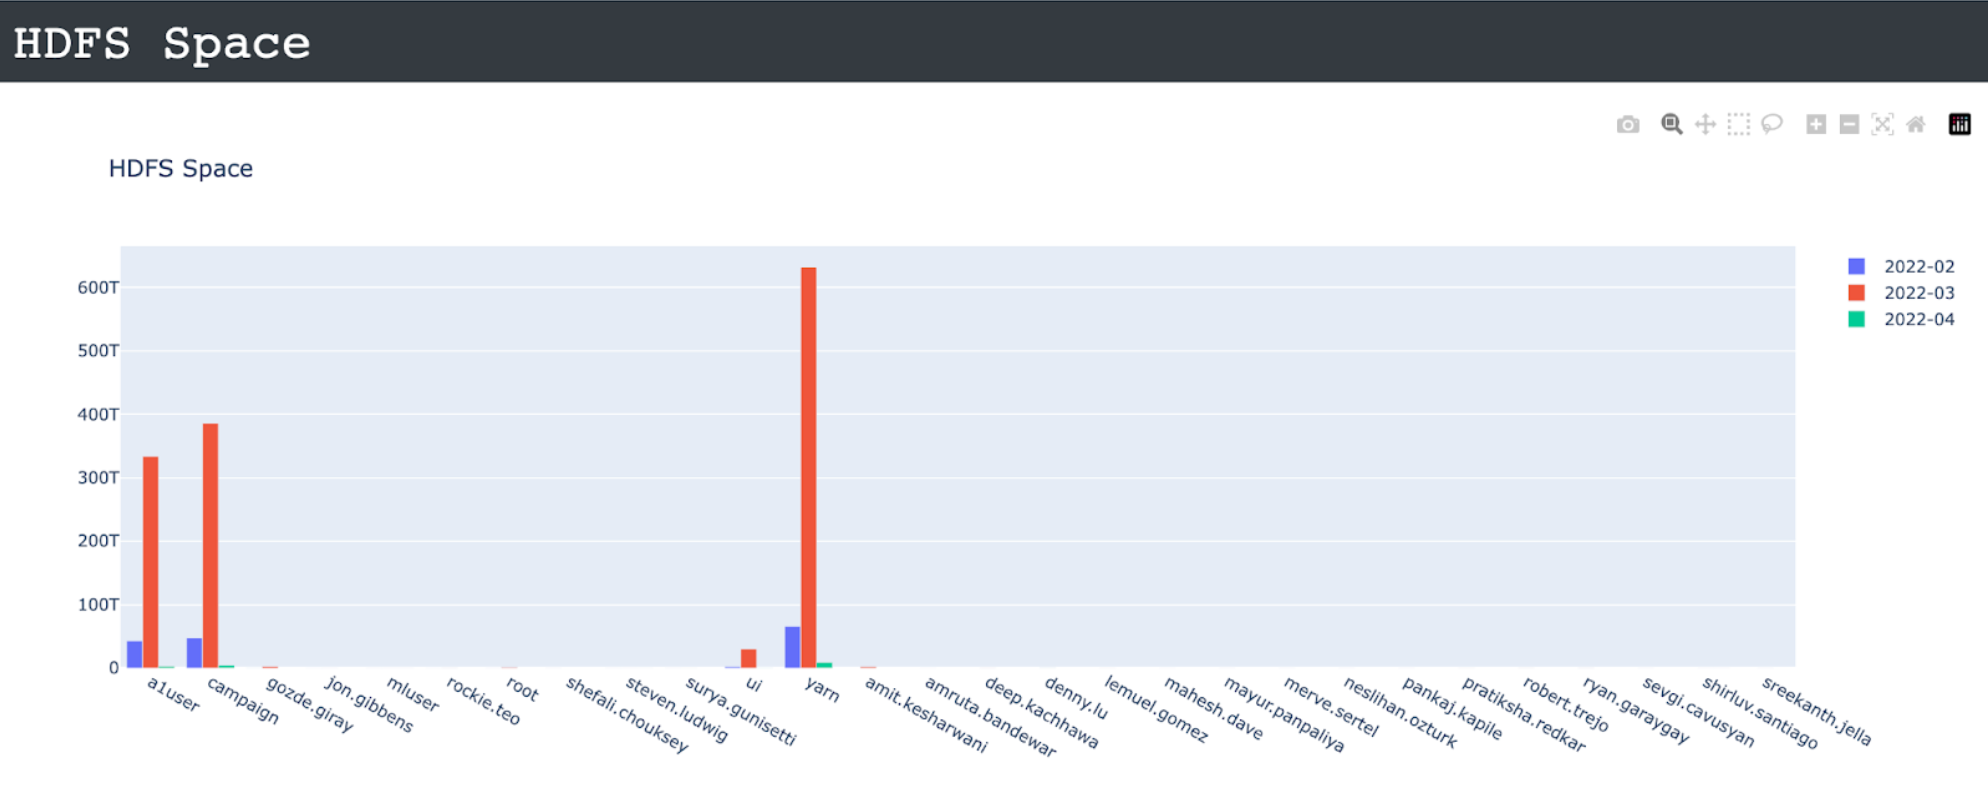
Growth story - Overall summary report (Userbase, Query, and HDFS storage)
Contains bar charts for users, queries, and HDFS storage.
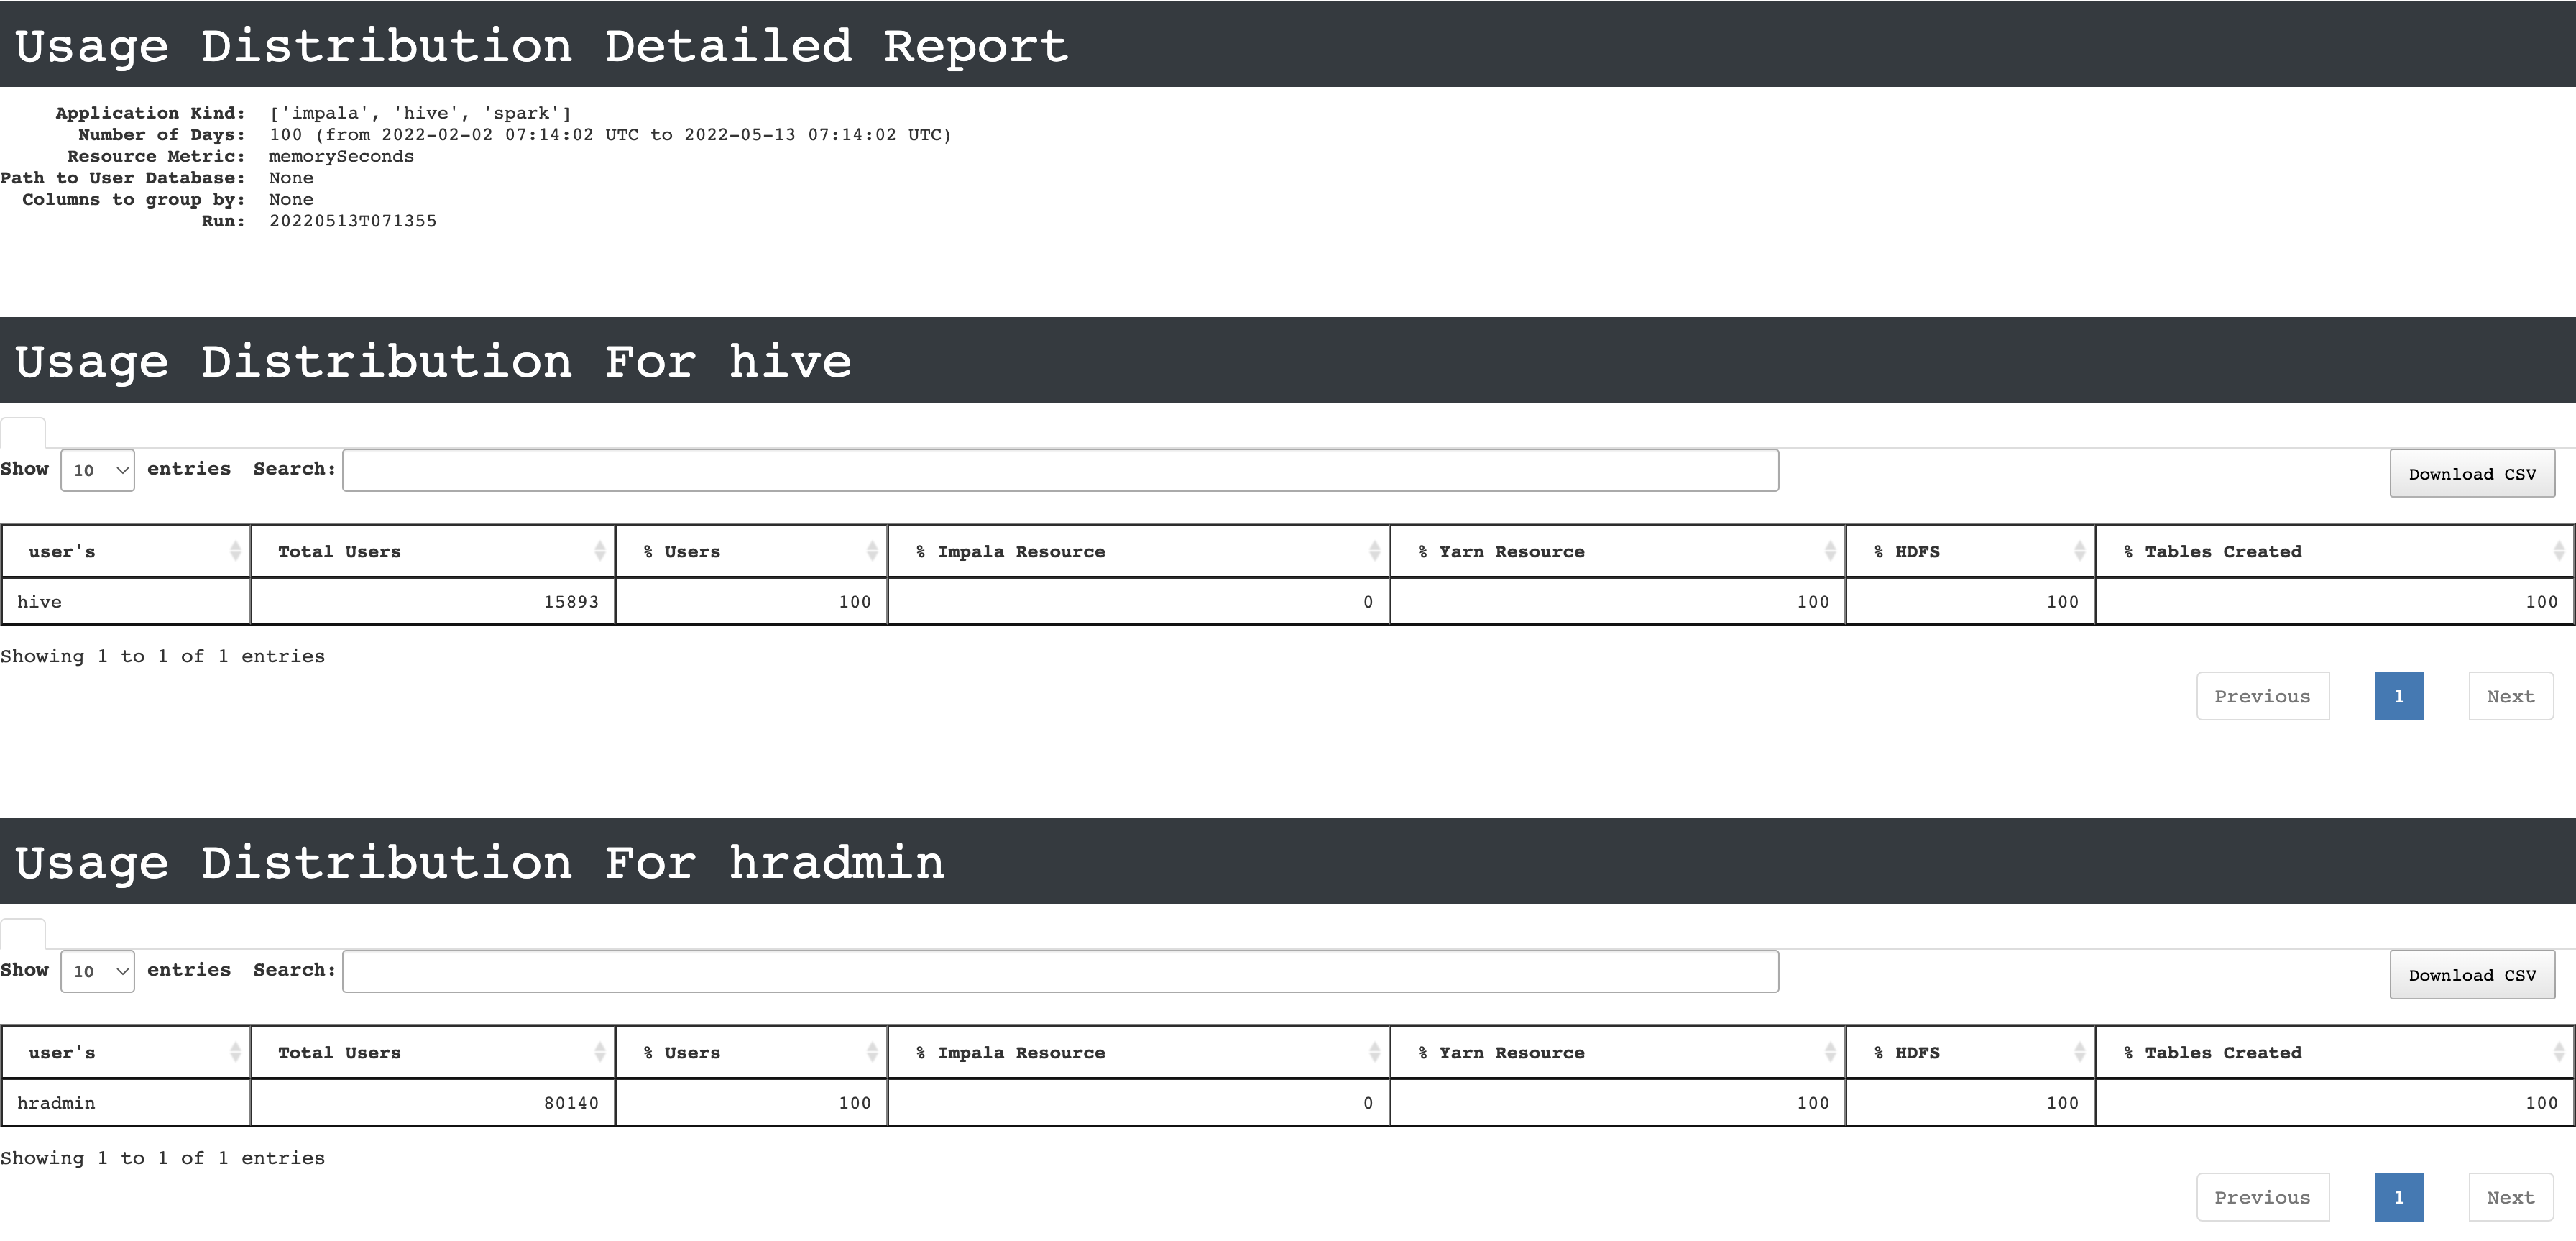
Usage distribution detailed report
The report contains a resource usage table for each user.
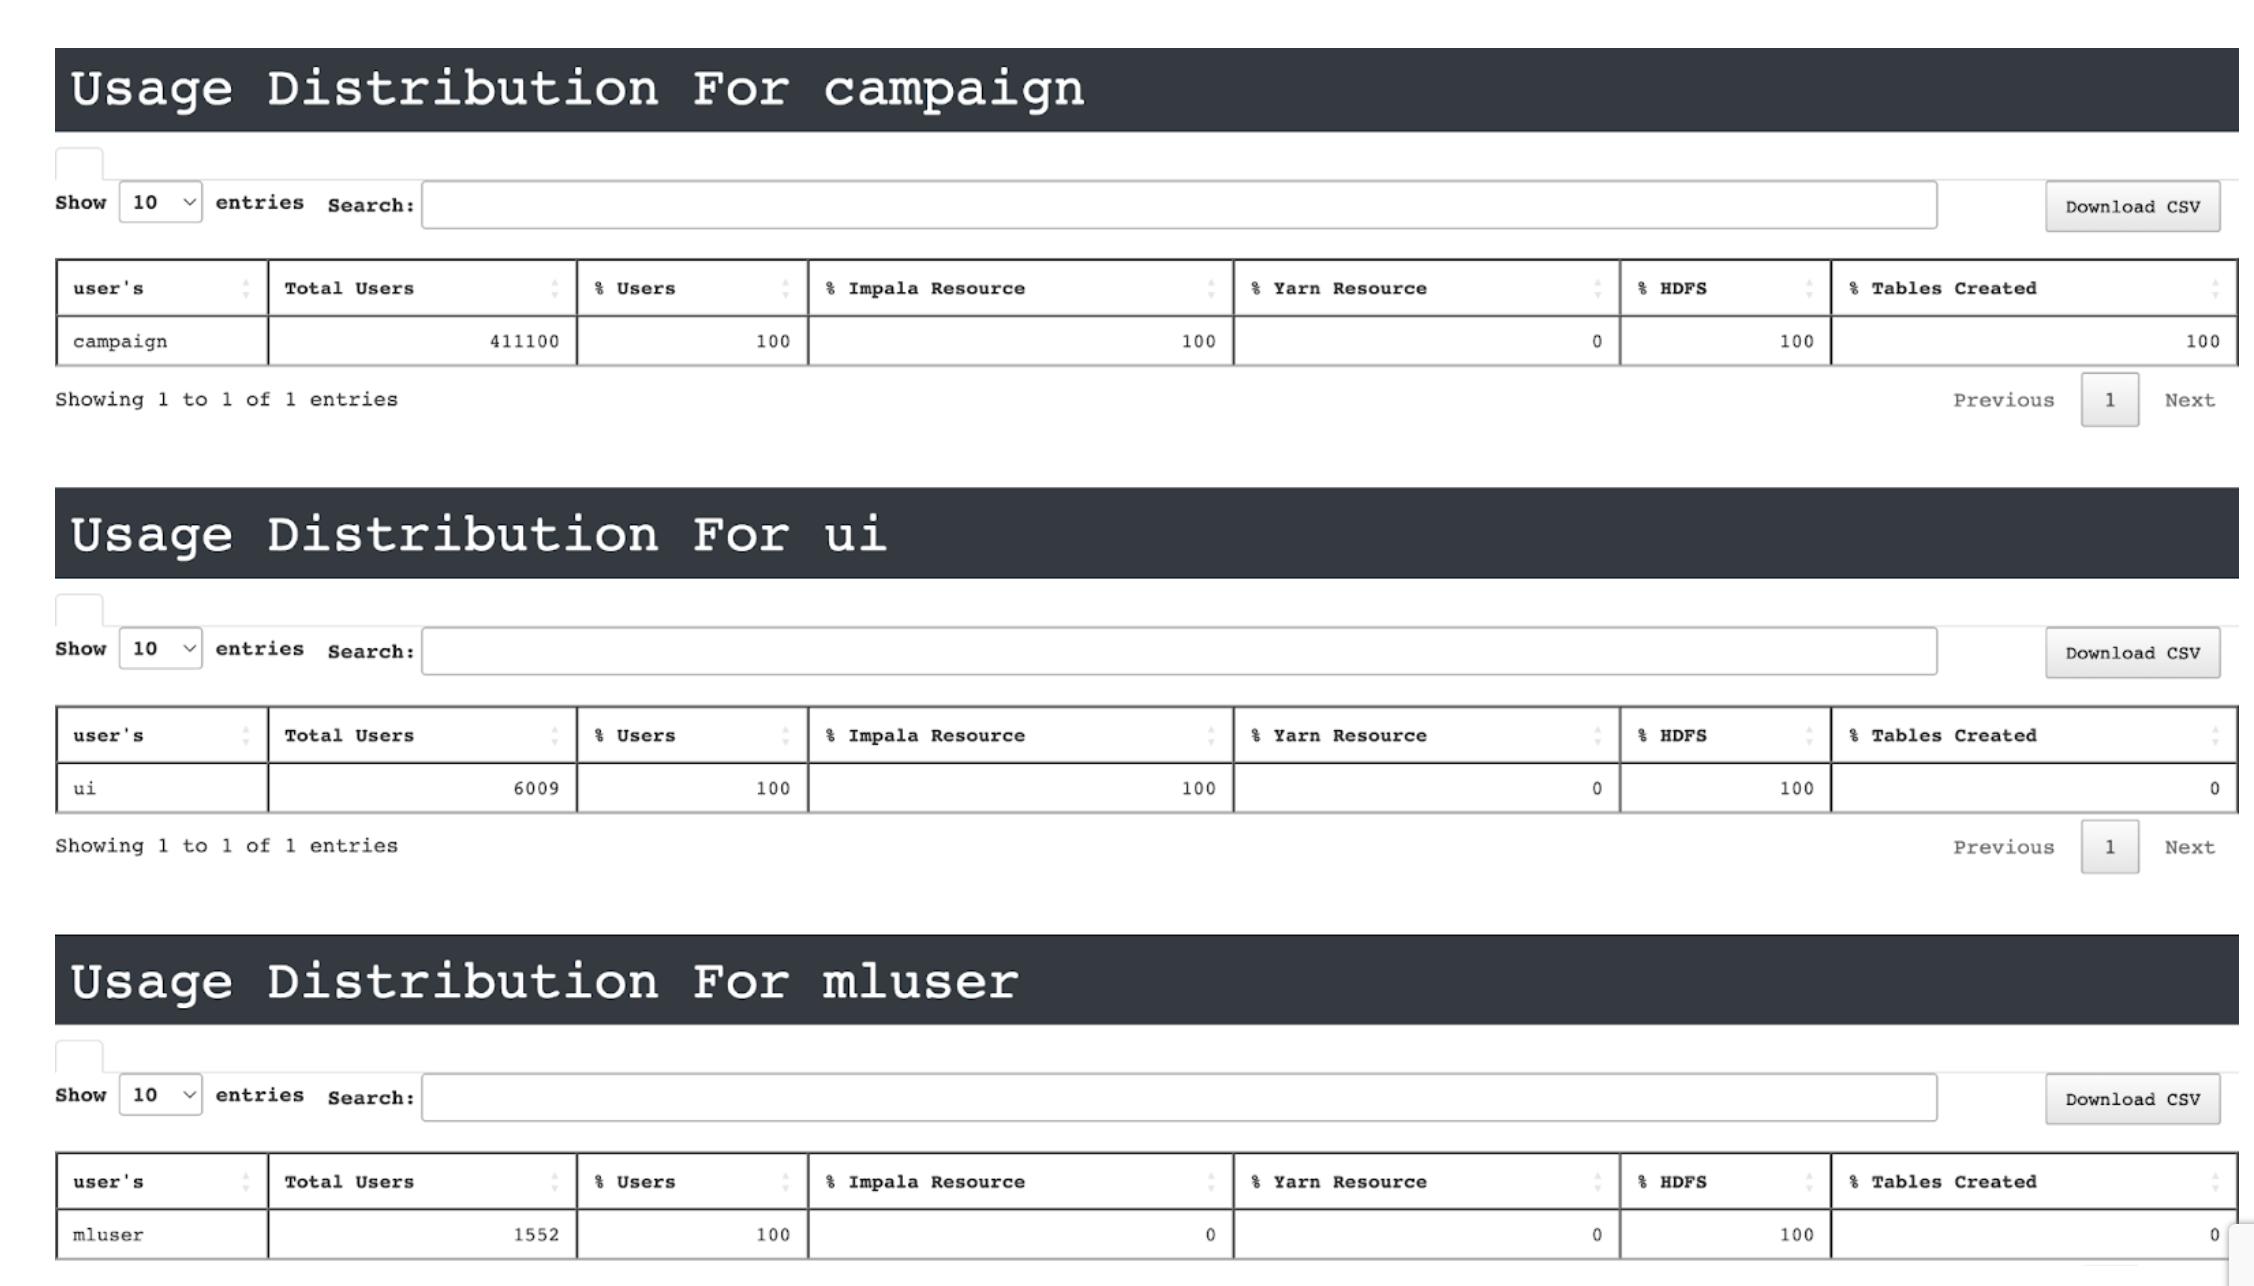
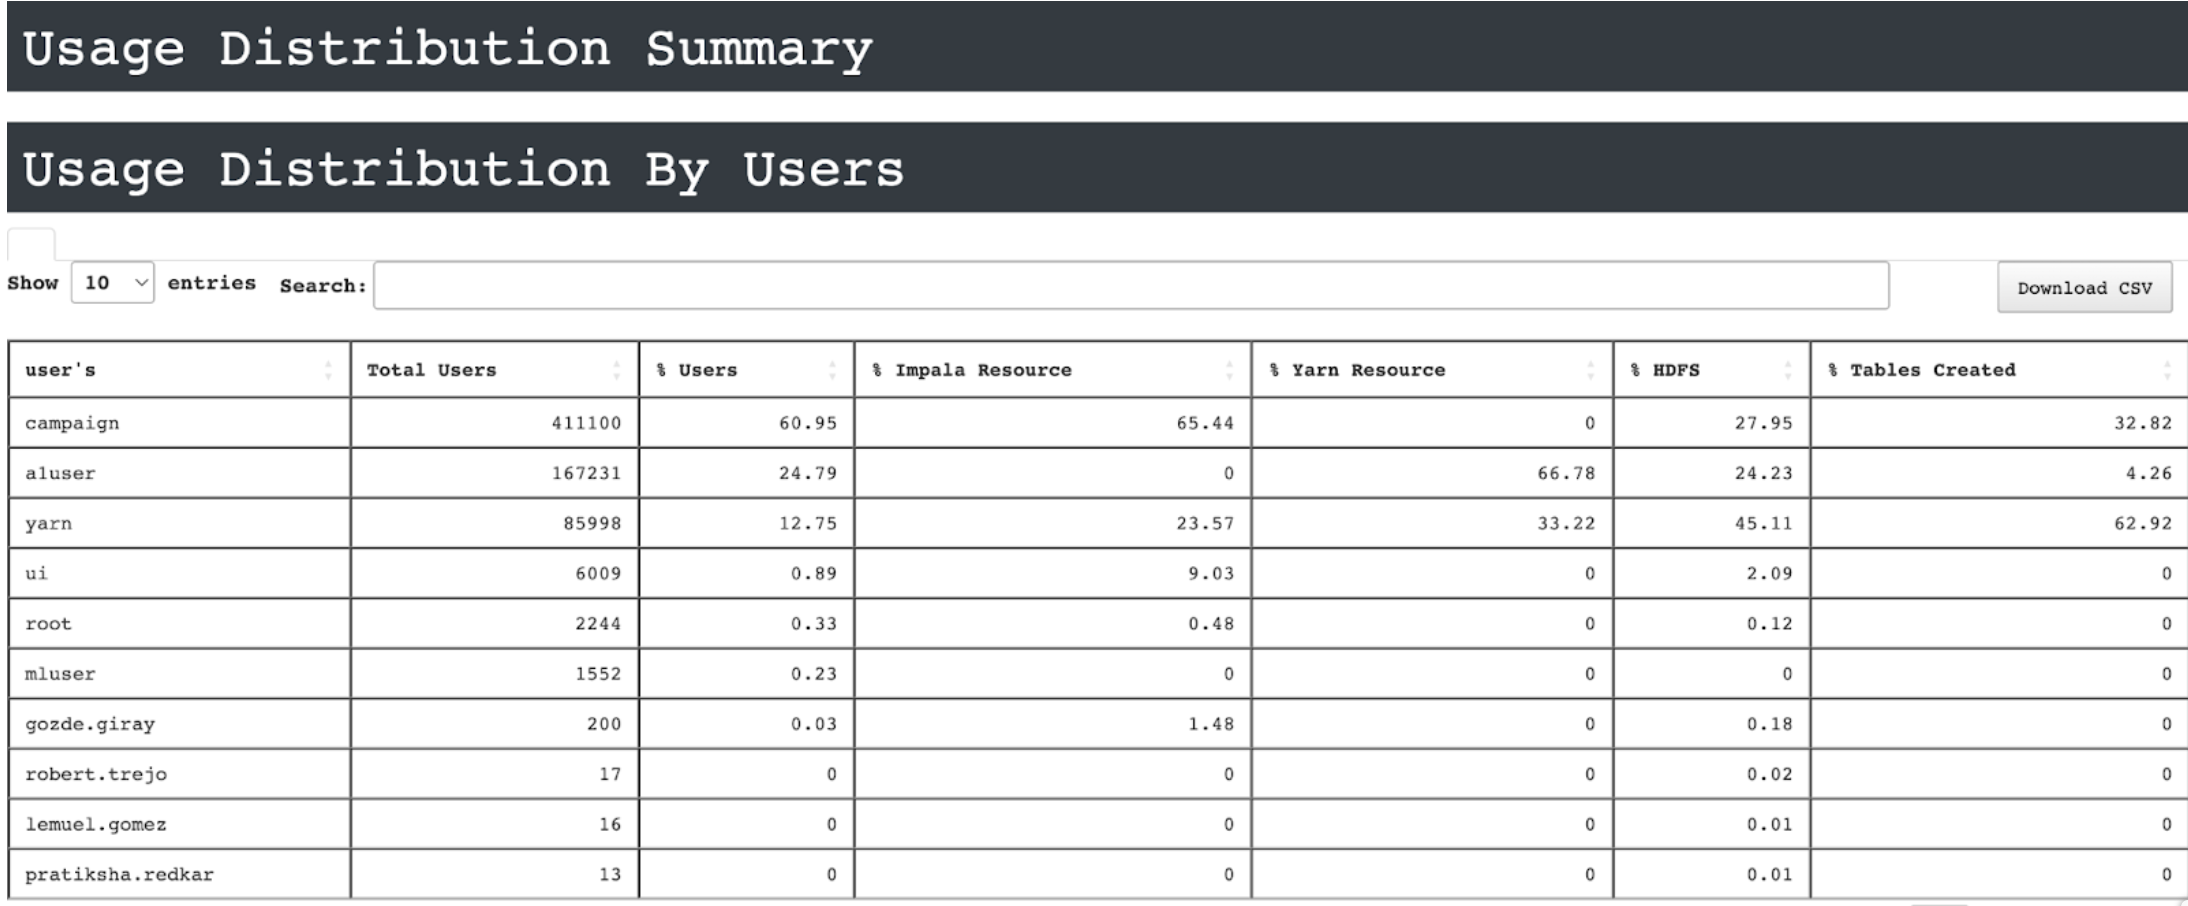
Usage distribution summary report
The summary report of all users’ resource usage.