Resources
Unravel polls the Resource Manager every 90 seconds to get the resources (VCores, memory, and running containers) for all the running and pending apps. The Resources tab displays the usage of resources by the clusters for a specific period. These resources can be of either Yarn or Impala type, and the resource usage can be filtered further by application type, user, queue, user-defined tags, and so on.
Note
Applications that run for less than 90 seconds are not captured. Unless the application is running when the Resource Manager is polled, the application data is not captured. Therefore, for any specific time, the total number of applications running may not match the number of applications in Jobs > All Applications if you filter simultaneously.
Viewing resources usage
To view the resources usage, do the following:
Go to the Clusters > Resources tab.
From the Resource Type drop-down, select either Yarn or Impala.
From the Cluster drop-down, select a cluster.
Select the period range from the date picker drop-down. You can also provide a custom period range. The graphs corresponding to the selected period range are displayed.
From the Interval drop-down, select the interval time. Based on the selected period range, the interval options are changed.
From the Group By drop-down, select any of the following options:
Application Type
User
Queue
User-defined tag key (see What is tagging)
Input/output tables
You can filter the Group By options further from the Filter options box. Click
 next to an option to deselect it.
For example, if you select Application Type as a Group By option, all the application types are listed in the Filter options box. You can then drill down to a specific application type, such as Spark.
Click any point in the chart. The details of the resources used for the running jobs are displayed in a table. You can hover the mouse pointer over the graph to view the corresponding values on the trend line. You can select a graph section and drag the pointer to zoom in. Click Reset Zoom to zoom out.
The following graphs plot the resource usage for a selected filter in the specified period range.
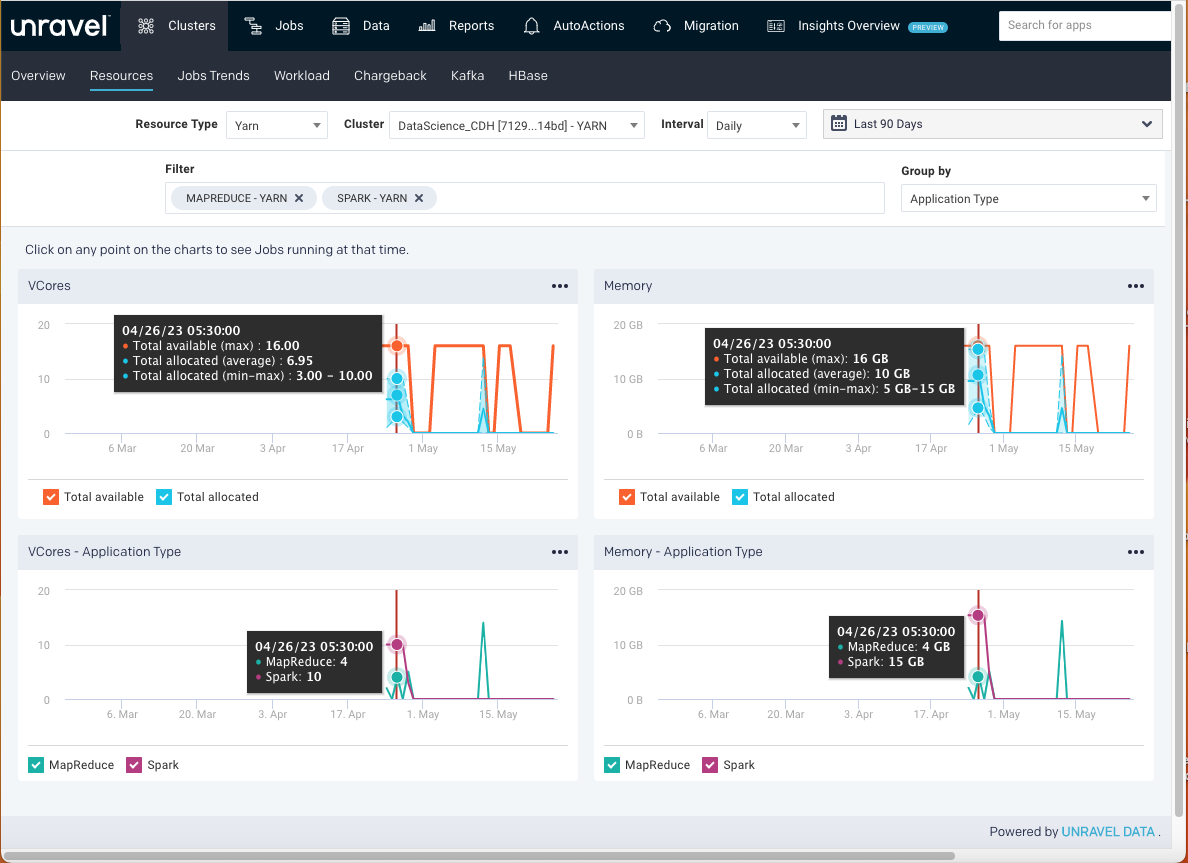
VCores
The VCores graph plots the total available and allocated VCores in your cluster for the specified period. Select or deselect the checkboxes to hide or show the available and allocated VCores.
Memory
The Memory graph plots the total available and allocated memory in your clusters for the specified period. Select or deselect the checkboxes to hide or show the total available and allocated memory.
VCores (Group By, Filter) and Memory (Group By, Filter)
This graph plots the VCores and memory resources usage by any of the following options in a cluster for the specified period.
Application type
User
Queue
User-defined tag key (see What is tagging)
Input/output tables
You can determine the further Filter options based on the selected Group By option.
Click
 in the upper-right of a graph to export the graph data to PDF, PNG, JPEG, SVG, CSV, or XLS formats.
 Click any point in the graph, and the following details of the resources used for a job are displayed in a table.
Items
Description
Type
The type of application where the job is running.
User
Name of the user running the job.
State
Status of the job.
App Name/ID
Name or ID of the application where the job is running.
Start Time
The time when you started the job.
Duration
Period till when the job has been running.
Queue
Name of the queue.
Progress
Percentage of the progress of the running job.
Memory MB
Memory in MB that is used by the job.
VCores
Number of the VCores used by the job.
Running Containers
Number of running containers.
Cluster
Cluster name and ID along with the resource type (Yarn/Impala)
Click a row in this table, and the corresponding Application details page is displayed.
Click the
 button in the upper-right of a table to export the table data as a CSV file.
 Click
 in the table to select the columns that must display.
Click
 to select the number of items to be displayed per page.