Applications page
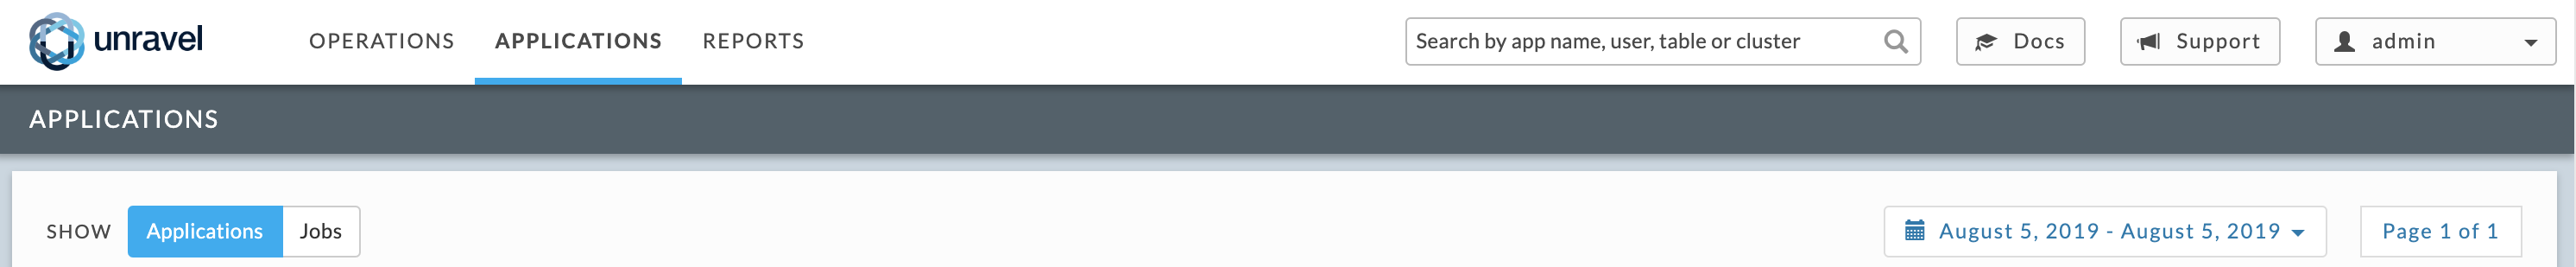
The Applications page for Databricks displays the following tabs:
Applications
The Applications tab lists all apps for the current day by default. The apps are sorted in descending order on Start Time. To order the results by another column, click the sort arrows ( ) next to the column header. Click the top arrow to sort the column by ascending order and the bottom for descending order. The column the list is currently sorted on has the sort choice highlighted (
 ).
).
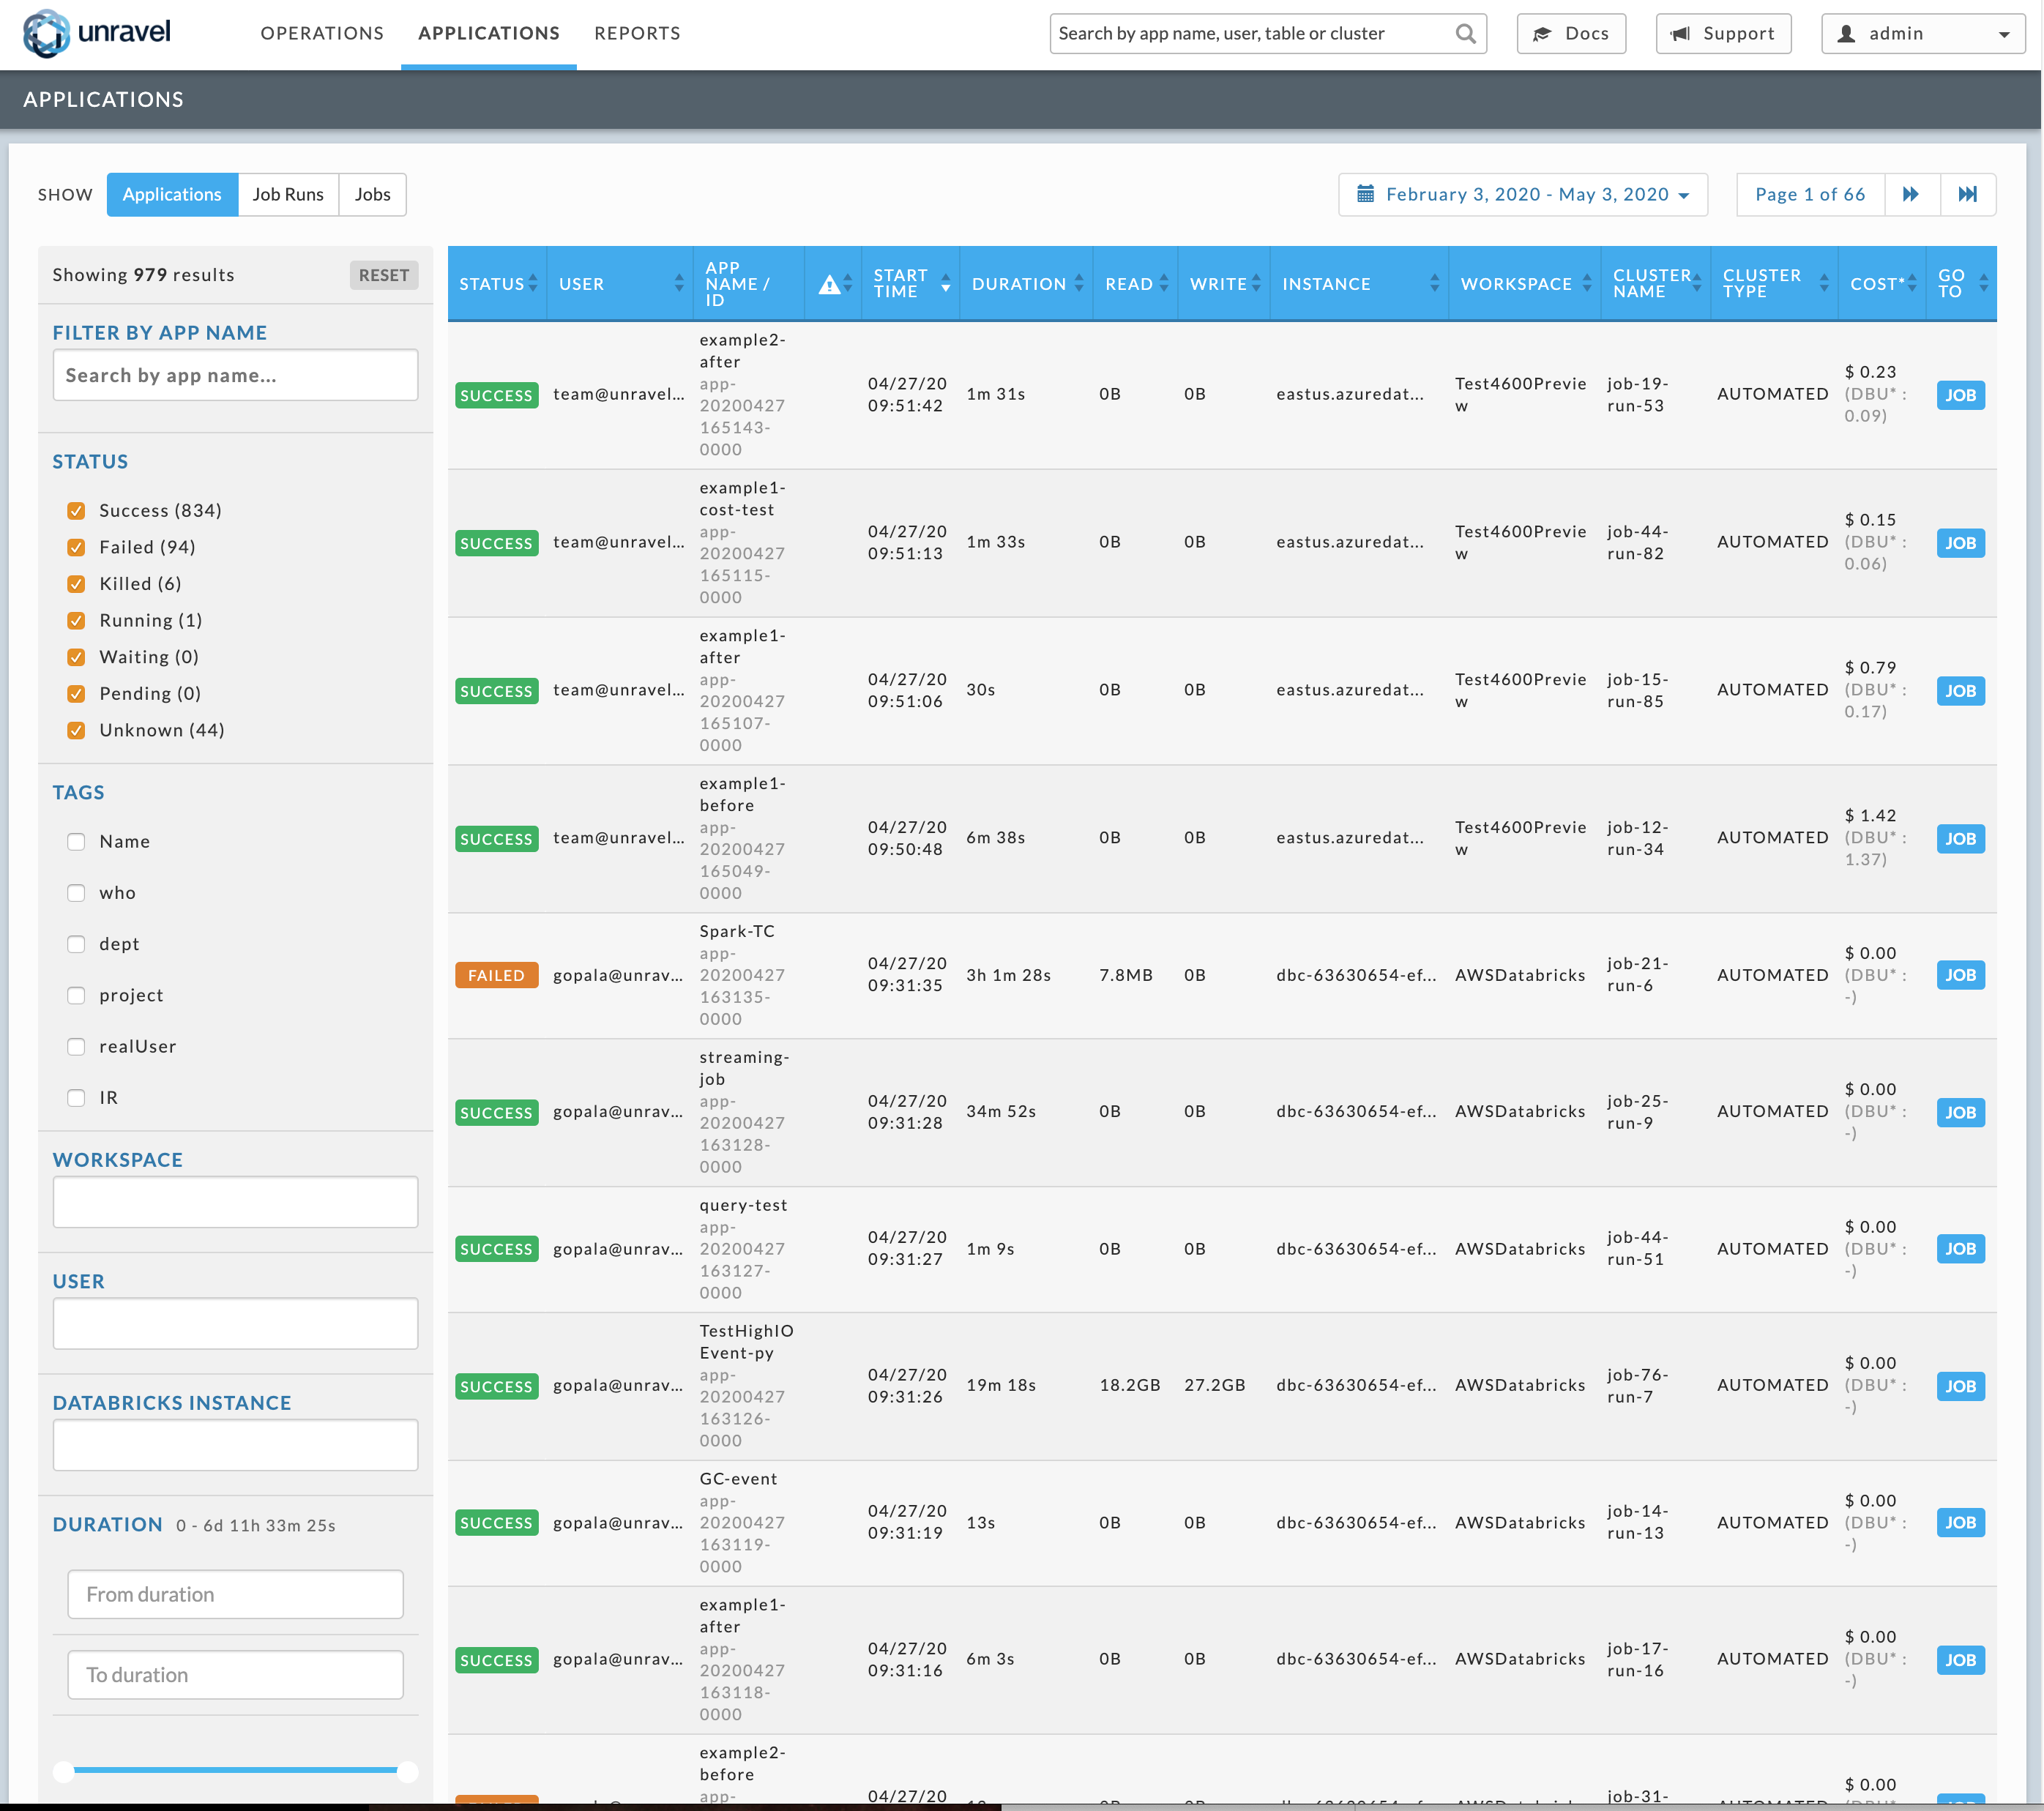
Because these apps are in the cloud there is no Type, Cluster Id, or Queue for the app.
The columns are as follows:
Columns | Description |
|---|---|
Status | App status. |
User | Name of the user who has run the job. |
App Name/ID | |
Notification Column ( | A fine-tuning ( |
Start time | The start time and day of the application. |
Duration | Total time taken by the application. |
Read | Total data written by the app. |
Write | Total data written by the app. |
Instance | Name of the Databrick Instance Id. |
Workspace | Name of the Workspace. |
Cluster Name | Name of the Databricks cluster. |
Cluster Type | Type of the Databricks cluster. (Interactive, Automative). |
Cost | An estimated cost incurred in running the app. This cost is calculated based on VM and DBU price. |
Job ID | ID that is unique across a workspace. |
Job Name | Job's run name. |
Run ID | The run number and is unique across a workspace. |
Go To | Links to access more details of a specific job. |
Note
See Common UI Features or general information and common features about Unravel's UI.
Filtering Applications
You can filter apps by:
Selecting a date and time range of the apps to display using the date picker above the table.
Using the pagination boxes, to the right above and below the table, to view the pages.
The left sidebar lets you filter the apps by:
App Name: Apps containing or matching the string are displayed,
Status: Status of the app, success, failed, or killed.
Tags: The following tags are always available. Click the checkbox next to the tag and then click in the text box for the valid values. You may select none to all the options available.
ClusterId
ClusterName
Creator
Databricks/Environment
Any user specific tags are also listed, for example, project.
Workspace: Click in the text box for a list of valid values. Click the value to select it.
User: Click in the text box for a list of valid values. Click the value to select it.
Databricks Instance: Click in the text box for a list of valid values. Click the value to select it.
Duration: You can use the slider to set the range, or enter it directly in the from and to text boxes.
Number of Events: The range of events is shown, for instance, 0-4. You can select a range by using the slider to specify the upper and lower bounds.
You can click anywhere within a specific row to bring up the Application Performance Management (APM) page.
Job Runs
The Job Runs tab provides details about the job execution within different applications.
The details of a job run is listed in the following columns:
Columns | Description |
|---|---|
Status | App status. |
User | Name of the user who has run the job. |
Job Name | Name of the job. |
Notification Column ( | A fine-tuning ( |
Job ID | Unique ID of the job. |
Run ID | Unique ID of the run across a workspace. |
Start time | The start time and day of the application. |
Setup Duration | Time period required to set up the cluster. |
Duration | Total time taken by the application. |
Instance | Name of the Databrick Instance Id. |
Workspace | Name of the Workspace. |
Cluster Name | Name of the Databricks cluster. |
Cluster Type | Type of the Databricks cluster. (Interactive, Automative). |
Job Name | Job's run name. |
Go To | Links to access more details of a specific job. |
Note
See Common UI Features or general information and common features about Unravel's UI.
Filtering Job Runs
You can filter the job runs using any of the following options:
Date and Time: Select a date and time range of the apps using the date picker above the table.
Filtering options: You can filter the applications using any of the following filtering options on the left panel:
App Name: Specify the name of the application and the applications matching the string are listed.
Status: Select any of the following status and the applications matching the status are displayed:
Success
Failed
Killed
Running
Waiting
Pending
Unknown
Tags: Select a tag and then click in the text box and choose a valid value, the corresponding applications are displayed. You may select none to all the options available.
Workspace: Click in the text box and then select a workspace from the drop-down. The corresponding applications are displayed.
User: Click in the text box and select a user. The corresponding applications are displayed.
Databricks Instance: Click in the text box and select a Databricks instance. The corresponding applications are displayed.
Duration: You can use the slider to set the range, or enter it directly in the from and to text boxes. The applications matching the duration are displayed.
Number of Events: The range of events is shown, for instance, 0-4. You can select a range by using the slider to specify the upper and lower bounds. The applications matching the number of events are displayed.
You can click anywhere within a specific row to bring up the Application Performance Management (APM) page.
Jobs
This tab lists all the jobs, with a trend line showing its runs.
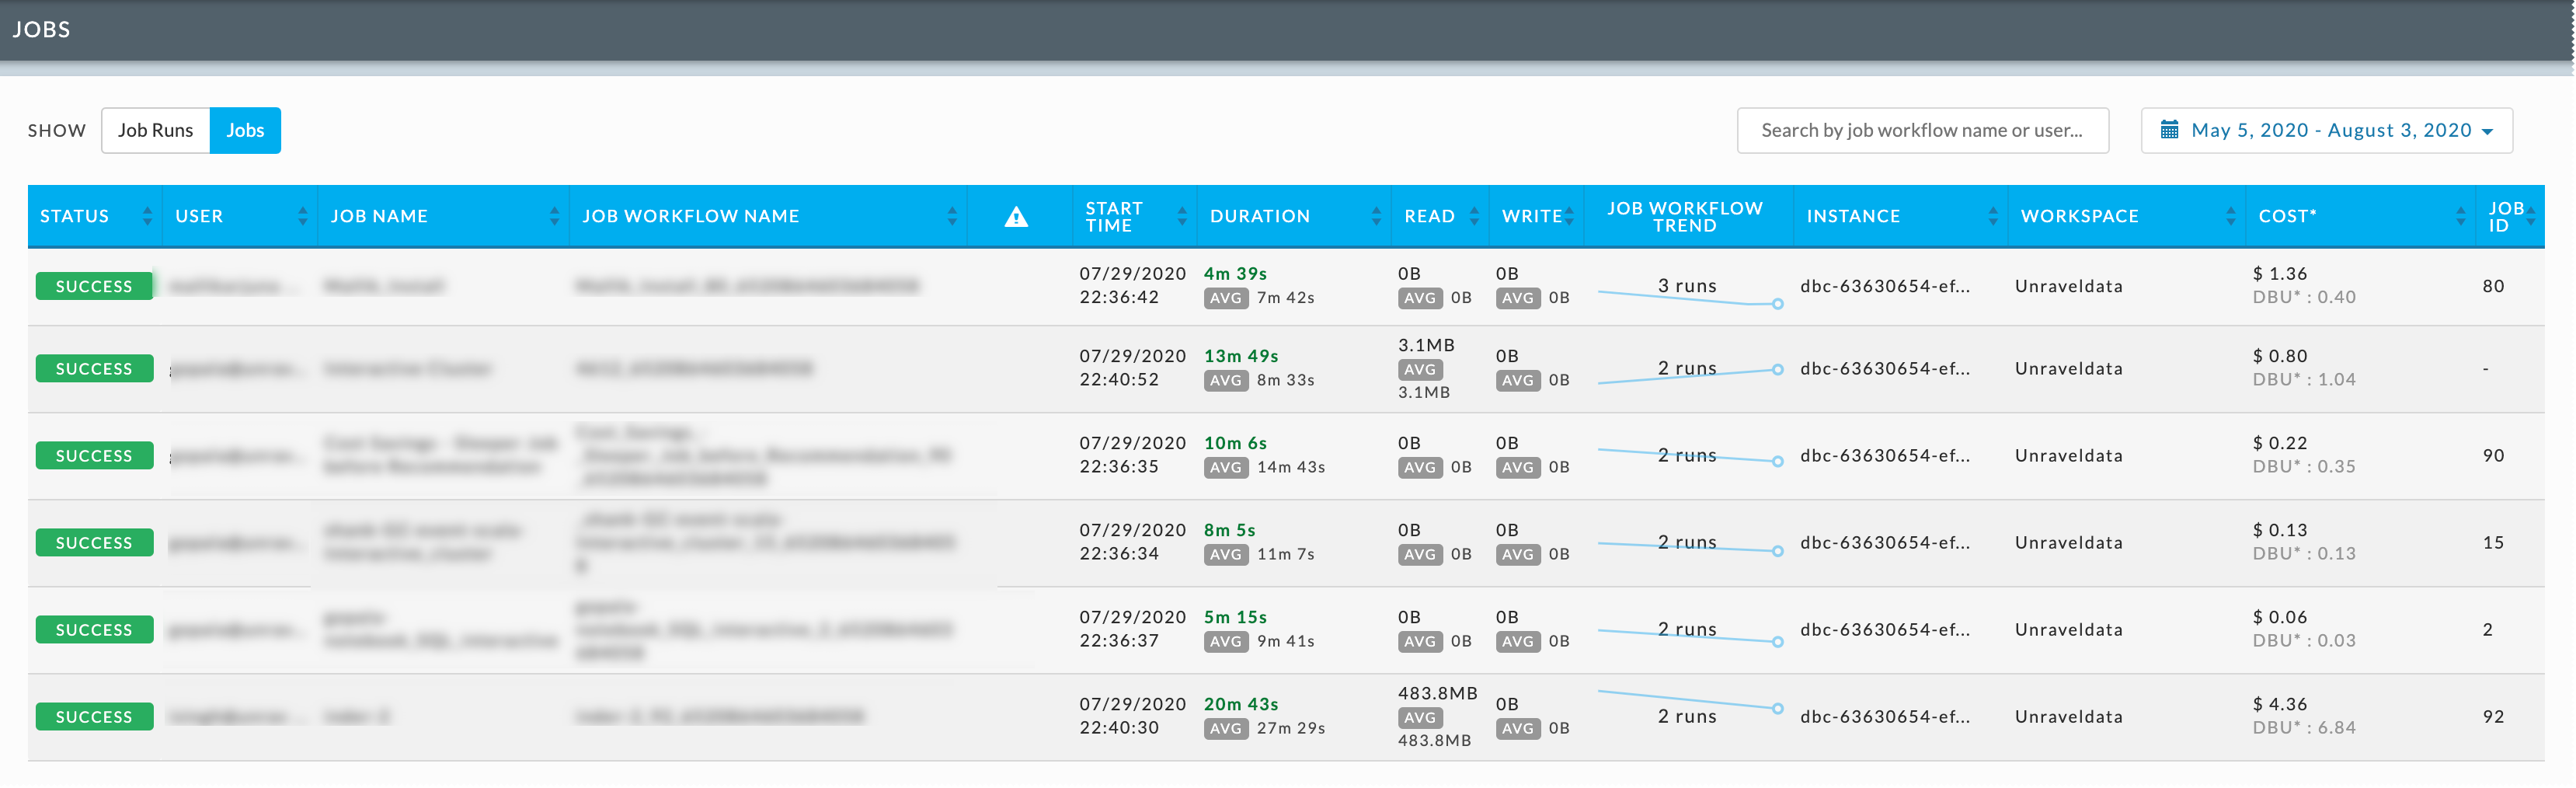
The columns are:
Status: App status.
User: Name of the user who submitted the app.
Job Name: Job's run name.
Job Workflow Name: This is the app name/Id
Notification Column (
 ): A fine-tuning (
 ) indicates Unravel has tuning recommendations for the app.
Start Time: Start time, day, and time.
Duration: Total time taken by the app, with the average duration across all the workflows.
Read: Total data read by the app, with the average amount read across all the workflows.
Write: Total data written by the app, with the average amount written across all the workflows.
Job Workflow Trend: The trend across all the run of the workflow, the total number of runs is listed across the trend line.
Instance: Name of the Databricks Instance Id.
Workspace: Workspace name.
Cost: An estimated cost incurred in running the app. This cost is calculated based on VM and DBU price.
Job Id: Id that is unique across a workspace.