Tez APM
The Tez APM provides a detailed view into the behavior of Hive queries as a DAG (Directed Acyclic Graph).
 To troubleshoot Tez data collection issues, check
 /usr/local/unravel/logs/unravel_ew_1.log.
Key performance indicators
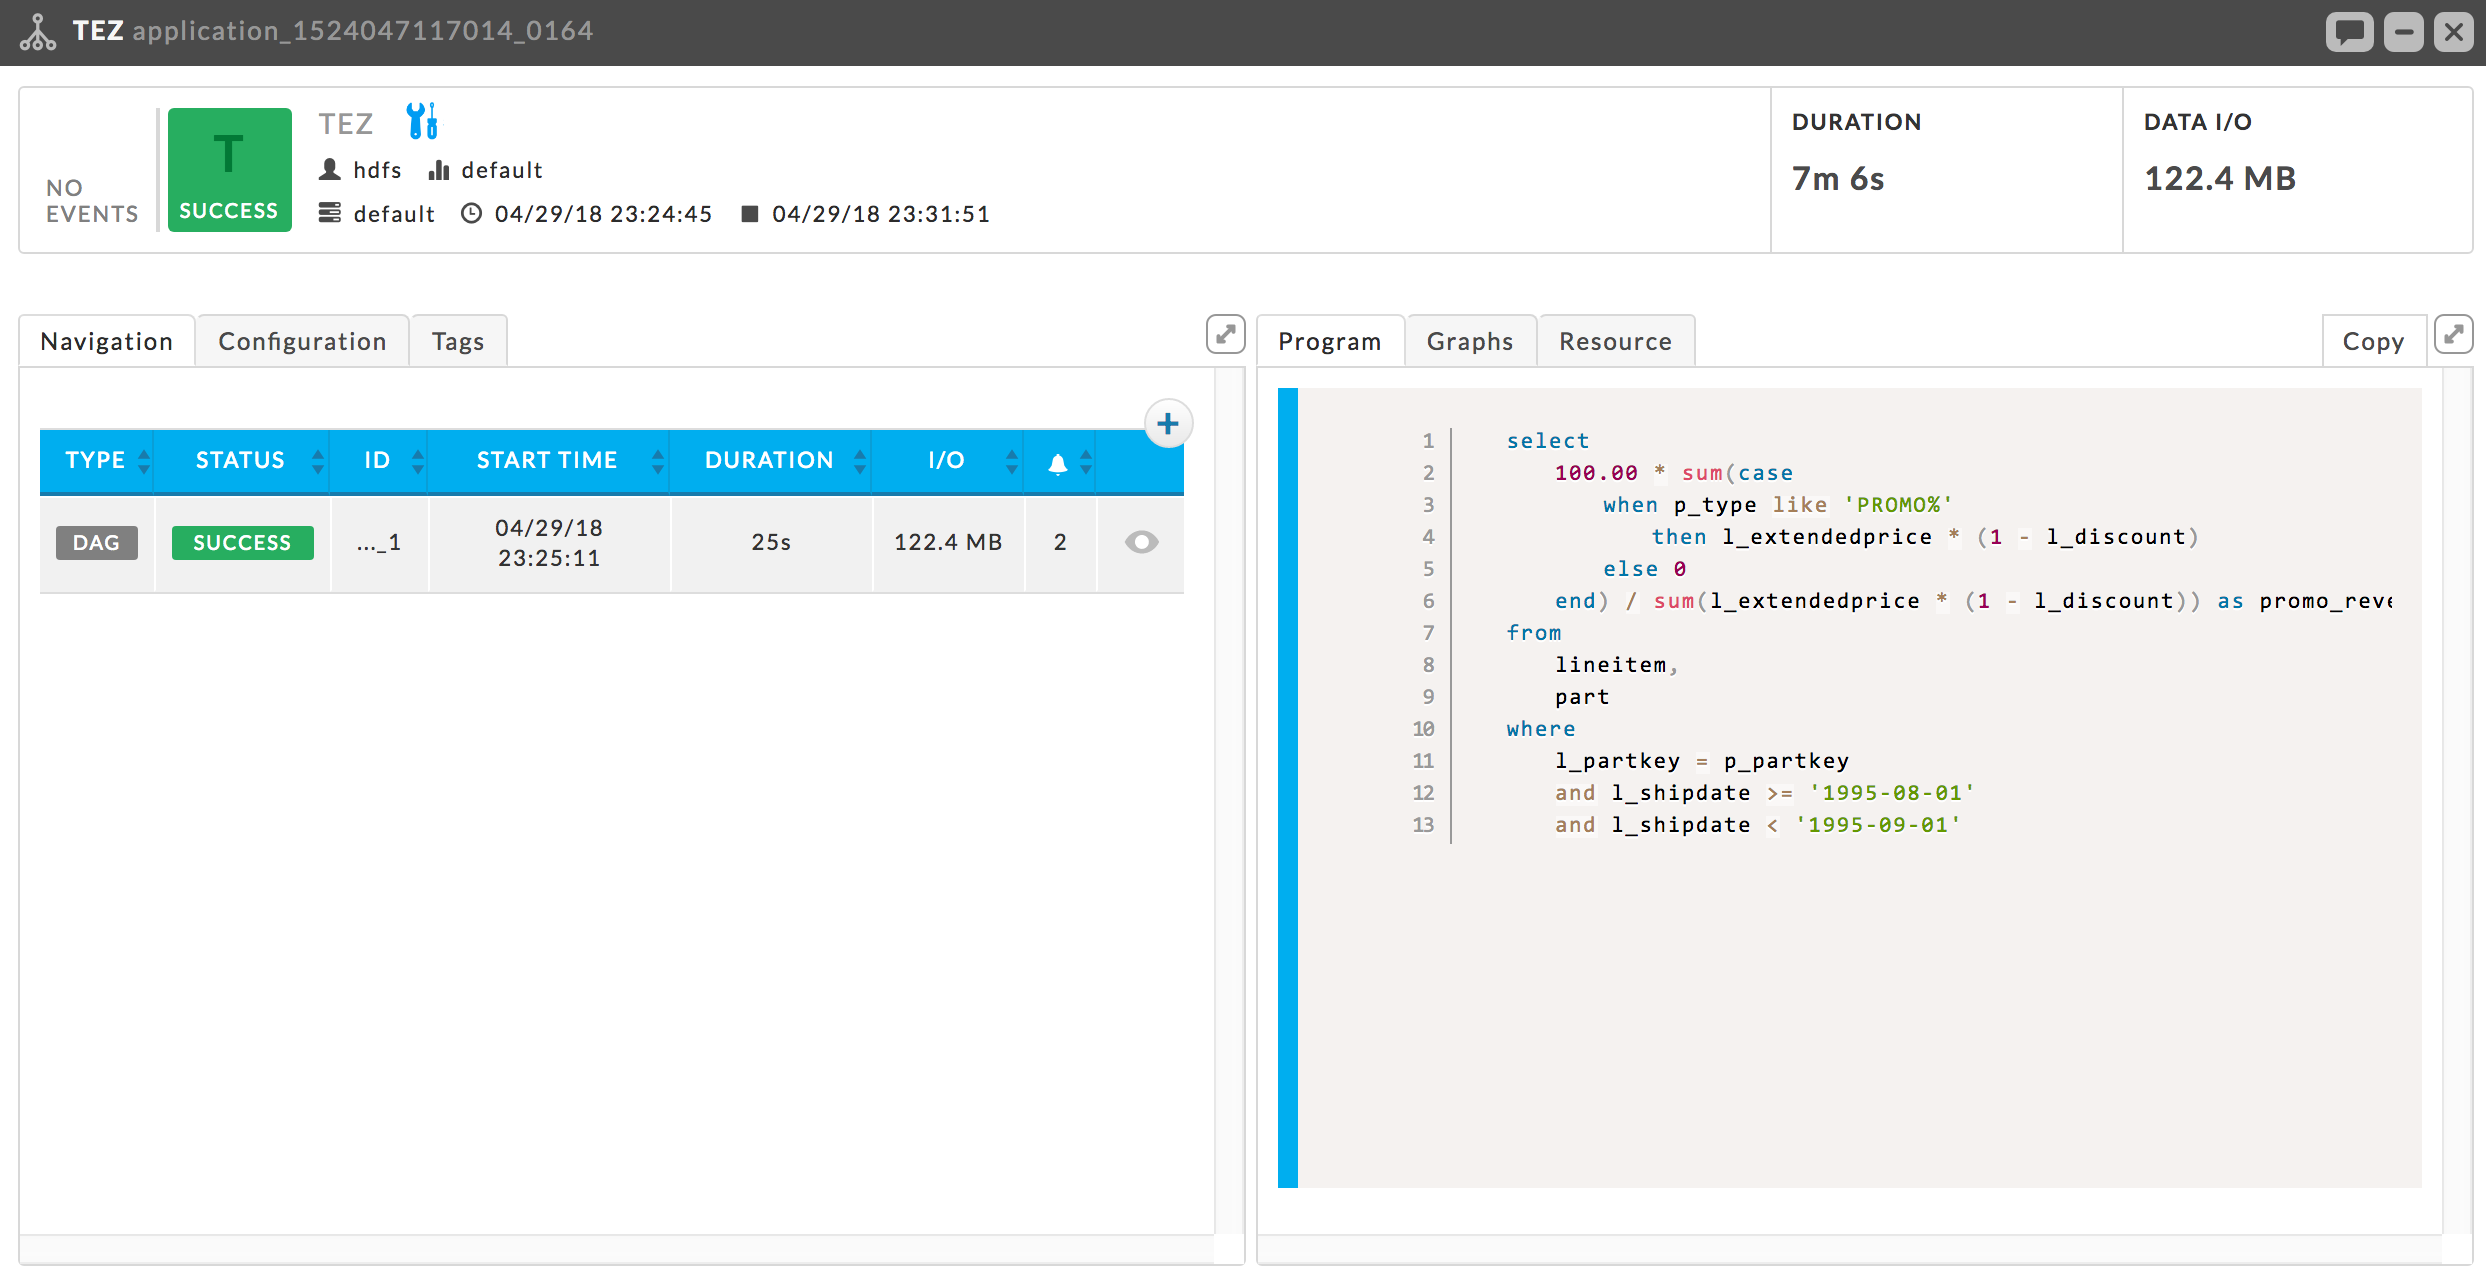
Events: The number, if any, of Unravel insights for this query. See Event Panel & Insights for more information.
Duration: Total time taken by the query.
Data I/O: Total data read and written by the query.
By default the Tez APM opens showing the Navigation and Program Tabs.
Left tabs
Navigation: Lists the DAG jobs with KPIs, Duration and I/O.
Configuration: List the configuration parameters and their values.
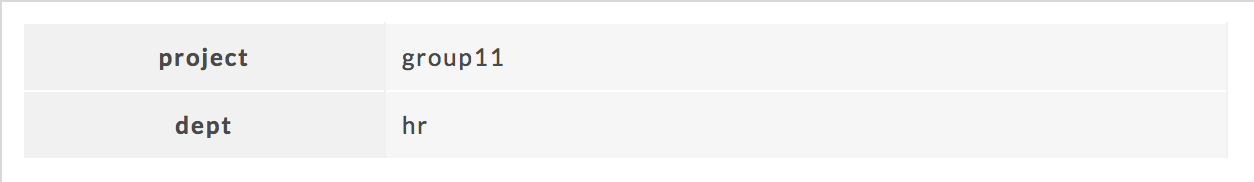
Tags: The defined tag keys and values for the app. This example has two tag keys, project and dept with each having one value, group11 and hr respectively.
Right tabs
Program: Displays the query.
Graphs: This tab is only displayed when there is available data. If a graph has less than four data points, it is converted to a bar graph. The graphs use wall clock time as opposed to computer usage time.
Unravel gather this data from the Resource Manager which it polls every 90 seconds while the app is running. If the app has a runtime less than 90 seconds there is likely no data.
It has three subtabs:
Running Containers: The number of running containers.
vCores: Allocated vCores.
Memory: Allocated memory.
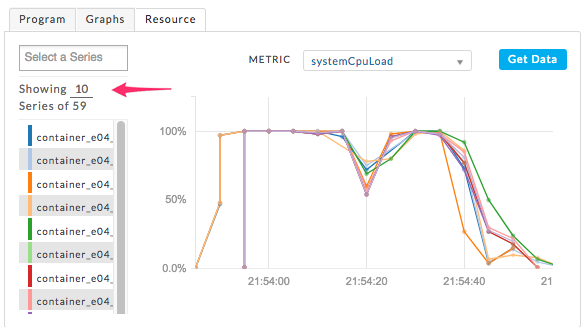
Resource: Graphs the resources the app consumed. Unravel gathers this data from the Resource Manager which is polled every 90 seconds while the app is running. If the app's runtime is less than 90 seconds there is likely to be no data collected.
When no resource data is available the tab display “No metrics found. Metrics are displayed after Unravel has processed the app completely and Unravel's application sensors are enabled.”
The tab opens displaying the first 10 series using the systemCpuLoad metric. You can select one or more series to display in the Select Box. You can change the default number of series to show (1-n). Clicking on a series name causes the graph to display that series alone. You choose the Metric to graph from the pull down menu. Click Get Data to retrieve the data for that metric, it can be viewed in its Raw form, JSON, or headers.
DAG detail
The DAG detail has six tabs:
Query: Displays the query.
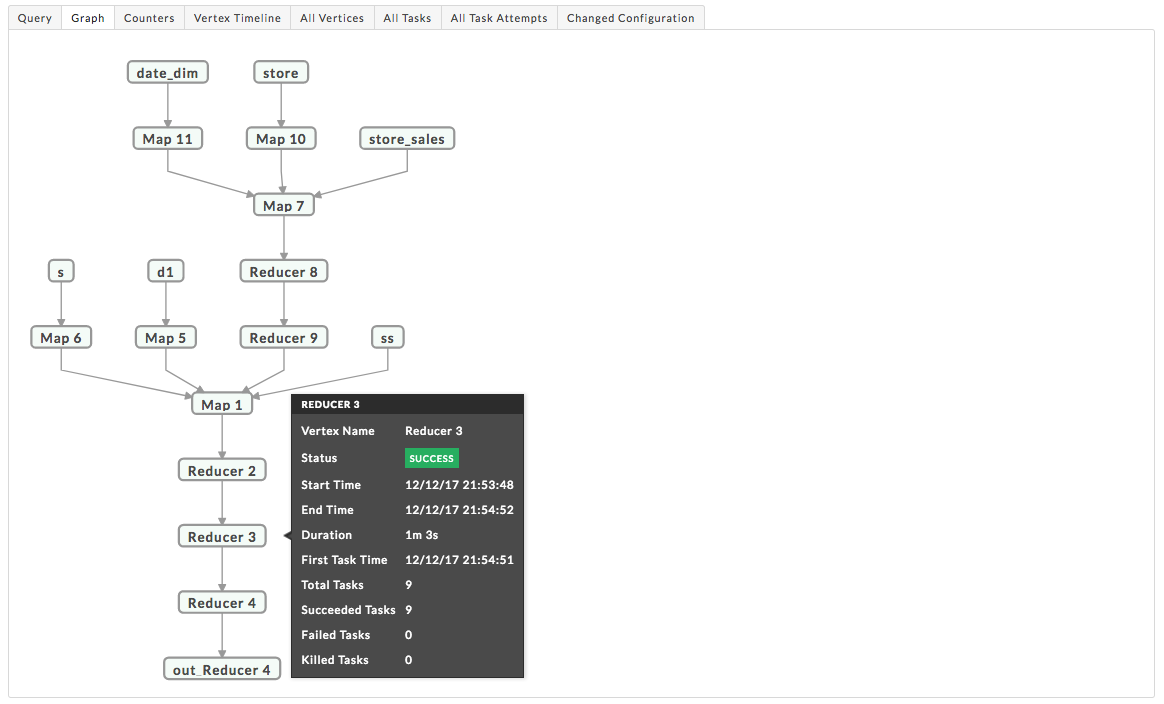
Graph: Displays the vertices and their relationship to each other. Clicking on a node brings up the task details.
Counter: Lists all the relevant counters for the Tez-DAG and their values.
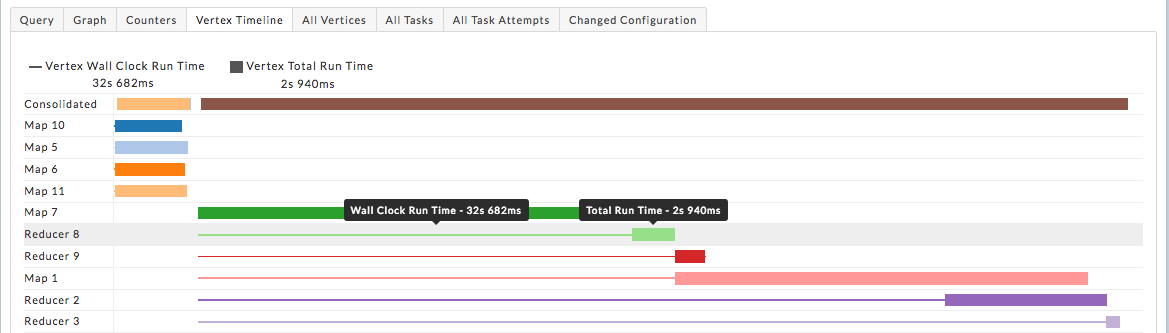
Vertex Timeline: Displays the timeline for all tasks. The task time can be displayed in both Wall Clock time and Total Run time as applicable. Hover over the task to display the information in text.
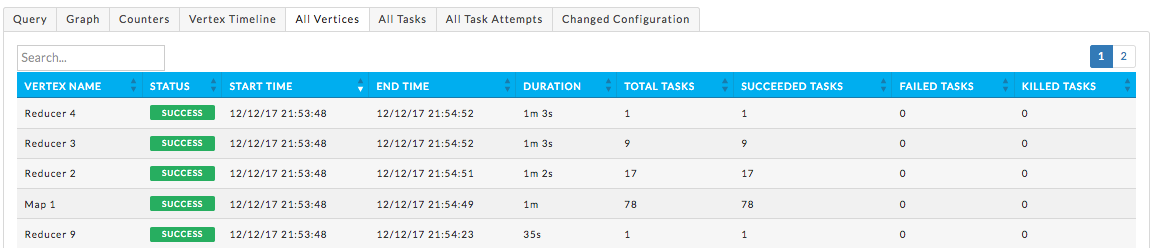
All Vertices: List each vertex and their KPIs. The Vertices are searchable by Vertex Name; vertices containing the string will be displayed.
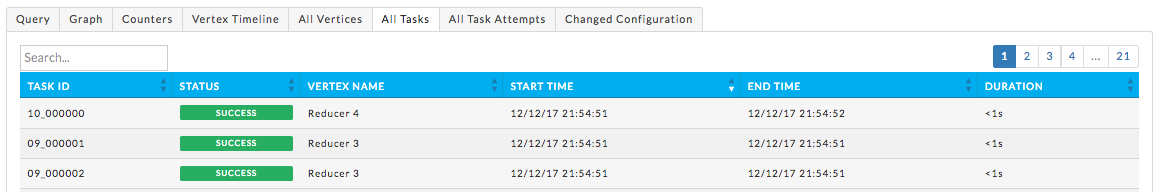
All Task: List all tasks, their status (failed, success, etc.), vertex name and other relevant information. The tasks are searchable by Task ID and Vertex name; Tasks containing the string will be displayed.
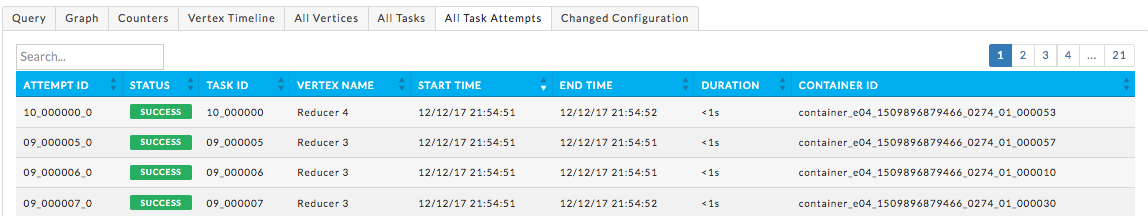
All Task Attempts: List all attempts, their status (failed, success, etc.), vertex name and other relevant information. The task attempts are searchable by Attempt ID, Task ID and Vertex name; Task attempts containing the string will be displayed.
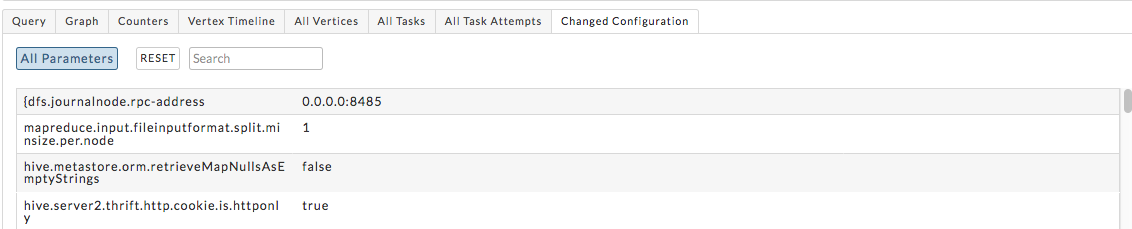
Changed Configuration: Lists all relevant parameters and their value.