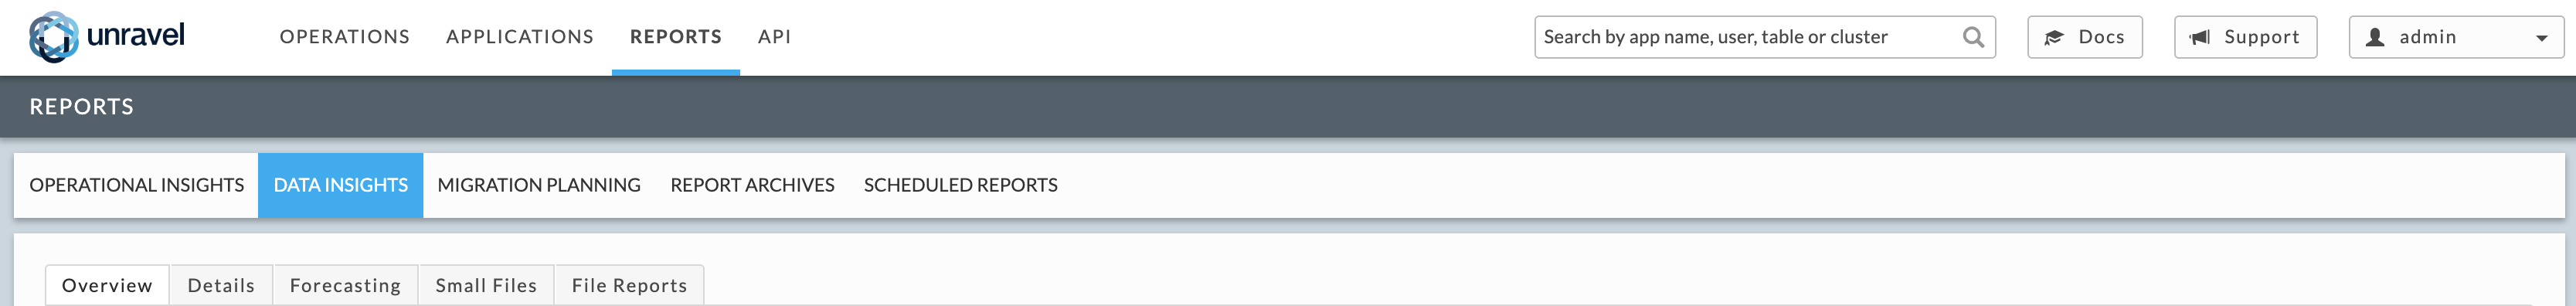
Data insights
Note
You must have MySQL installed as your Unravel DB for this page to be populated, including all the OnDemand reports.
You must install OnDemand package installed to use Forecasting, Small Files, and File Reports
The first two tabs provide data-level insights including a snapshot of tables and partitions over the last 24 hours within a historical context.
Overview gives a quick view of the tables' and partitions' sizes.
Details drills down into the tables.
See Hive Metastore Configuration for information on necessary configuration settings to populate these tabs. Tables and partitions have color-coded labels when applicable: Hot ( ), Warm ( ), Warm ( ), or Cold ( ), or Cold ( ). The label definitions are defined via the Configuration. ). The label definitions are defined via the Configuration. |
The last four provide disk management insights to help you manage your disk usage both in terms of capacity and cluster performance.
Forecasting - forecasts future disk capacity requirements based upon past performance.
Small Files - generates a list of small files based upon specified criteria.
File Reports - similar to Small Files, except canned reports for large, medium, tiny, and empty files.
Note
See Common UI Features for general information and common features about Unravel's UI.
Overview
The Overview Dashboard gives a quick view of the tables' and partitions' sizes, usage, and KPIs. It has two sections.
Table KPI
Partition
The time period used to populate the page is shown in the upper right-hand corner and the tooltips.
Tables & partitions tiles
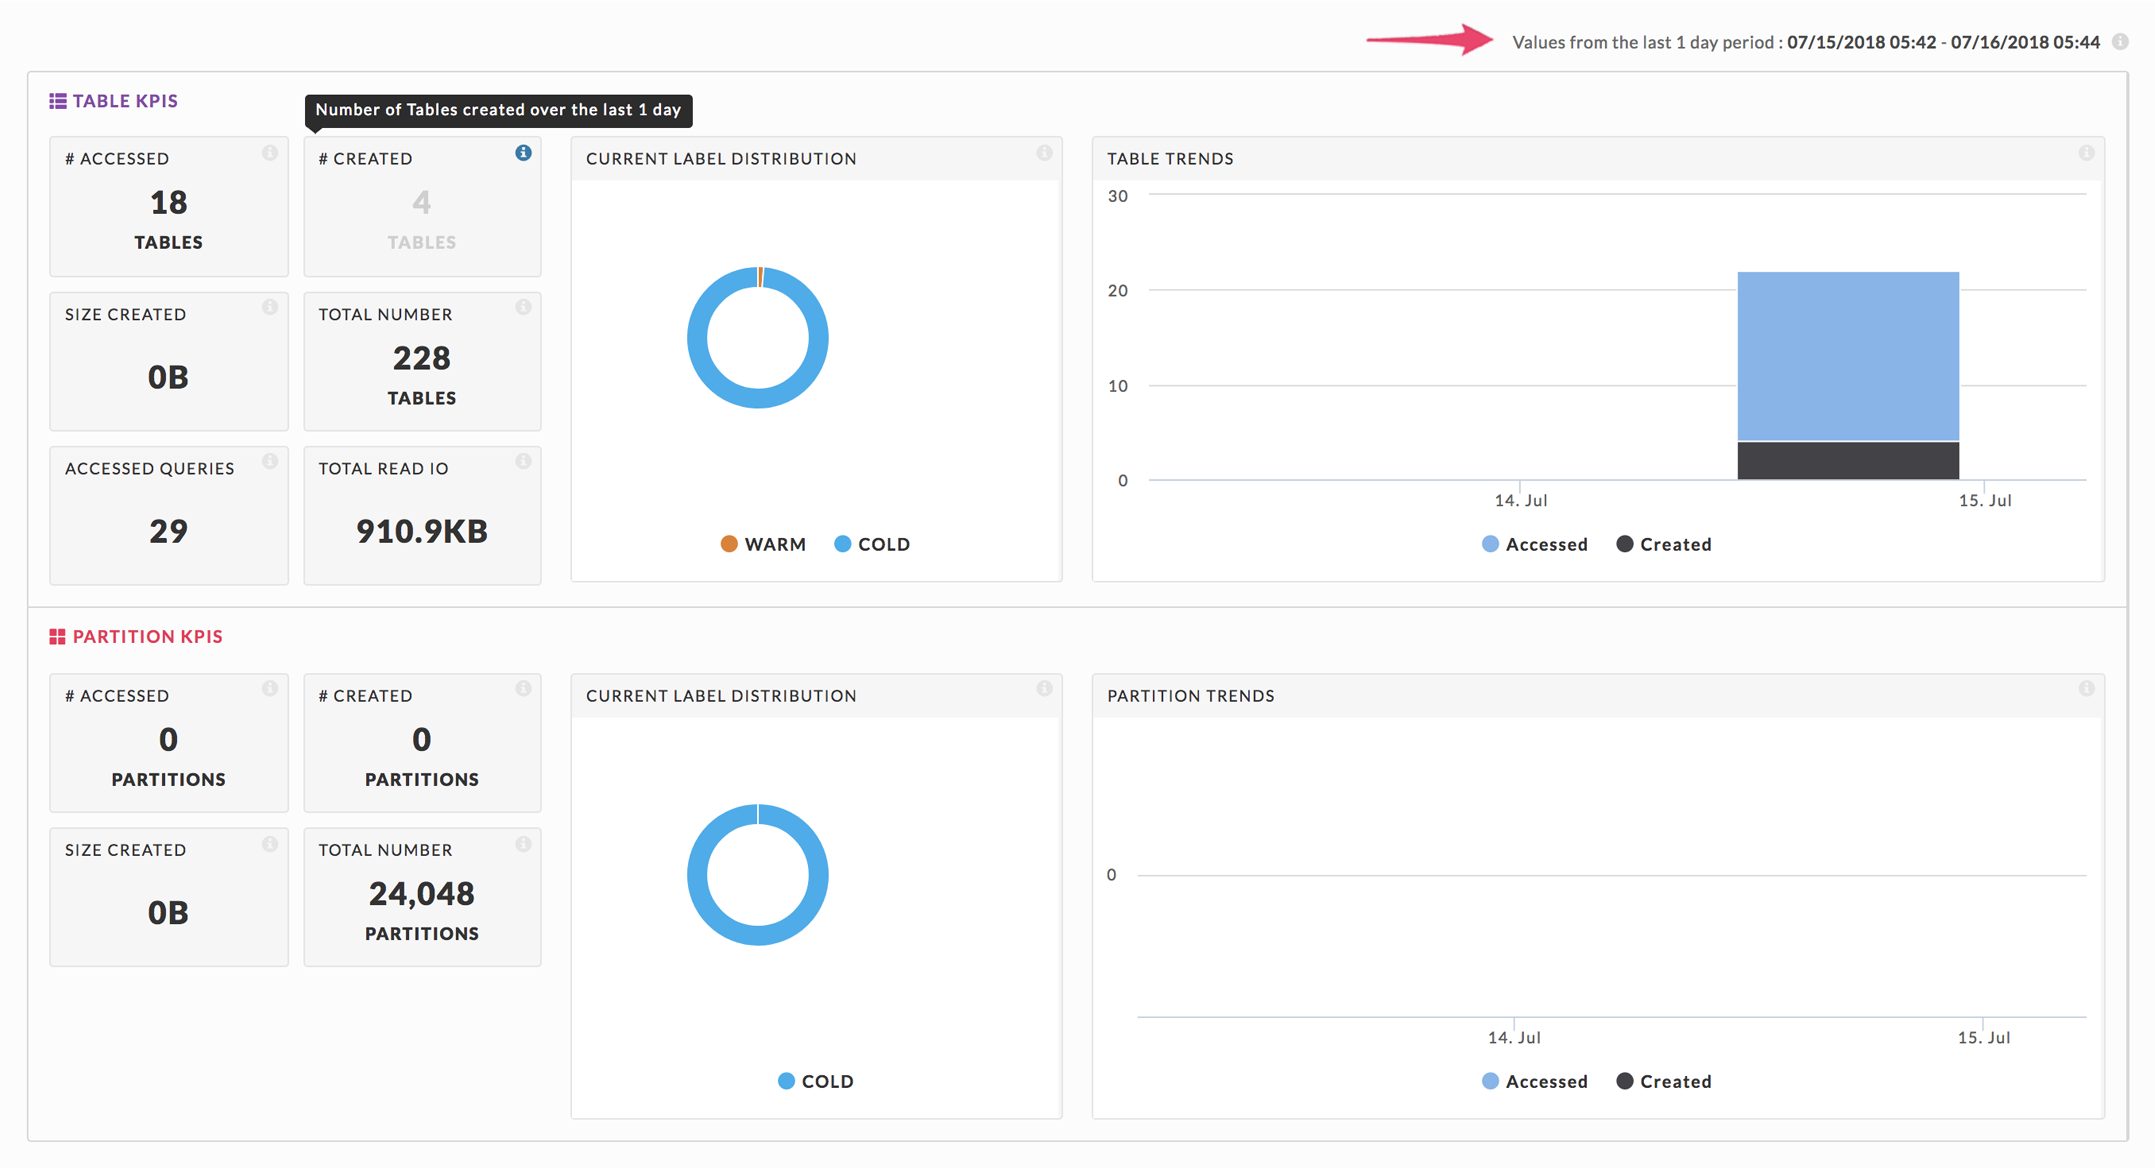
Both Table and Partition KPIs sections contain:
# Accessed: Number of Tables/Partitions accessed,
# Created: Number of Tables/Partitions created,
Size Created: Size of Tables/Partitions created, and
Total Number: Total Number of Tables/Partitions currently in the system.
The Table KPIs also include:
Accessed Queries: Total number of queries accessing the tables, and
Total Read IO: Total Read IO due to accessing the tables.
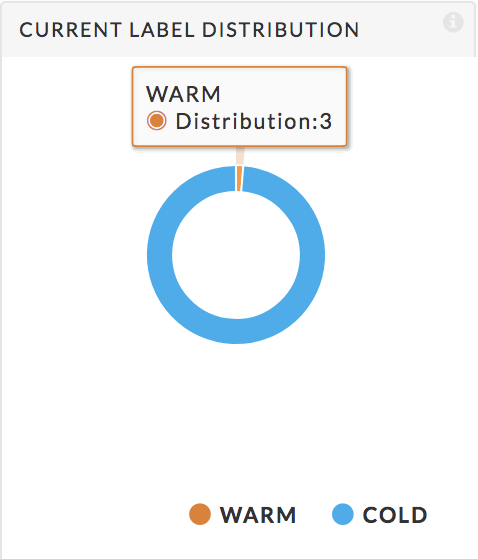
Donut charts
These display the Current Label Distribution for the tables/partitions. See Configuration for the operating definition of the labels. The graph shows the relationship between the labels; hover over a label to see the total of tables/partitions with that label. Below we see that three tables are warm.
 |
Details
The details tab has two sections, a graph, and a table list. By default, the graph uses the Total Users metric and displays the first table in the list. The list is sorted on Total Users in descending order. You can also use the metrics Total Users, Total Apps, or Total Size to display the graph. The Total Apps metric (corresponding Apps column in the table) is the total number of Hive and Impala queries on the table.
Graph
Use the Metric pull-down menu (1) to select Total Users, Total Apps, or Total Size as the metric to chart. Click Reset Graph (1) to revert to displaying the first table using the Total Users metric. The menu bars allow you to print or download the graph. You can select one or more tables to chart by selecting box (2), next to the table's name. You can select tables over multiple pages, in the image below shows five tables yet only three have been checked on the page showing. The other two tables were selected from other pages.
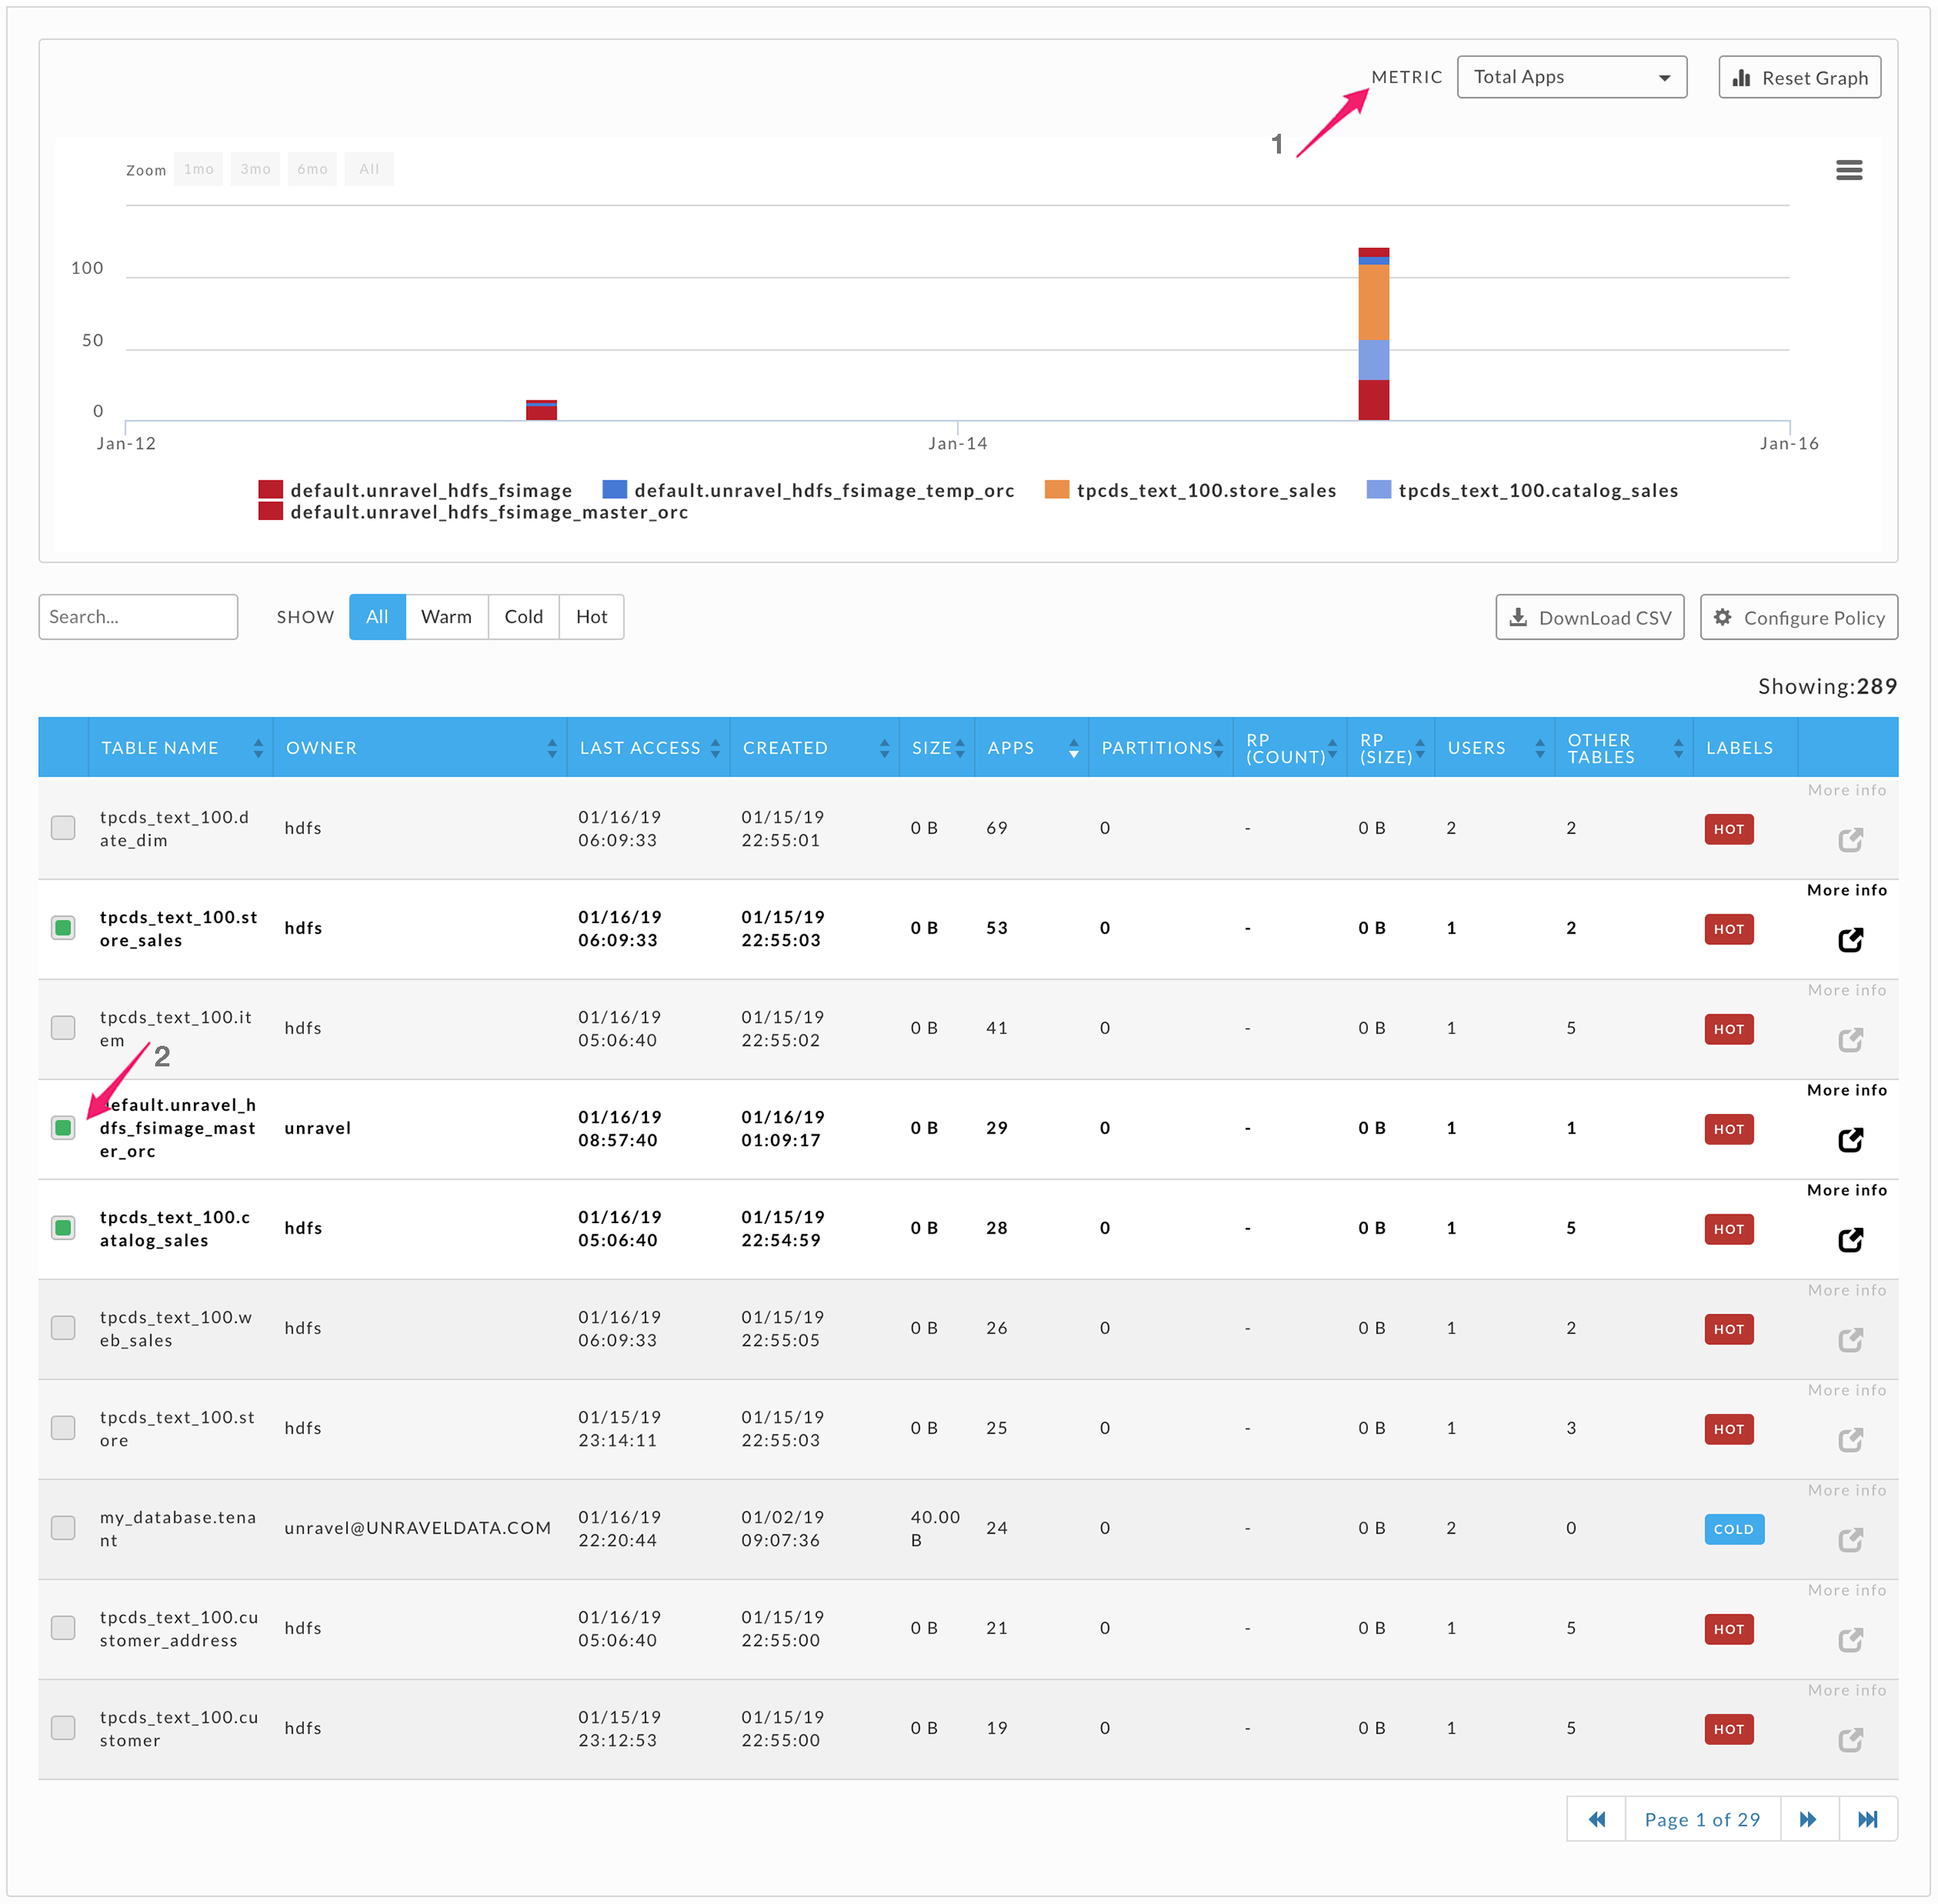
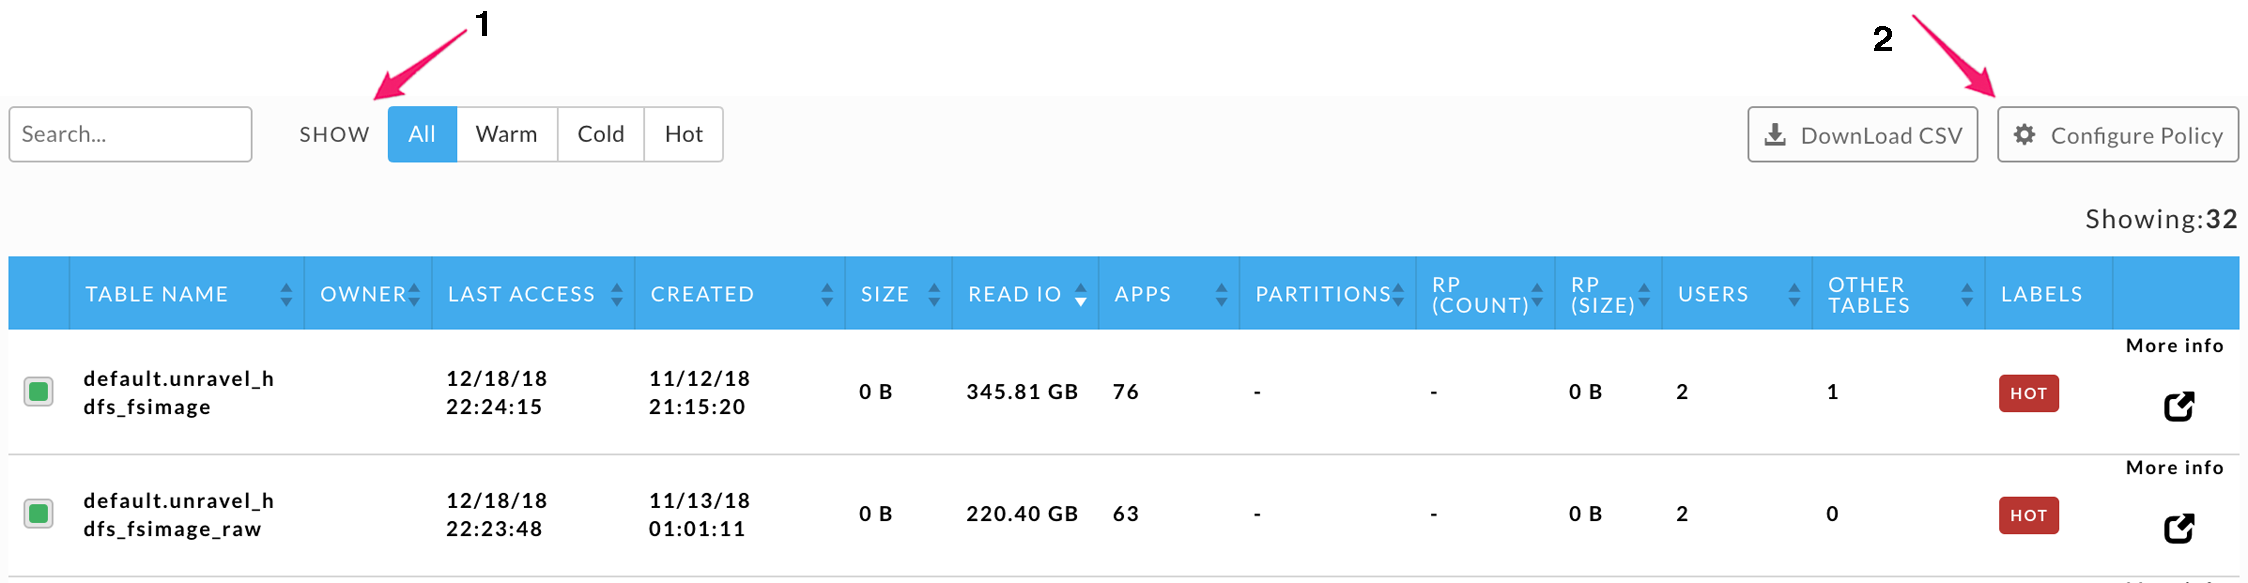
You can Search by string; any table matching or containing the specified name/string is displayed. Use Show (1) to specify the label type to use for displaying the tables. All is selected below, so every table is shown. You can sort the list by the various metrics in ascending or descending order. By default, the list is sorted on Read IO in descending order. If you have selected a table, the More Info glyph is available. Click it to display the Table Detail pane. Click Configure Policy (2) to edit the label rules or Download CSV to download the table (2).
This view
Summarizes table usage and access metric.
Lets you to browse trends (KPIs).
Drill down into applications that used the table.
Lists both Hive and Impala queries.
The first table in the list above is used for the examples below.
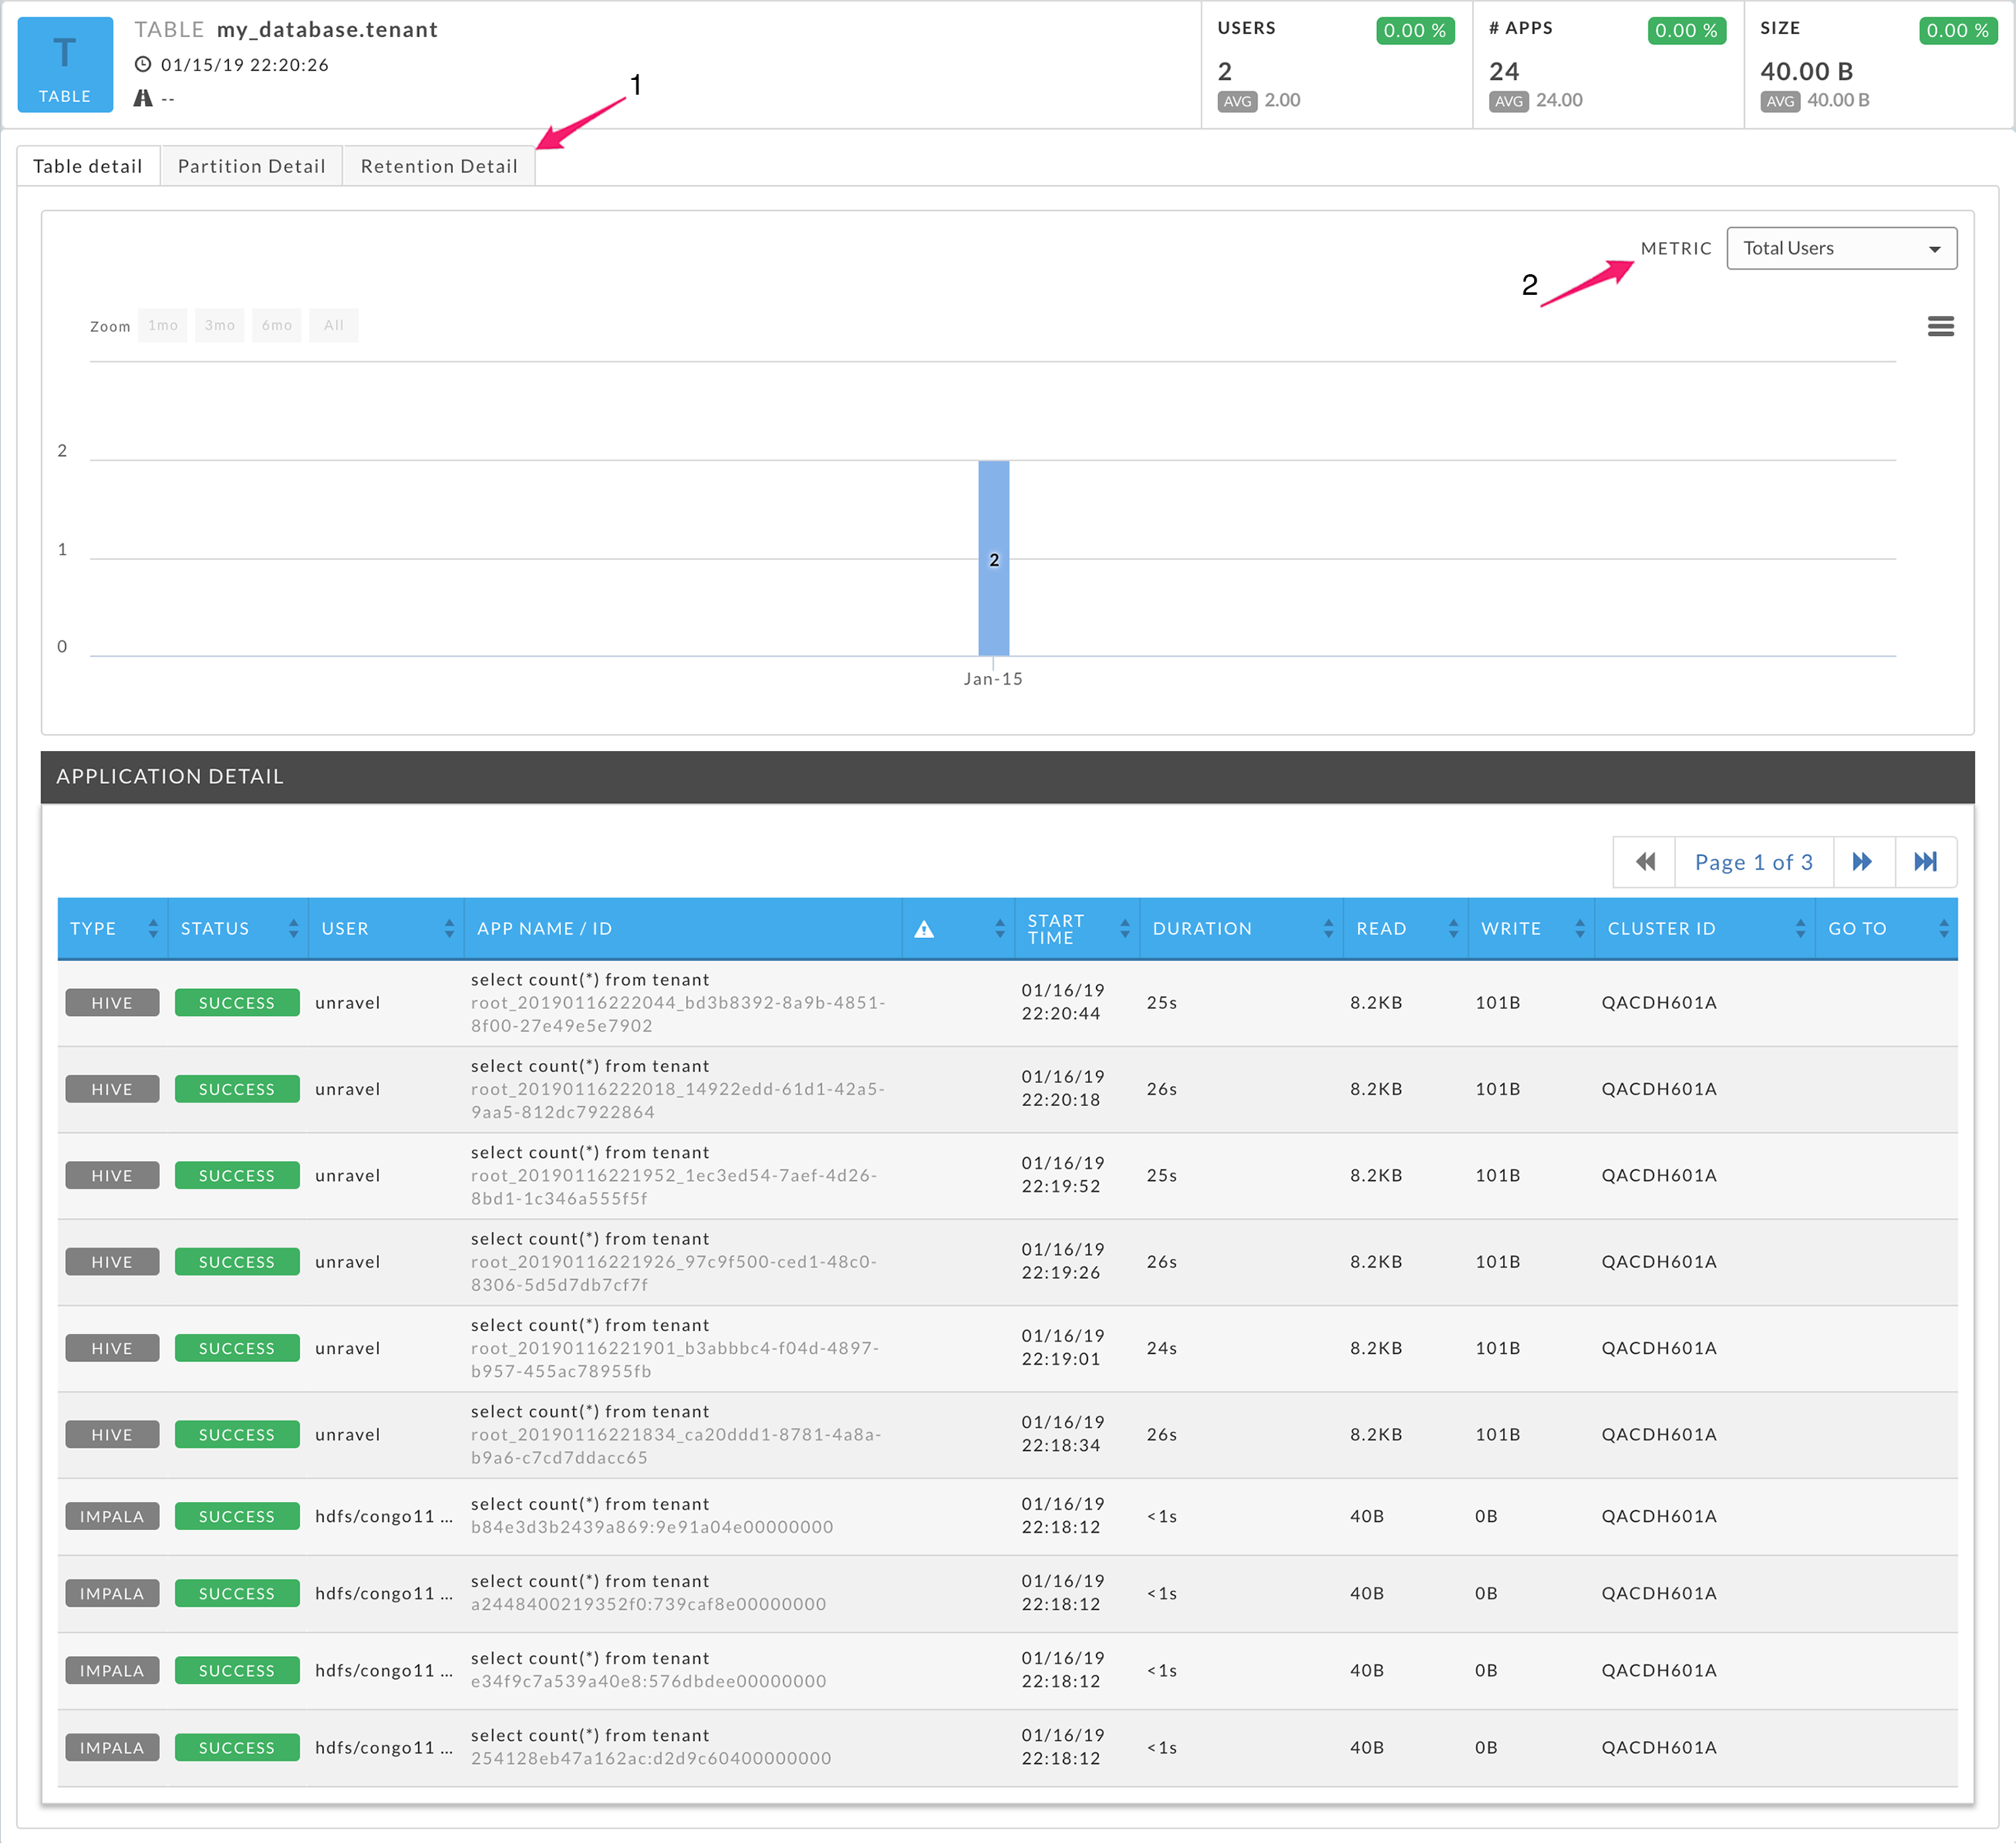
The panel's top row lists the table name, start date/time, and the name/path. Hover over the name/path to display the complete path. Three KPIs are displayed: Users, # Apps, and Size.
There are three tabs, Table Detail, Partition Detail, and Retention Detail (1); the default view is the Table Detail. Use the Metric (2) pull-down menu to select Total Users, Total Apps, or Total Size as the metric to chart. The Application Detail lists the applications that accessed the table in the given time range. See the Application Tab section for detailed information on its format. Below the table shows both Hive and Impala queries.
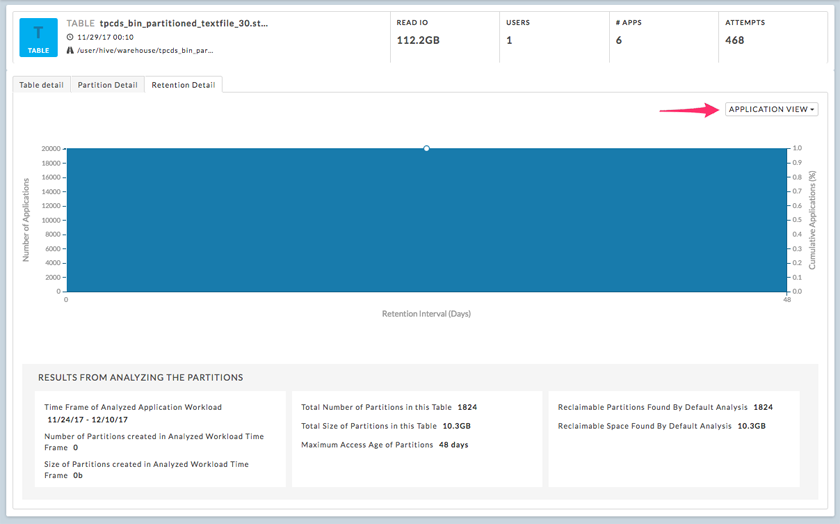
Click the Partition Detail tab for partition information.
The top left of the tab notes the number of partitions loaded, the displayed partition's name, and the view type (Partition Size or MR jobs).
By default, the 100 latest partitions are loaded with the first partition listed graphed in the Partition Size view (1). To load all the partitions click Load All Partitions (2). To switch to the MR Jobs view click MR Jobs (2).
Chose the partition to chart by selecting the checkbox to the left of the partition's name. Hovering over the partition name displays the complete name/path. The partition list can be sorted on Last Access date, Created date, Current Size, or Users. Hovering over the Users number brings up the list of user(s) who accessed the partition.
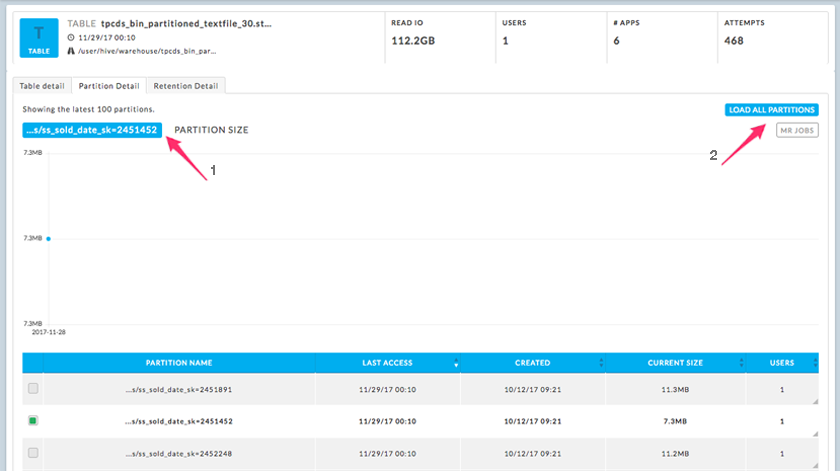
This graph initially displays the number of Applications; the pull-down menu lets you switch to the Partition Access View. Listed below the graph are the results from the partition analysis.
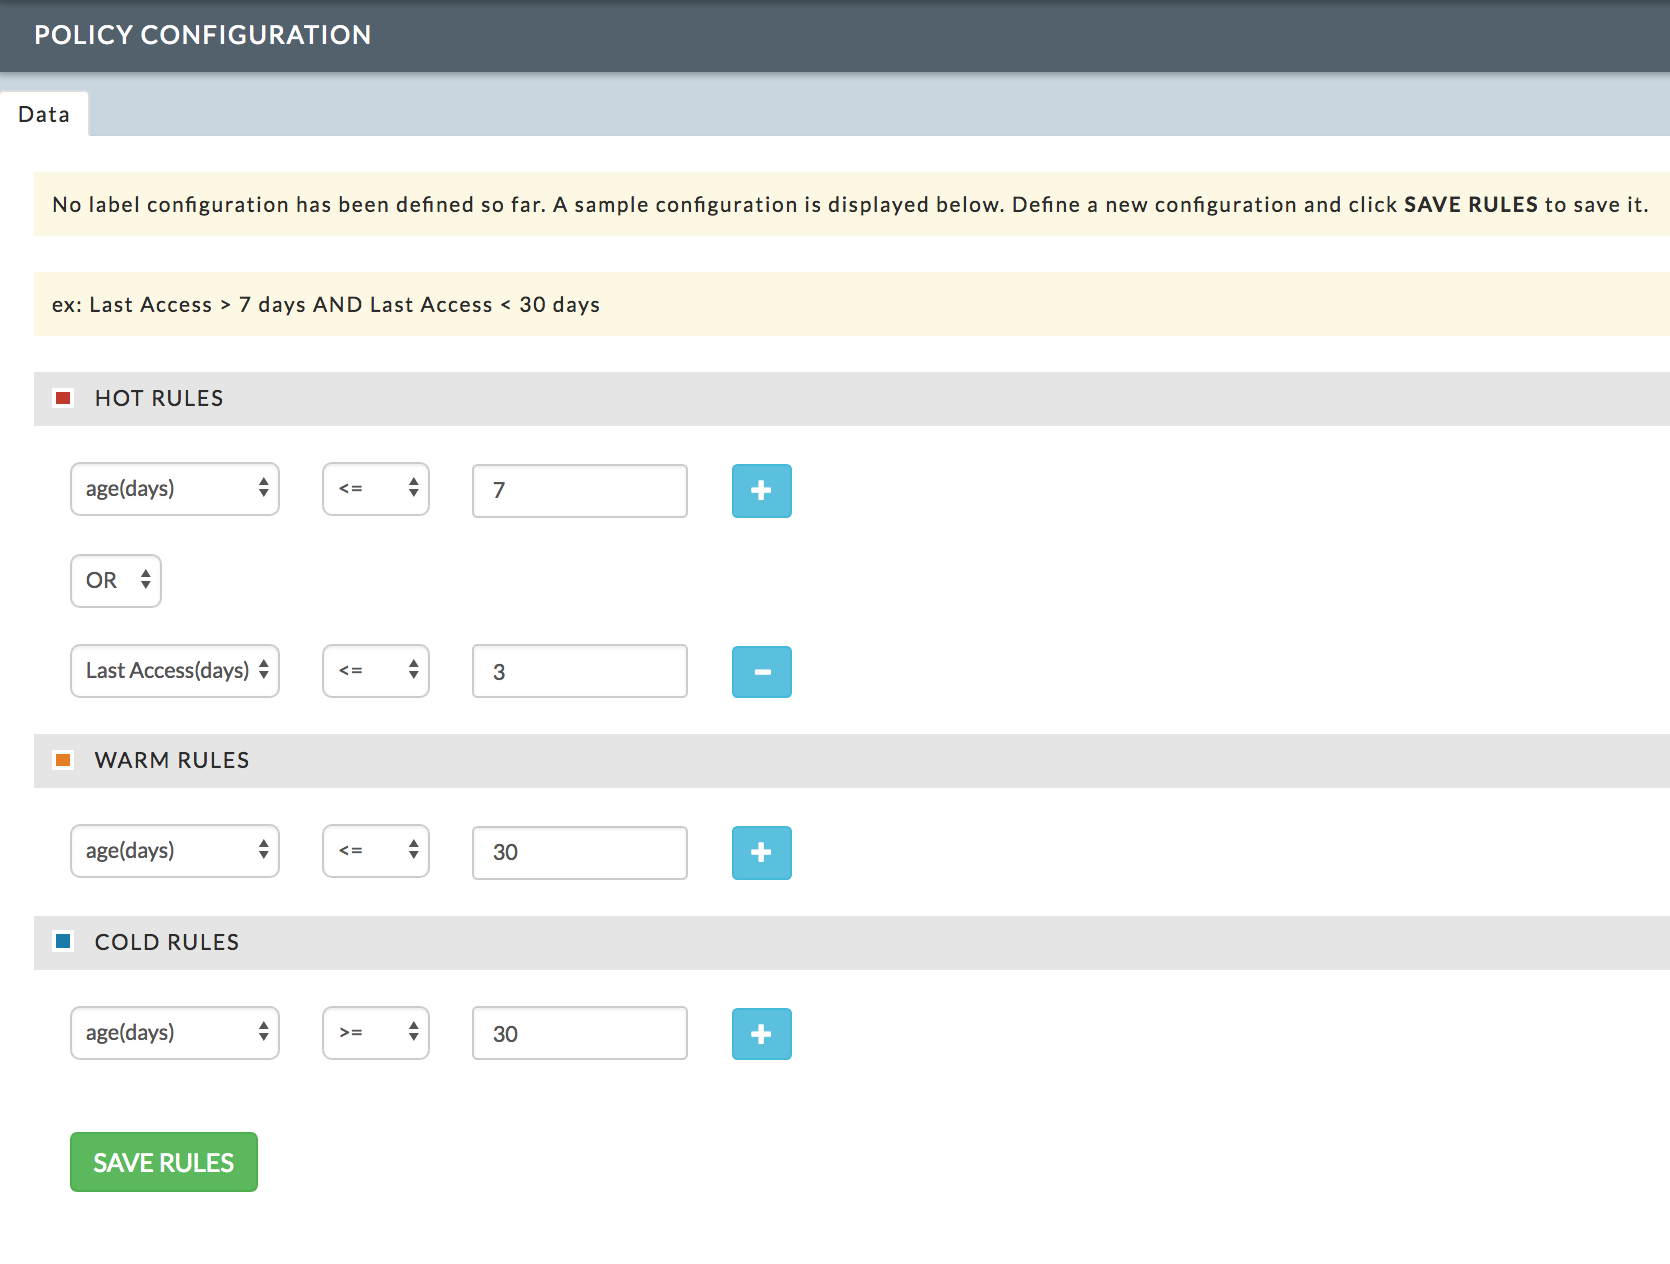
Configuration
You can define the rules for labeling a Table/Partition either Hot, Warm, or Cold. These rules are used for the Donut chart and in the Details tab.
While the labels are immediately associated with the Tables/Partitions, the Overview Dashboard donut charts typically populate within 24 hours.
You access this modal pane from the Data > Details tab. The rules are defined per label and you can define up to two rules per label. To define a rule:
From the pull-down menus:
Chose Age (days) or Last Access (days), and
Chose the comparison operator: <= or >=.
Enter the number of days.
To add a second rule:
Click the Plus glyph,
Select the AND or OR operator from the pull-down menu, and
Repeat steps 1 & 2.
To delete a second rule, click the Minus glyph.
Click Save.
Forecasting
Note
The OnDemand package must be installed to use this report. See here for properties that control this report.
It currently only works on Cloudera (CDH) and Hortonworks (HDP).
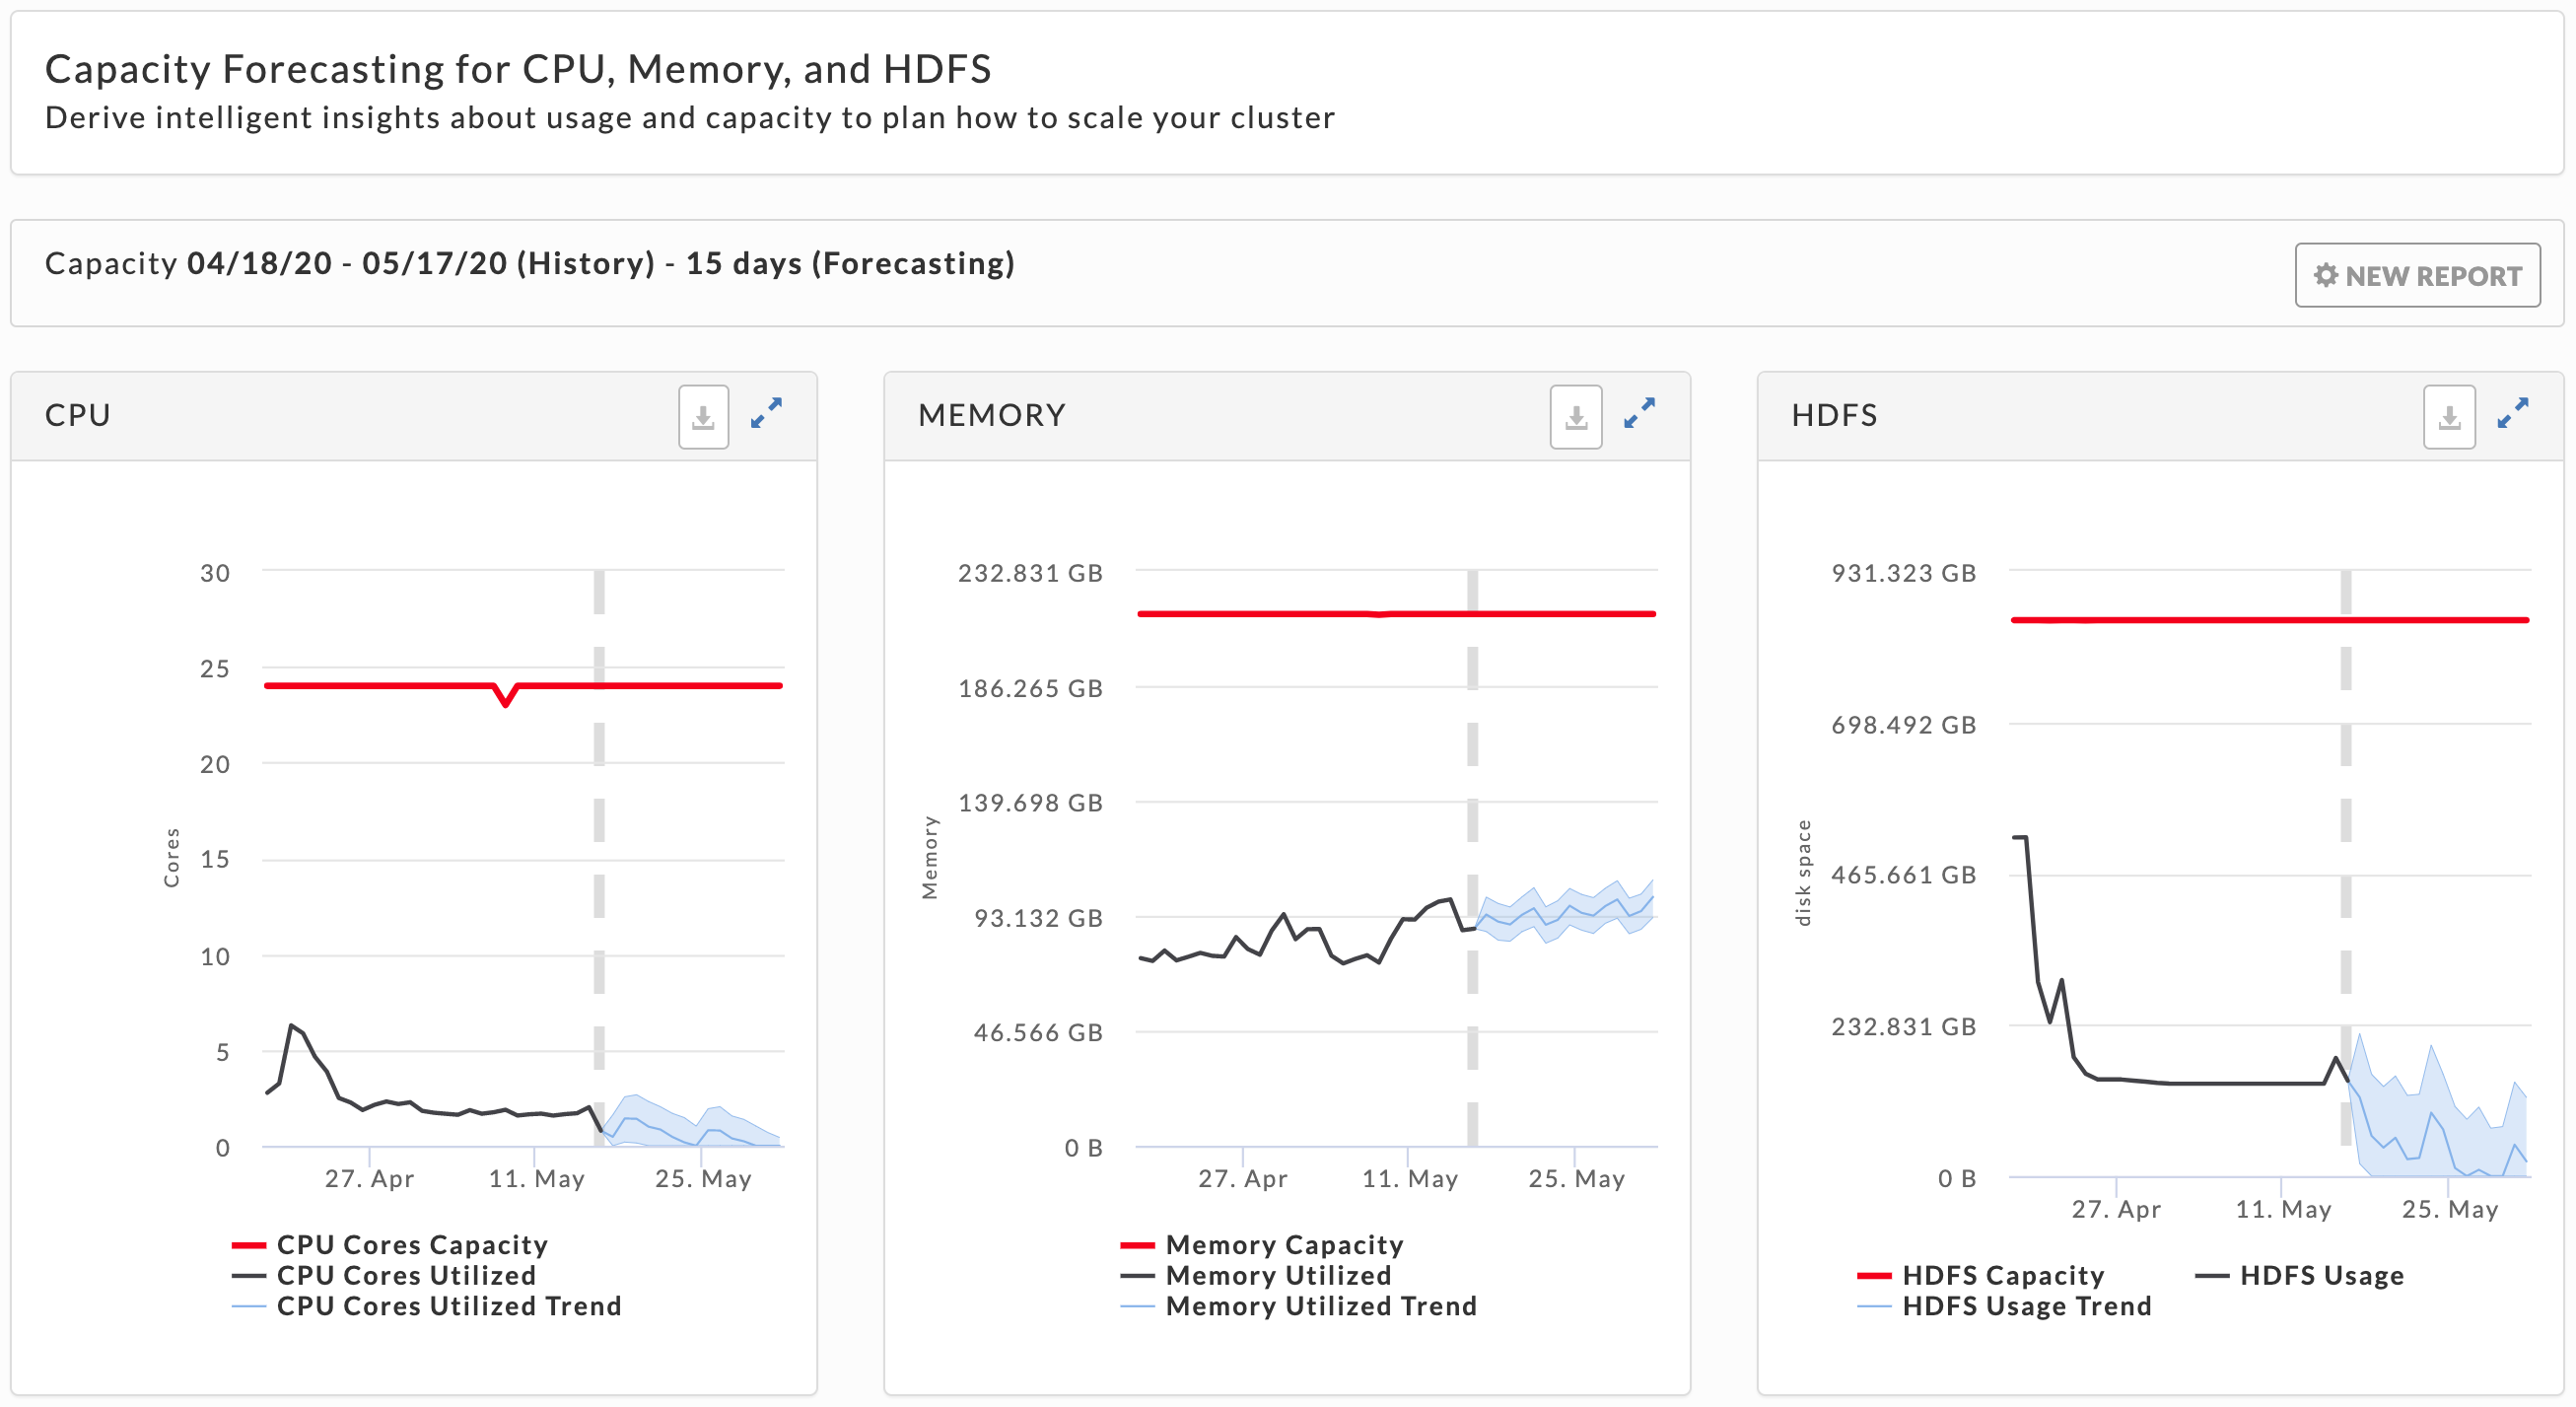
This report helps you monitor CPU , Memory , and HDFS disk capacity usage and plan for future needs. Unravel uses your historical usage to extrapolate capacity trends allowing you to more effectively plan for, and allocate your disk resources. Unravel stores up to two years of data. Each time you generate a report, Unravel stores any new data it generates. This lets you generate reports based upon a larger pool of data for more accurate forecasting. The tab opens displaying the last forecasting report, if any, generated.
These graphs display the trend (blue area) from the historical range start date to the forecast range end date (x-axis). The trend ban shows the upper and lower trend, with the dark blue line indicating the likely trend. The y-axis is determined by your actual physical CPU, memory, and disk capacity. The dotted line separates the historical data from the forecast. Click  to download the graph is CSV format. Click
  to expand all the graphs to full width.
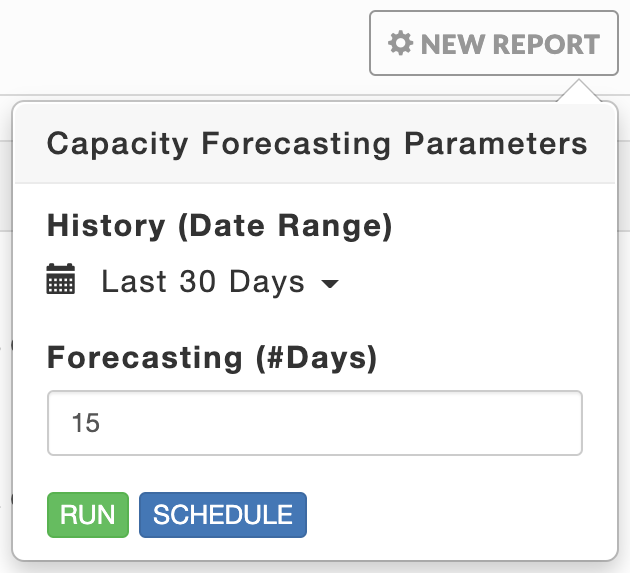
To generate the report use the date picker to set the History (Date Range) and Forecasting (#Days) text box to specify the number of days to forecast. Click Run to generate the report or Schedule to generate it on a regular basis. (See Scheduling Reports .) While Unravel prepares to generate the report Run is replaced with Running and a countdown appears above it. Once Unravel starts the generation the pop-up closes and the New Report button pulsates blue. A light green bar appears when the report was completed successfully and results are displayed. Upon failure, the bar is light red and the New Report button becomes orange. The New Report remains orange until a new report is successfully generated.
All reports, whether scheduled or ad hoc, are archived. Successful reports can be viewed or downloaded from the Report Archives tab.
Small files
Note
The OnDemand package must be installed to be able to use this report. It requires HDFS privileges and currently only works on HDP/CDH. If you can't grant HDFS privileges, you must configure these properties.
Each small file is accessed by a single mapper. Therefore, a large number of small files can lead to a large number of mappers. Mappers are costly to run and drive up your app's costs. This report helps you identify users who create/use an excessive amount of small files.
You can use this information to take corrective action such as:
Combine multiple files into large files.
Notify, limit, or block users who create or use an excessive amount.
Taking action
Corrects and prevents future performance degradation.
Can lower your costs to run apps.
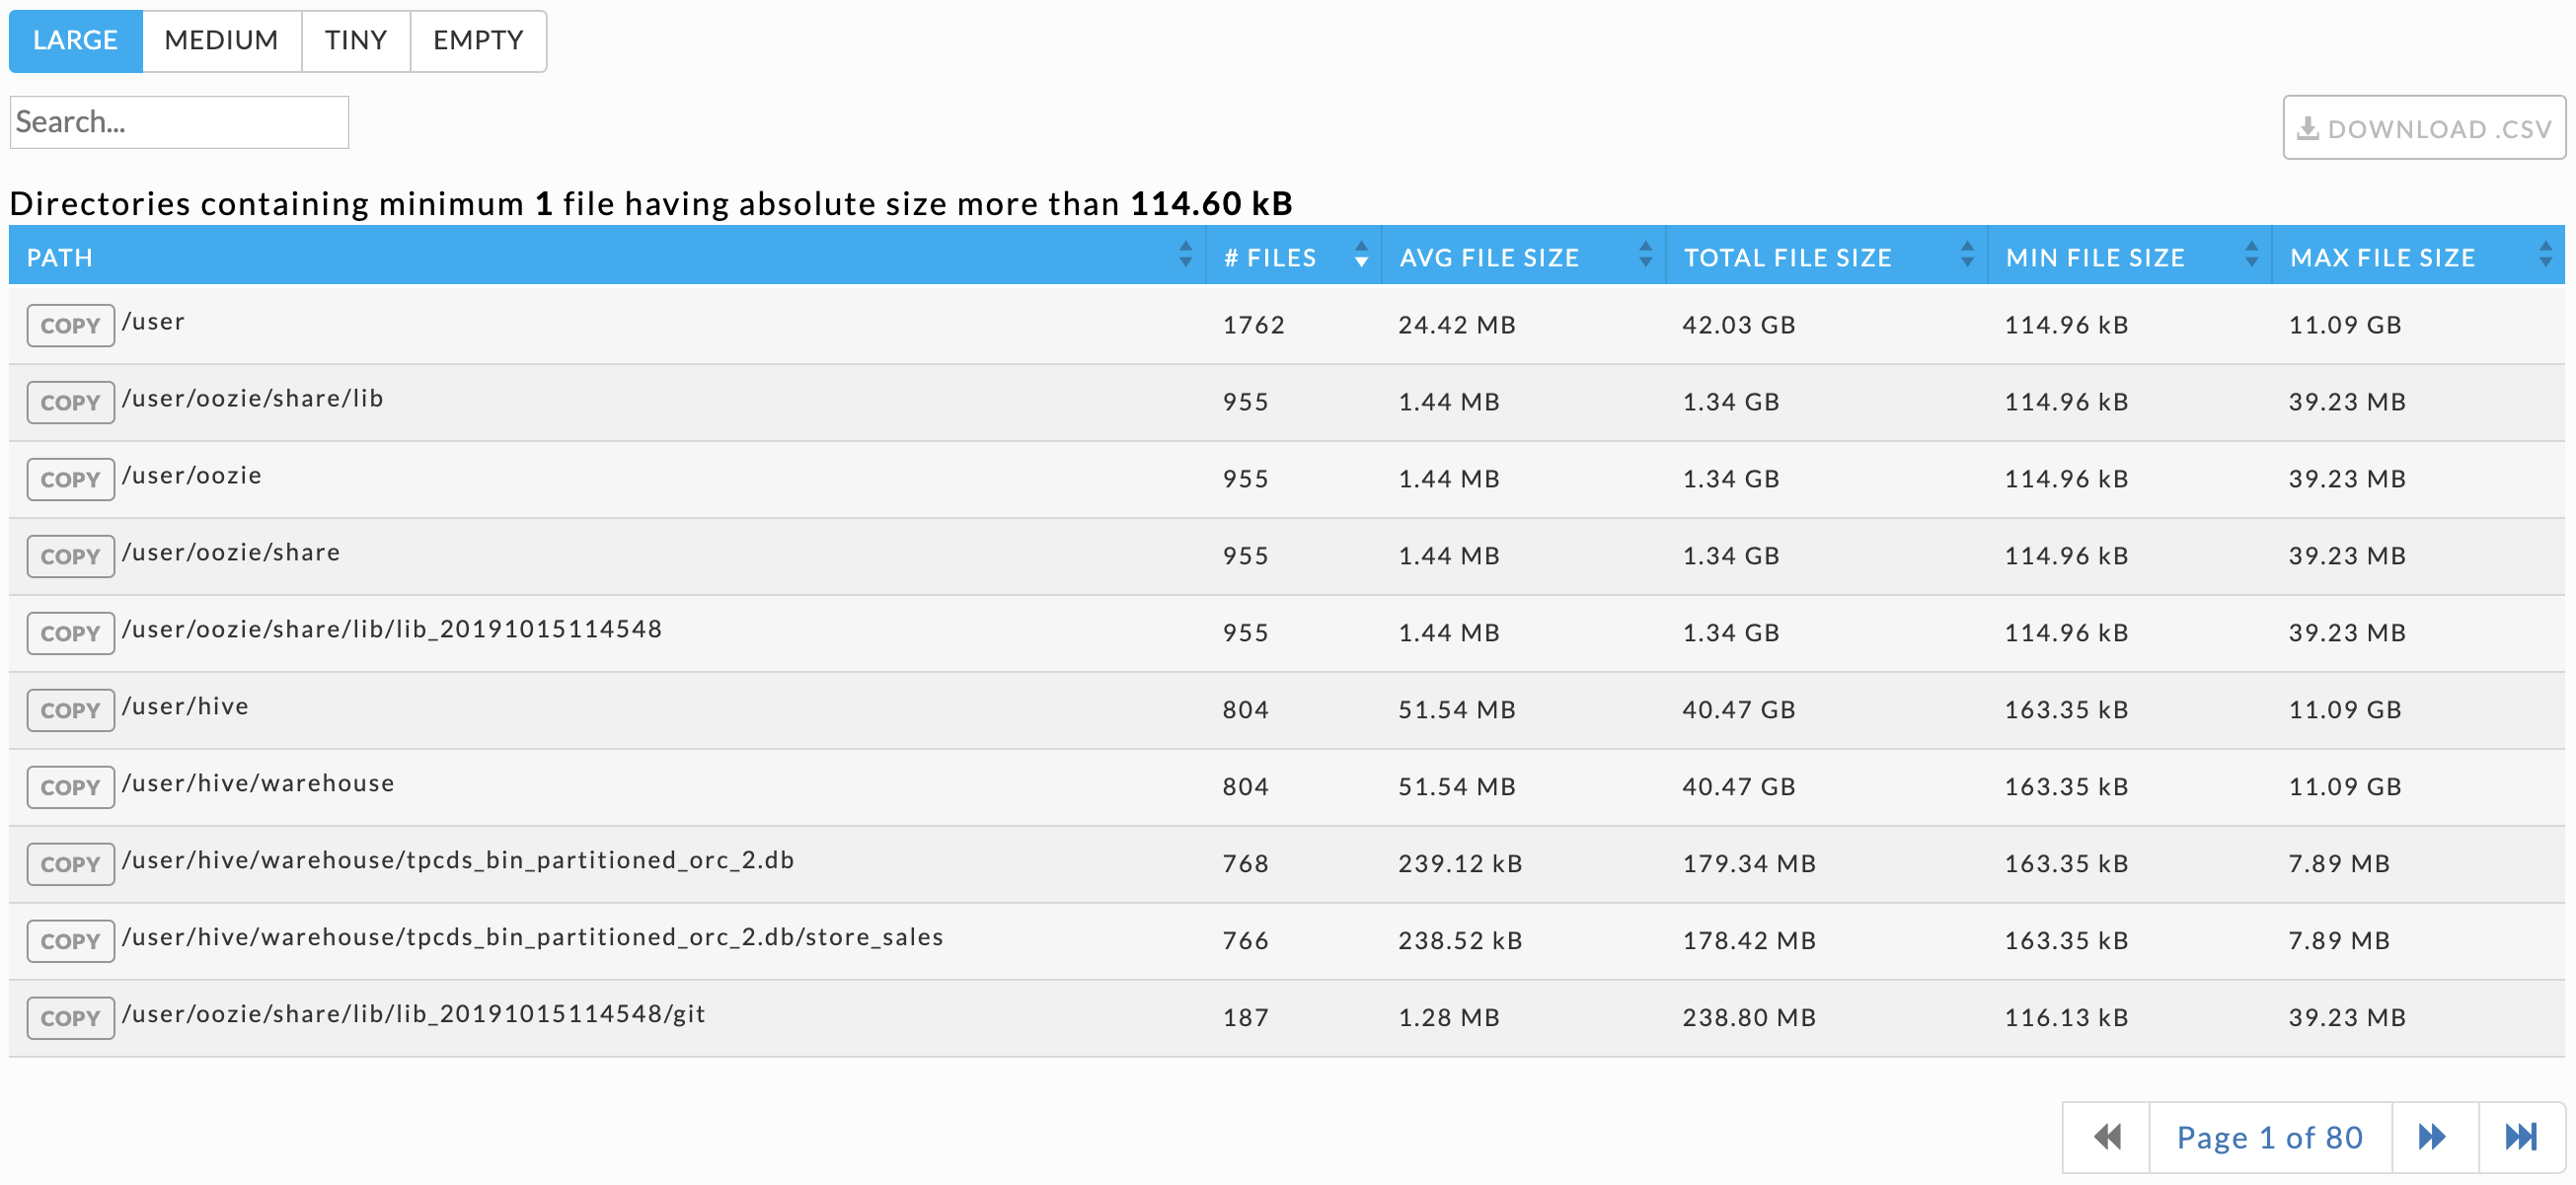
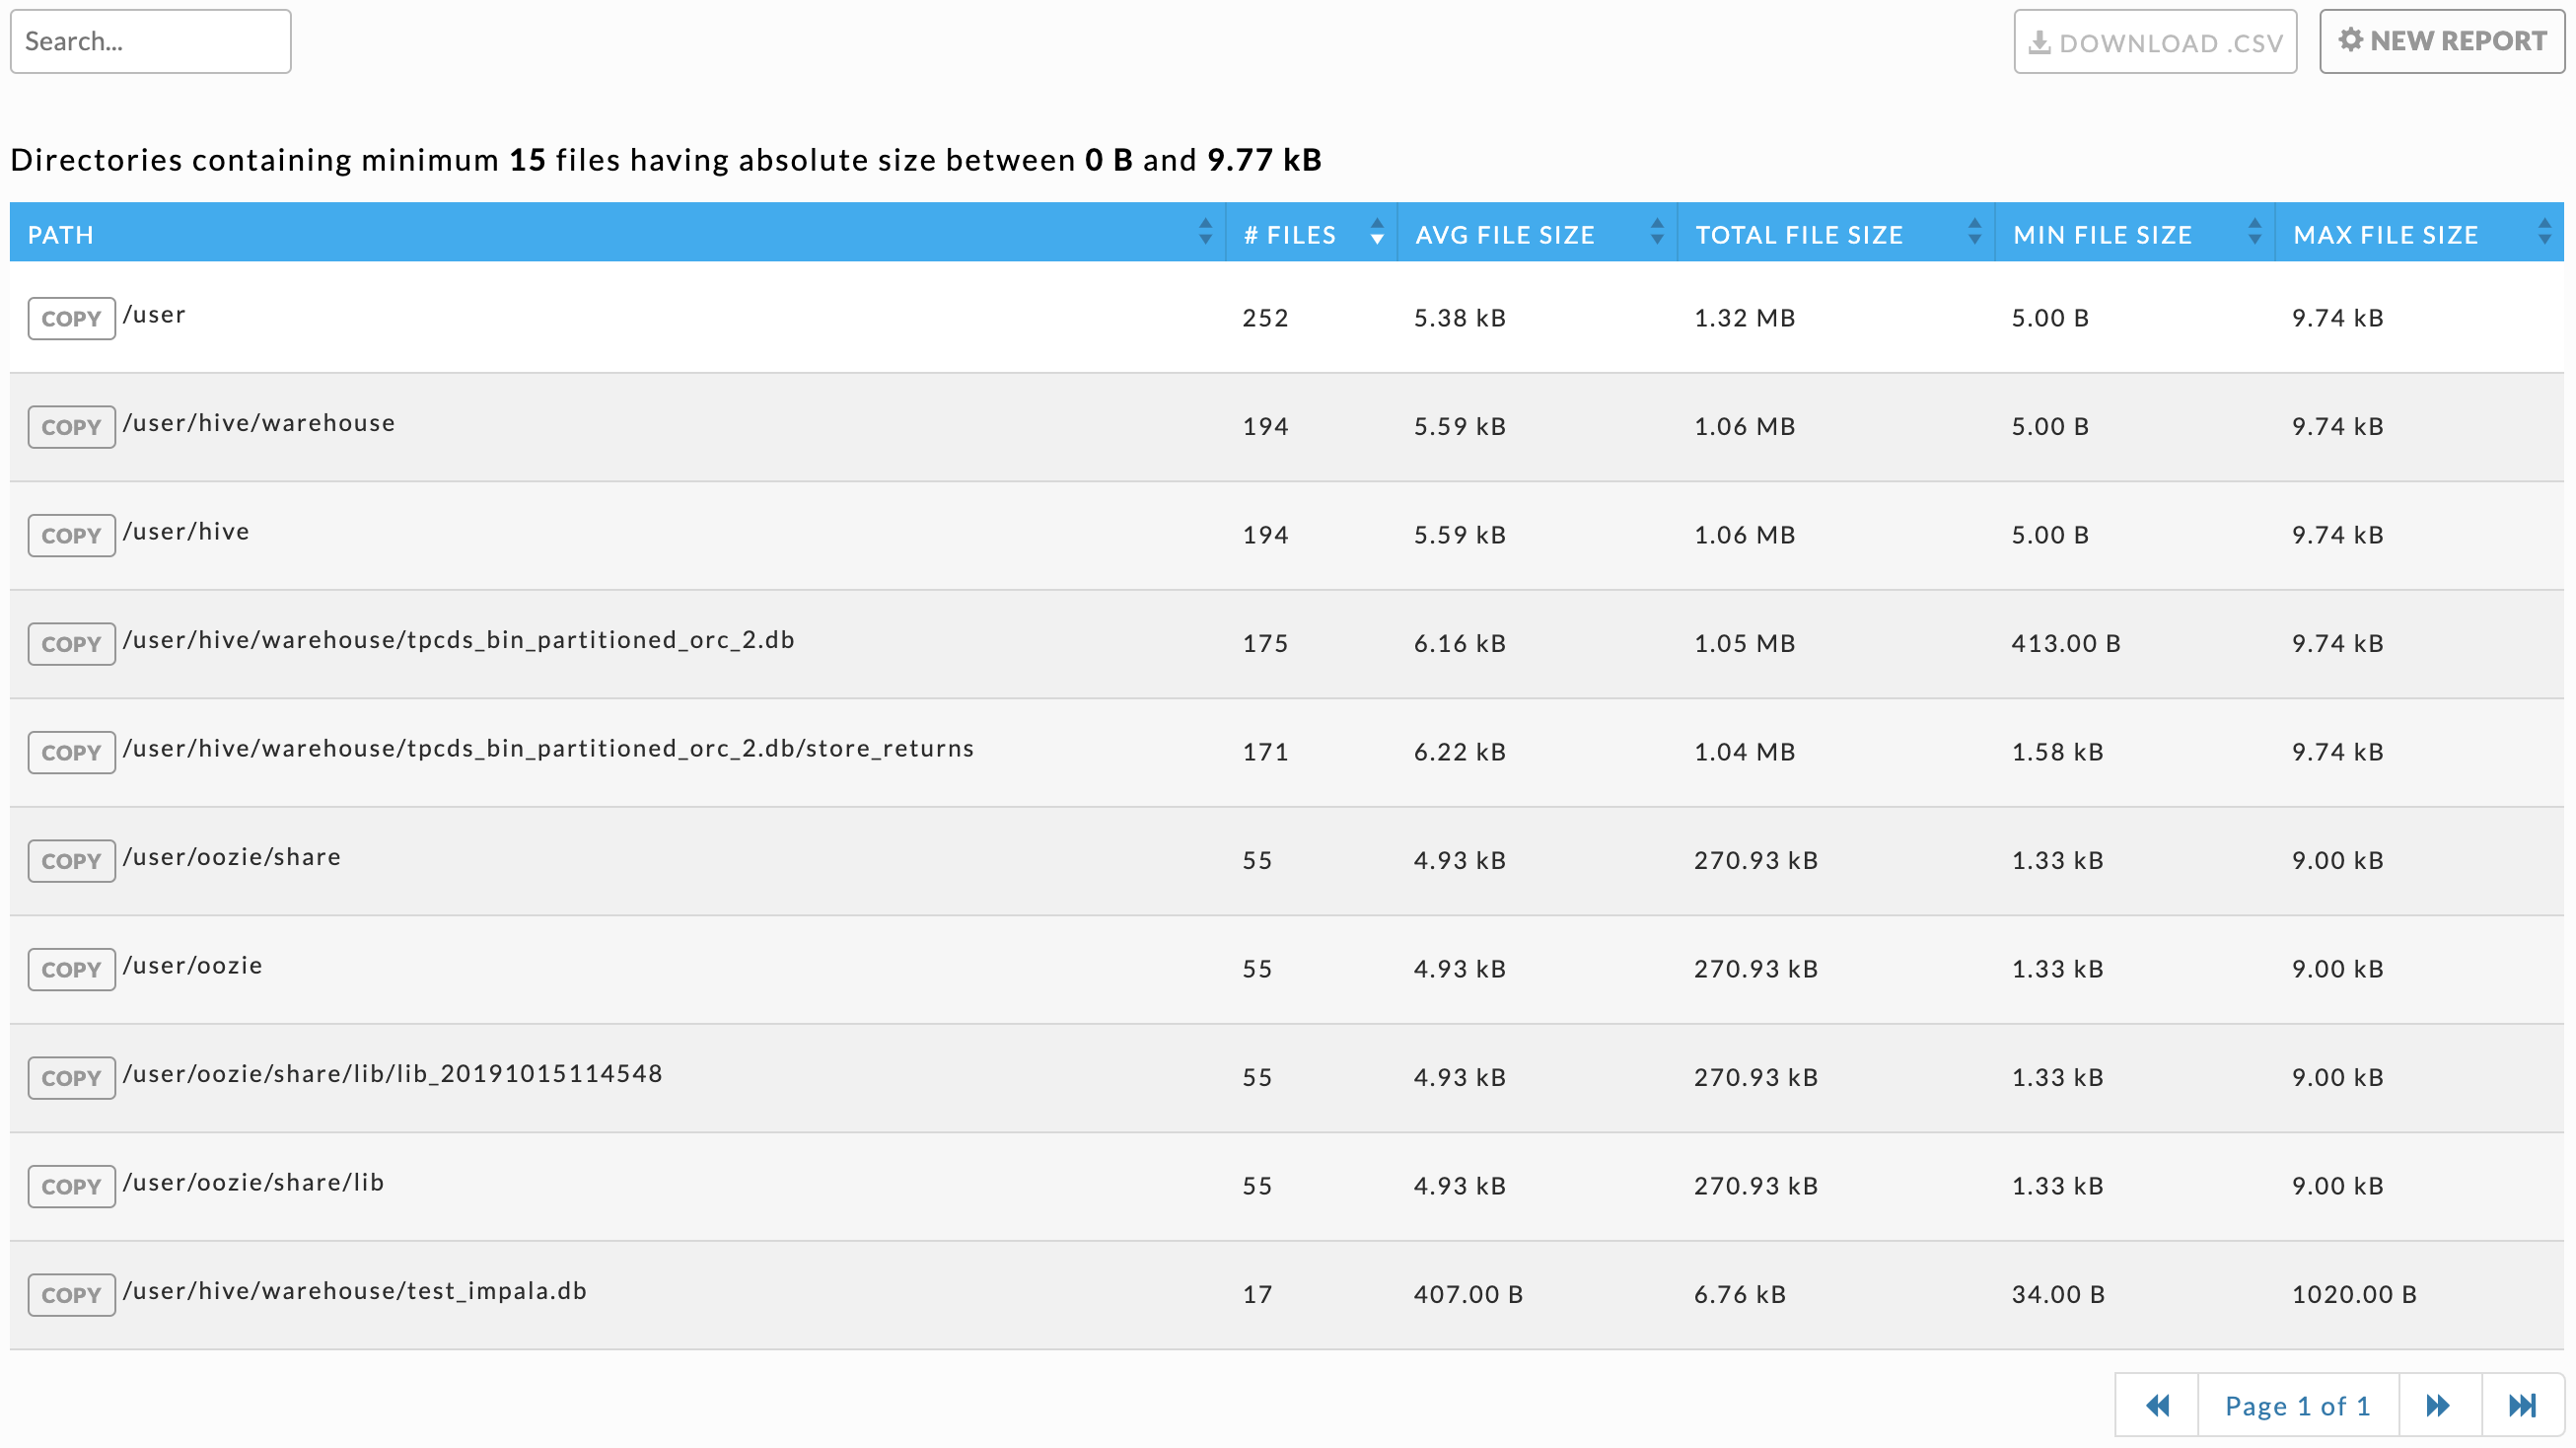
The tab opens showing the last report, if any, that was generated. It is sorted in descending order of the total number of small files in the directory. The report's parameters are listed above the table headings. You can search the table by path list, any path matching or containing the search string is displayed. Click Download CSV to download the report as a CSV file. Click  to copy the directory name.
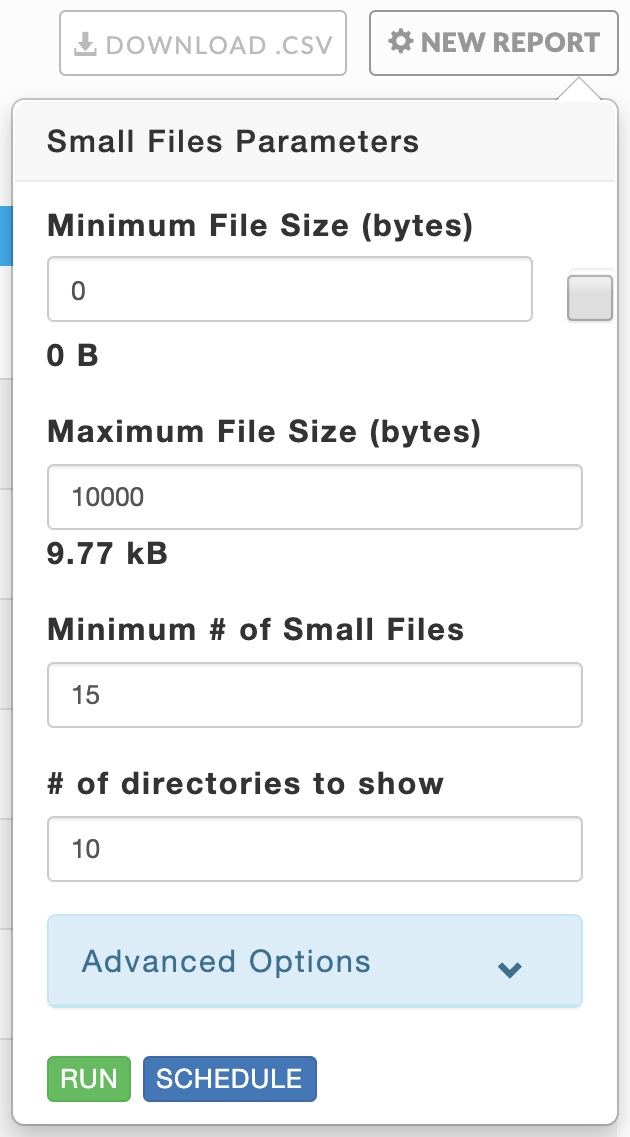
Click New Report to generate a new report. The parameters are:
Minimum File Size (bytes): The absolute file size for a file to be is accounted for in a directory. The default is zero.
Check the box to the right of the text box to use the average files (bytes) as the minimum. The Average File size is (total of all the files' sizes/# of files) of the files contained in the directory.
Maximum File Size (bytes): The absolute maximum file size for a file to be is accounted for in a directory.
Minimum # of Small Files: The minimum number of small files the directory must contain to be included in the report.
Note
You must define the above parameters.
For a directory to be included in the report it must contain At least the:
Minimum # of Small Files where (Minimum File Size ≦ File size ≦ Maximum File Size).
# of Directories to Show: The maximum number of directories to display.
Advanced Options:
Min parent directory depth: Minimum depth to start at, root + x descendants.
For example root, 1=root's children (/one_d), 2 equal root + children (/one_d) + grandchildren (/one_d/two_d).
Max Parent Directory Depth: Maximum depth to end at, root + x descendants.
For example 1=root's children (/one_d), 2=root's grandchildren, (/one_d/two_d, etc.).
Note
The depth must be between 0 and 50.
Drill Down Sub-directories: Determines how/where the files are accounted for.
Yes(default): accounts for a file in all its ancestor's. For example, if file X in the directory/d_one/d_two/d_threethen the file is counted in directories/,d_one,d_two, andd_three.No: list file accounted for in only its directory.
Click Run to generate the report and Schedule to generate the report on a regular basis. See Scheduling Reports. You must have a value for the first four parameters.
While Unravel prepares to generate the report Run is replaced with Running and a countdown appears above it. Once Unravel starts the generation the pop-up closes and the New Report button pulsates blue. A light green bar appears when the report was completed successfully and results are displayed. Upon failure, the bar is light red and the New Report button becomes orange.
All reports, whether scheduled or ad hoc, saved in the Report Archives tab. You can view or download the report there.
Files report
Note
The OnDemand package must be installed to use this report. It currently only works for CDH/HDP and requires HDFS administrator privileges. If you can't grant HDFS administrator privileges to unravel user, refer to configuring FSimage.
This report is the same as Small Files except they are automatically generated using the File Reports properties. By default, these reports are updated every 24 hours and are archived.
The default size for the files are:
Large: A file with greater than 100 GB.
Medium: A file with between 5 GB and 10 GB.
Tiny: Ay file which is less than 100 KB.
Click on the size buttons Large, Medium, Tiny, and Empty) to view the relevant report. You can search by string and any directory matching or containing the string is displayed. Click Download CSV to download the report. To copy a directory name, click next to it.