Databricks DBUs Consumption Report
The Databricks DBUs Consumption report compares the DBUs that are utilized individually by the Unravel monitored workspaces in a period of three months.
Click Generate Reports > New button.
In the New Report dialog box, enter the following details.
Items
Description
General
Name
Name of the report.
Environment
Select your platform. The reports corresponding to the selected platform are only listed in the Report type. If you select the All option, all the reports are listed.
Report type
Type of report. Select DBUs consumption.
Retention
The number of days to retain the report files. All the reports are stored in the
unity-one/src/assets/reports/jobsdirectory. After completion of the retention period, the report files are automatically purged.Parameters
TopK
Specify the top number of DBUs, which you want to be included in the report.
Notifications
Email to
Email ID to send the notification when the report is generated. You can specify multiple email IDs with comma separation. You can also select the Attach Files to Email checkbox to receive the reports as an attachment.
Note
Ensure to configure SMTP to receive the notification email.
Advance Options
Profile Memory
Select this option if you want to generate logs that help to troubleshoot scenarios where the report takes excessive time to generate or fails to generate.
Caution
The option will increase the report run time excessively.
Click OK. The generated reports will be listed under Reports on the App UI.
Select the generated report and then click Run. After the report is successfully run, the details of the report runs are listed in the Run box on the right.
Click the following:
HTML files link to view the report details.
Input parameters link to view the parameters you chose to run the report.
Log file link to view the logs of the report.
The Databricks DBUs Consumption report provides the following details:
This section provides the breakdown of the DBU consumption by workspace for a duration of three months. You can do the following in this section:
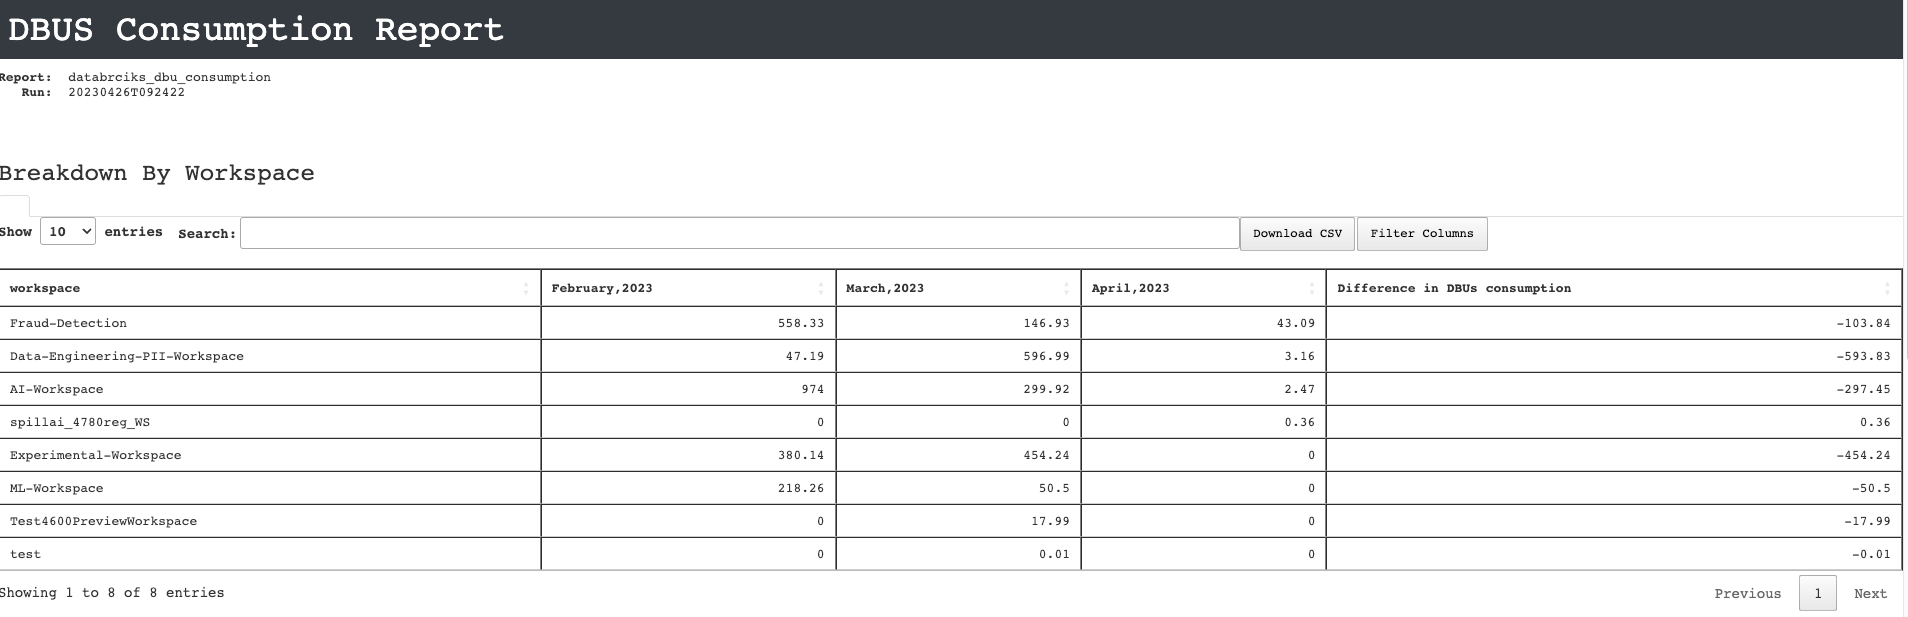
View the month-wise details of the DBU consumption of each workspace for a duration of three months. You can also view the difference in DBU consumption for the present month and the previous month.
In the Search box, enter partially or entirely the workspace name to find the DBU consumption details of a specific workspace.
Click the Filter columns button and select the columns that you want to be listed in the Breakdown by Workspace table.
Click the Download CSV button to export the details of the Breakdown by Workspace table in CSV format.
This section provides the breakdown of the DBU consumption by clusters for a duration of three months. You can do the following in this section:
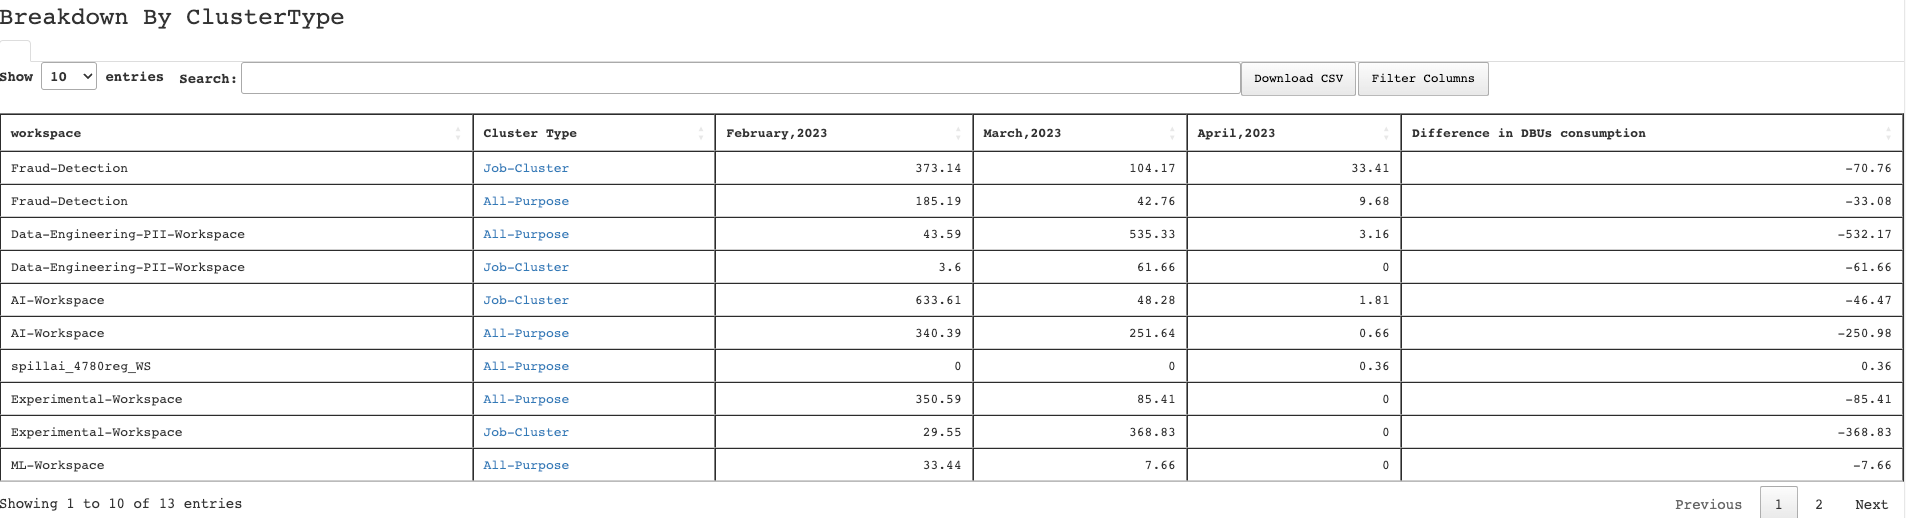
View the month-wise details of the DBU consumption of each cluster for a duration of three months. You can also view the difference in DBU consumption for the present month and the previous month.
In the Search box, enter partially or entirely the workspace name to find the DBU consumption details of a specific cluster.
Click the Filter columns button and select the columns that you want to be listed in the Breakdown by Cluster table.
Click the Download CSV button to export the details of the Breakdown by Cluster table in CSV format.
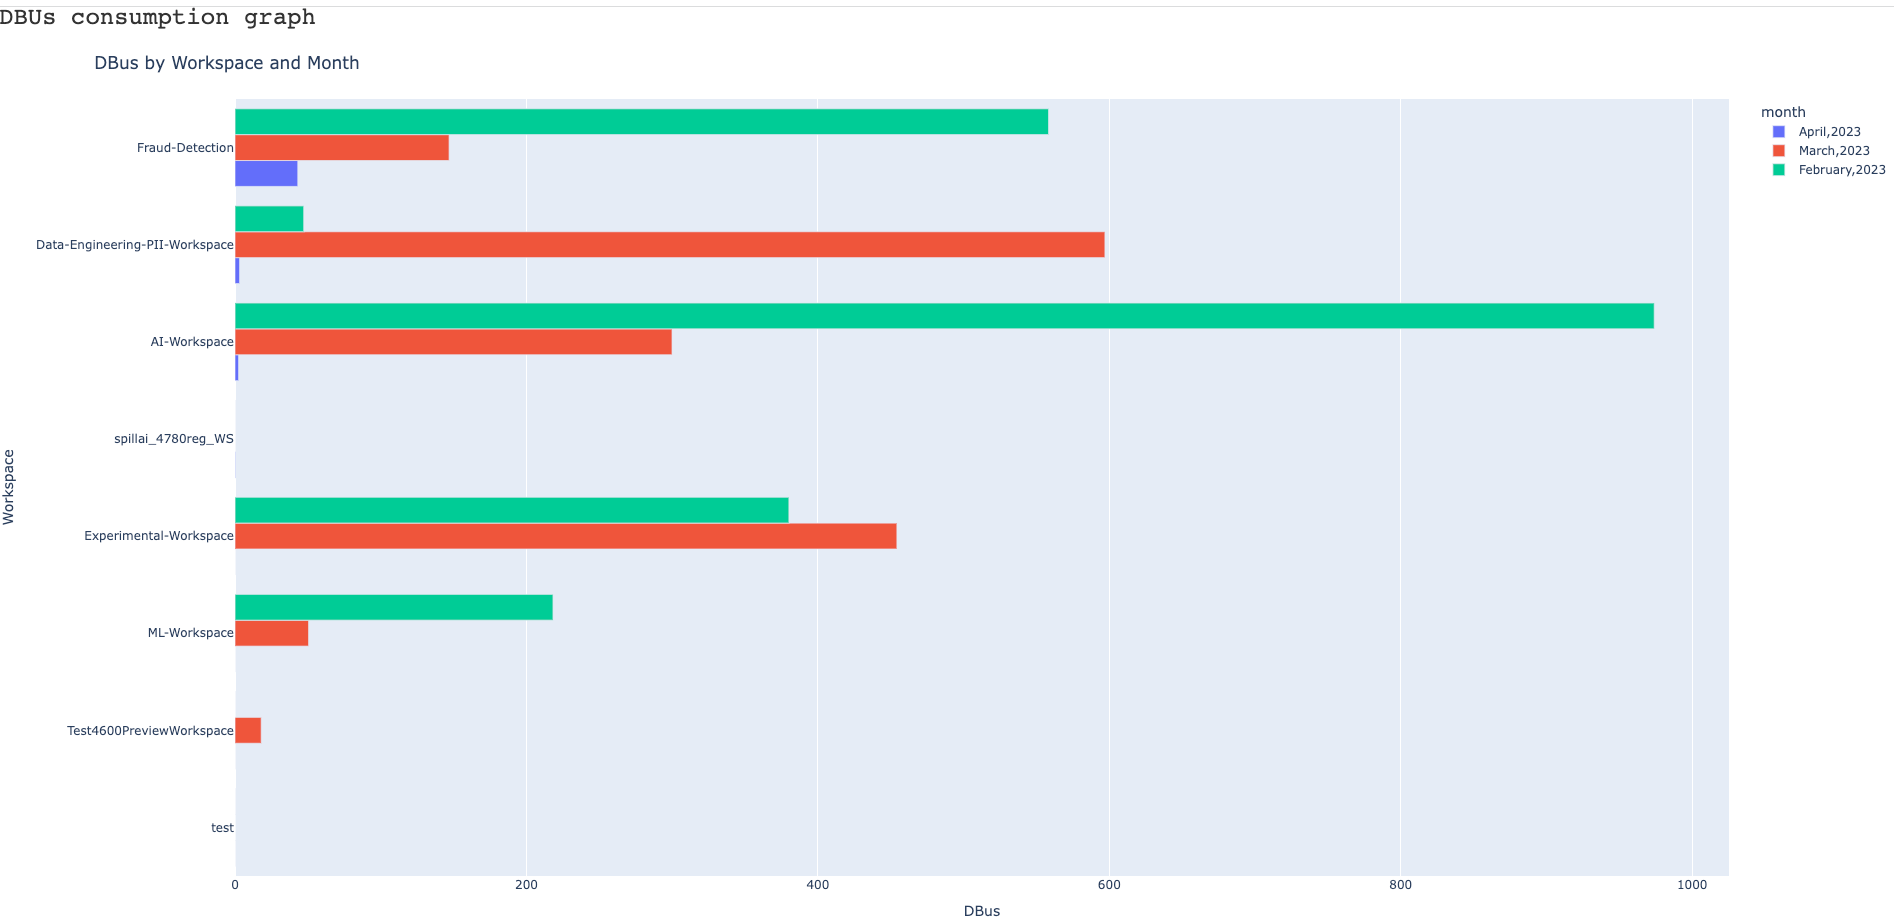
This section provides the graphical representation of DBU consumption by workspace and month. You click the months listed on the right to toggle the graph details between the months. The graph plots the DBU consumption of each workspace for all three months.