Top-K users
A report of users that are ranked among the top based on metrics. This report is useful for analyzing top consumers of resources in the clusters.
Click Generate Reports > New button.
In the New Report dialog box, enter the following details.
TopK
Items
Description
General
Name
Name of the report.
Environment
Select your platform. The reports corresponding to the selected platform are only listed in the Report type. If you select the All option, all the reports are listed.
Report type
Type of report. Select Top-K Users.
Schedule
Select the checkbox to schedule the report to run daily, hourly, weekly, or monthly. You can also set the schedule using a cron expression. You can expand the Example drop-down and select the corresponding options. The next four sample run times are displayed for reference.
Retention
The number of days to retain the report files. All the reports are stored in the
unity-one/src/assets/reports/jobsdirectory. After completion of the retention period, the report files are automatically purged.Parameters
Look Back
Period range in days when you can select applications for report generation.
Time Range
Check this option and select the from and to dates to schedule the report for the exact time range specified. The only anomaly with this option is that the same report will be scheduled to be generated repeatedly.
Trend interval
Select the interval to aggregate the metrics for the trend graphs. The options are daily, hourly, weekly, or monthly. If not selected the interval will be computed internally based on the Look Back days.
Users
Select users that you want to be included in the report.
If none are selected, then all the users are included in the report. Otherwise, only the specified users will be considered in the Top-k analysis.
Queues
Select the queues that you want to include in the report. You can select multiple queues. If none are selected, all queues detected will be included in the report.
Kinds
Select the applications that must be included in the analysis report. The options are Impala, Hive, Spark, and MR.
Clusters
Select the clusters that you want to include in the report. You can select multiple clusters. If none are selected, all clusters detected will be included in the report.
Tags
The option to filter based on tags, if not selected then all tags will be considered. You can specify the tags as follows:
Key: Specify the tag name. A single key can have more than one value.
Values: Specify the values based on the selected tag name. If the value is empty, all the values for the selected key are considered.
Click the Add button to add multiple key-value pairs. Click the Remove button to remove a key-value pair.
Tag Values
Select the tag values corresponding to the tag names you have selected that you want to include in the report. Options for tag values will only show when you select a tag. You can select multiple tag values. If none are selected, all tag values detected for a tag will be included in the report.
TopK
Select the number of top consumers that must be shown in the report.
Features Filter
Filters the key-value features fetched from feature indices. The custom features/fields can be added in features indices by modifying the
customizable_feature.py. Those features will be available here.Notifications
Email to
Email ID to send the notification when the report is generated. You can select the Attach Files to Email checkbox to receive the reports as an attachment.
Advanced Options
Profile memory
Select this option if you want to generate logs that help to troubleshoot scenarios where the report takes excessive time to generate or fails to generate.
Caution
The option will increase the report run time excessively.
Click OK. The generated reports will be listed under Reports on the App UI.
Select the generated report and then click Run. After the report is successfully run, the details of the report runs are listed in the Run box on the right.
Click the following:
HTML files link to view the report details.
Input parameters link to view the parameters you chose to run the report.
Log file link to view the logs of the report.
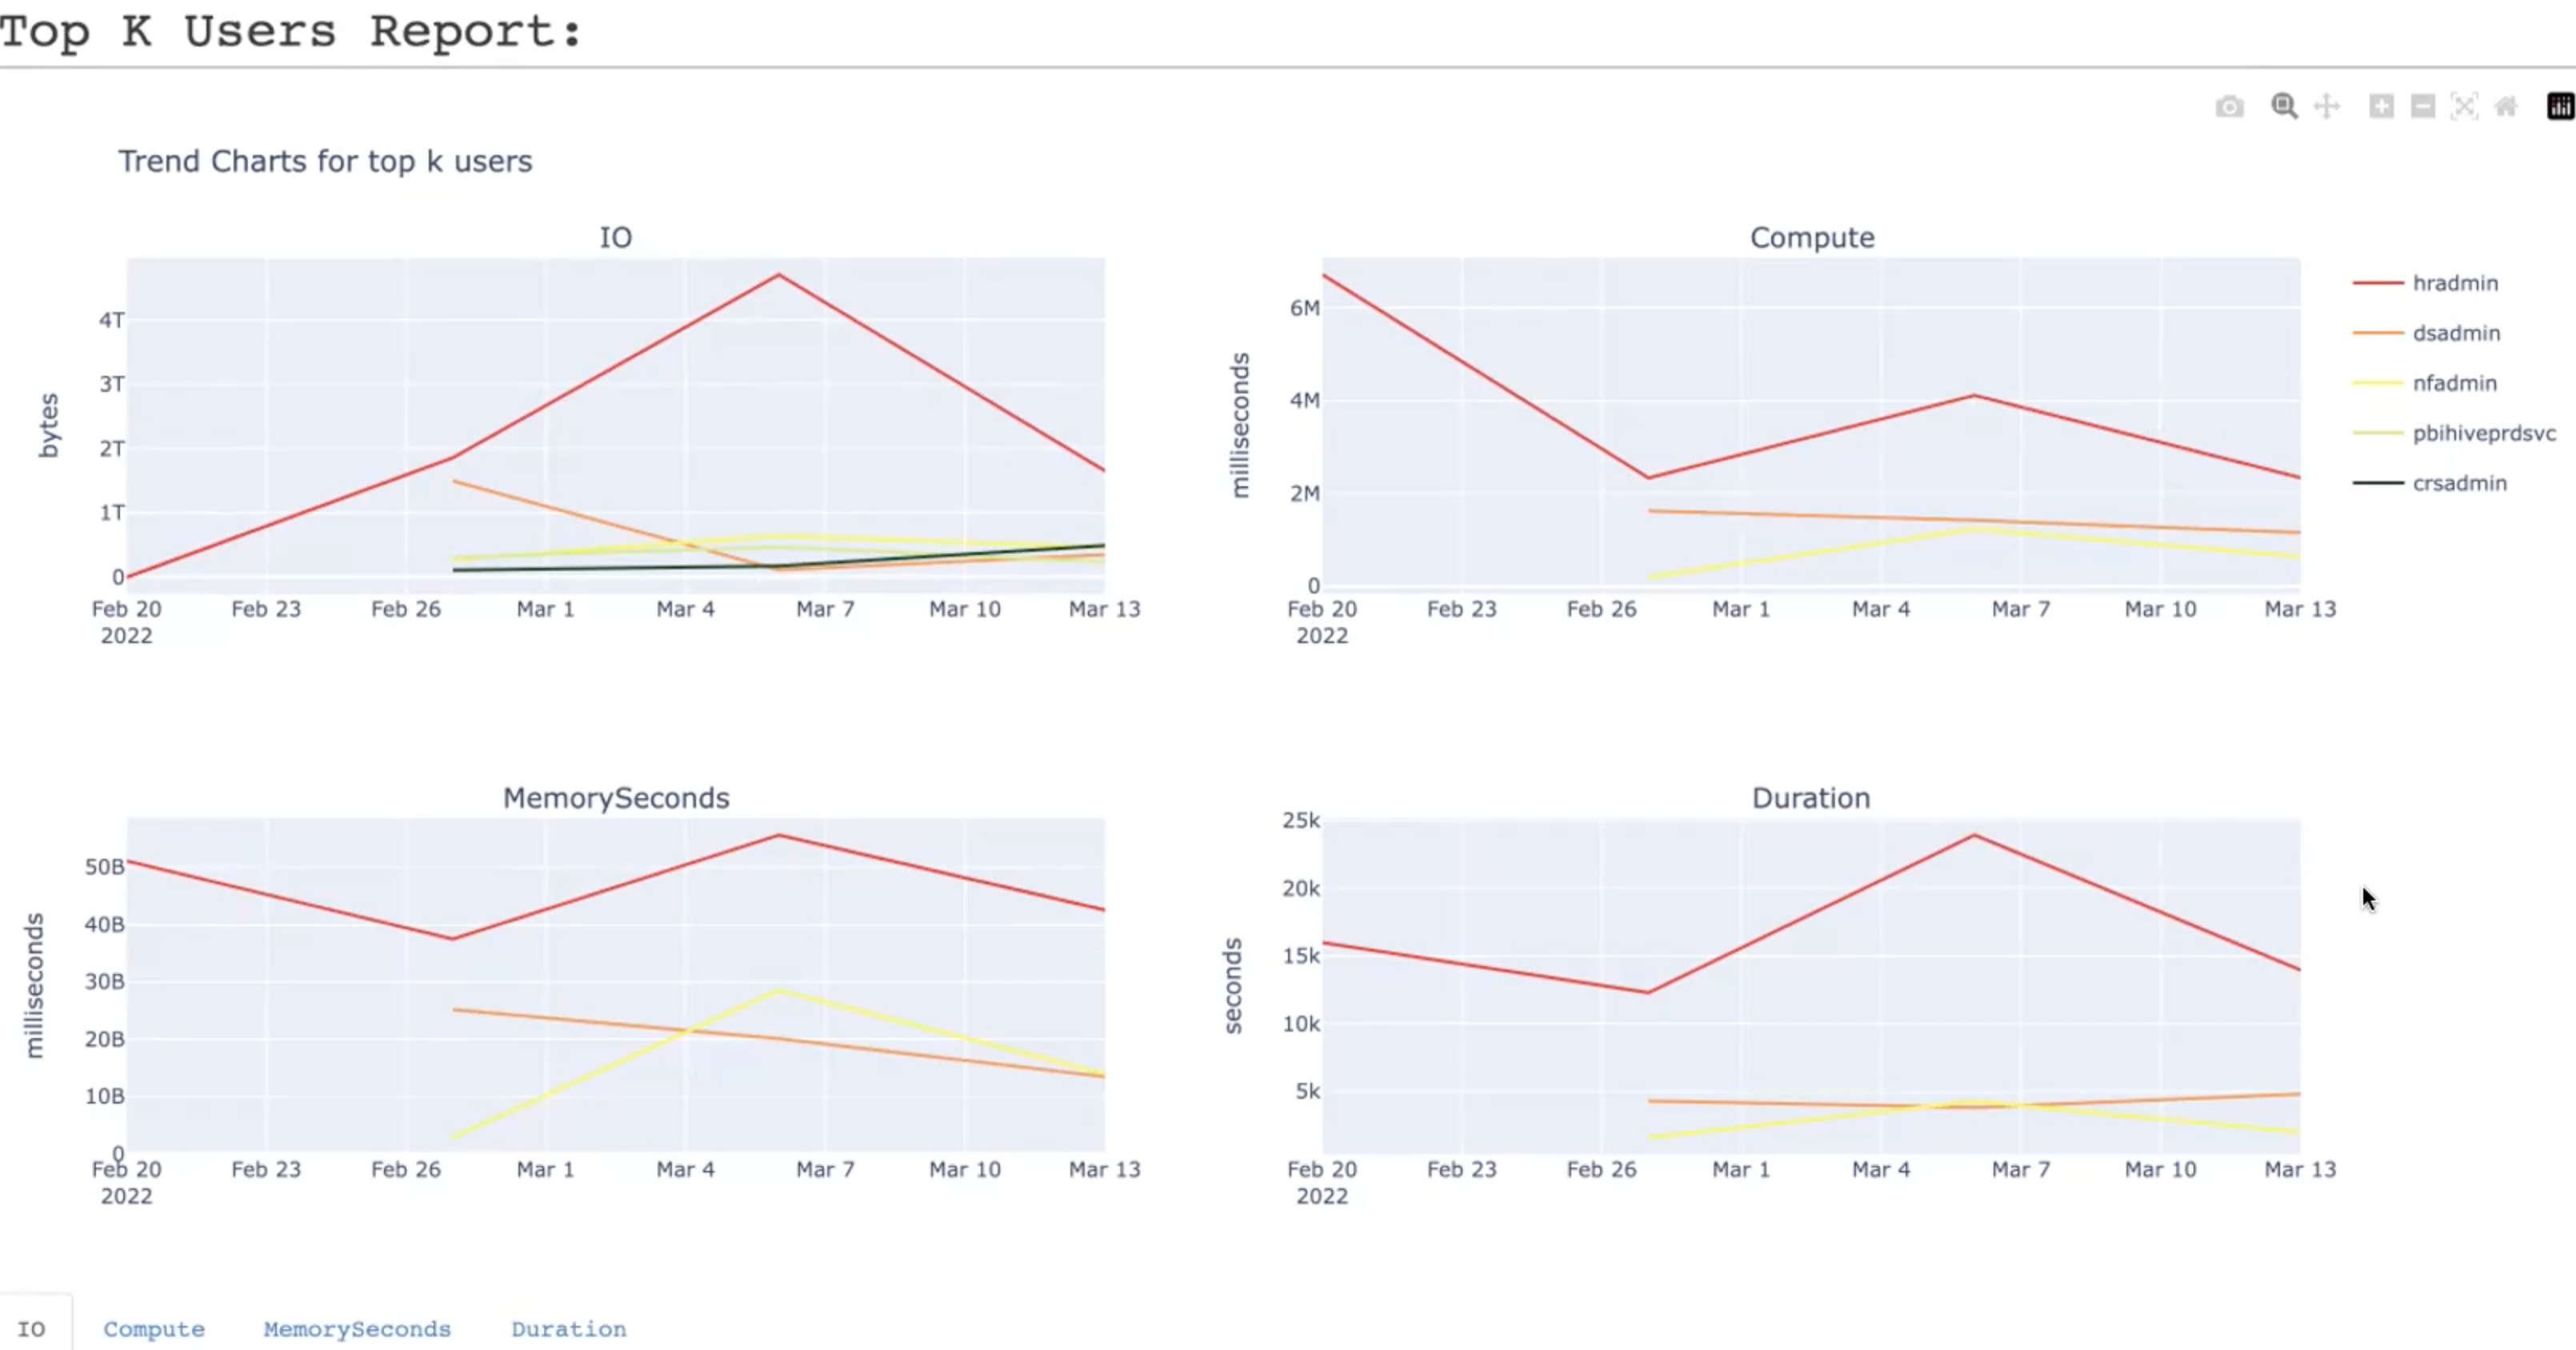
The Top-K users report shows the trends of the top users based on the metrics (IO, compute, memory second, and duration). On the top, the details related to the selected parameters are specified.
The Top-K users report comprises the following:
Trend charts: These trend line graphs plot the top users on a time series chart based on each metric (IO, compute, memory second, and duration). In the following time series chart, the hradmin is the top resource consumer among other users.
Pie chart: The usage pattern of the top users for a specific metric is shown in a pie chart. A tab is allotted for each metric. Click the metrics (IO, compute, memory second, and duration) tab to view the usage pattern of the top users for the corresponding metric. The others in the pie chart represent the rest of the users.
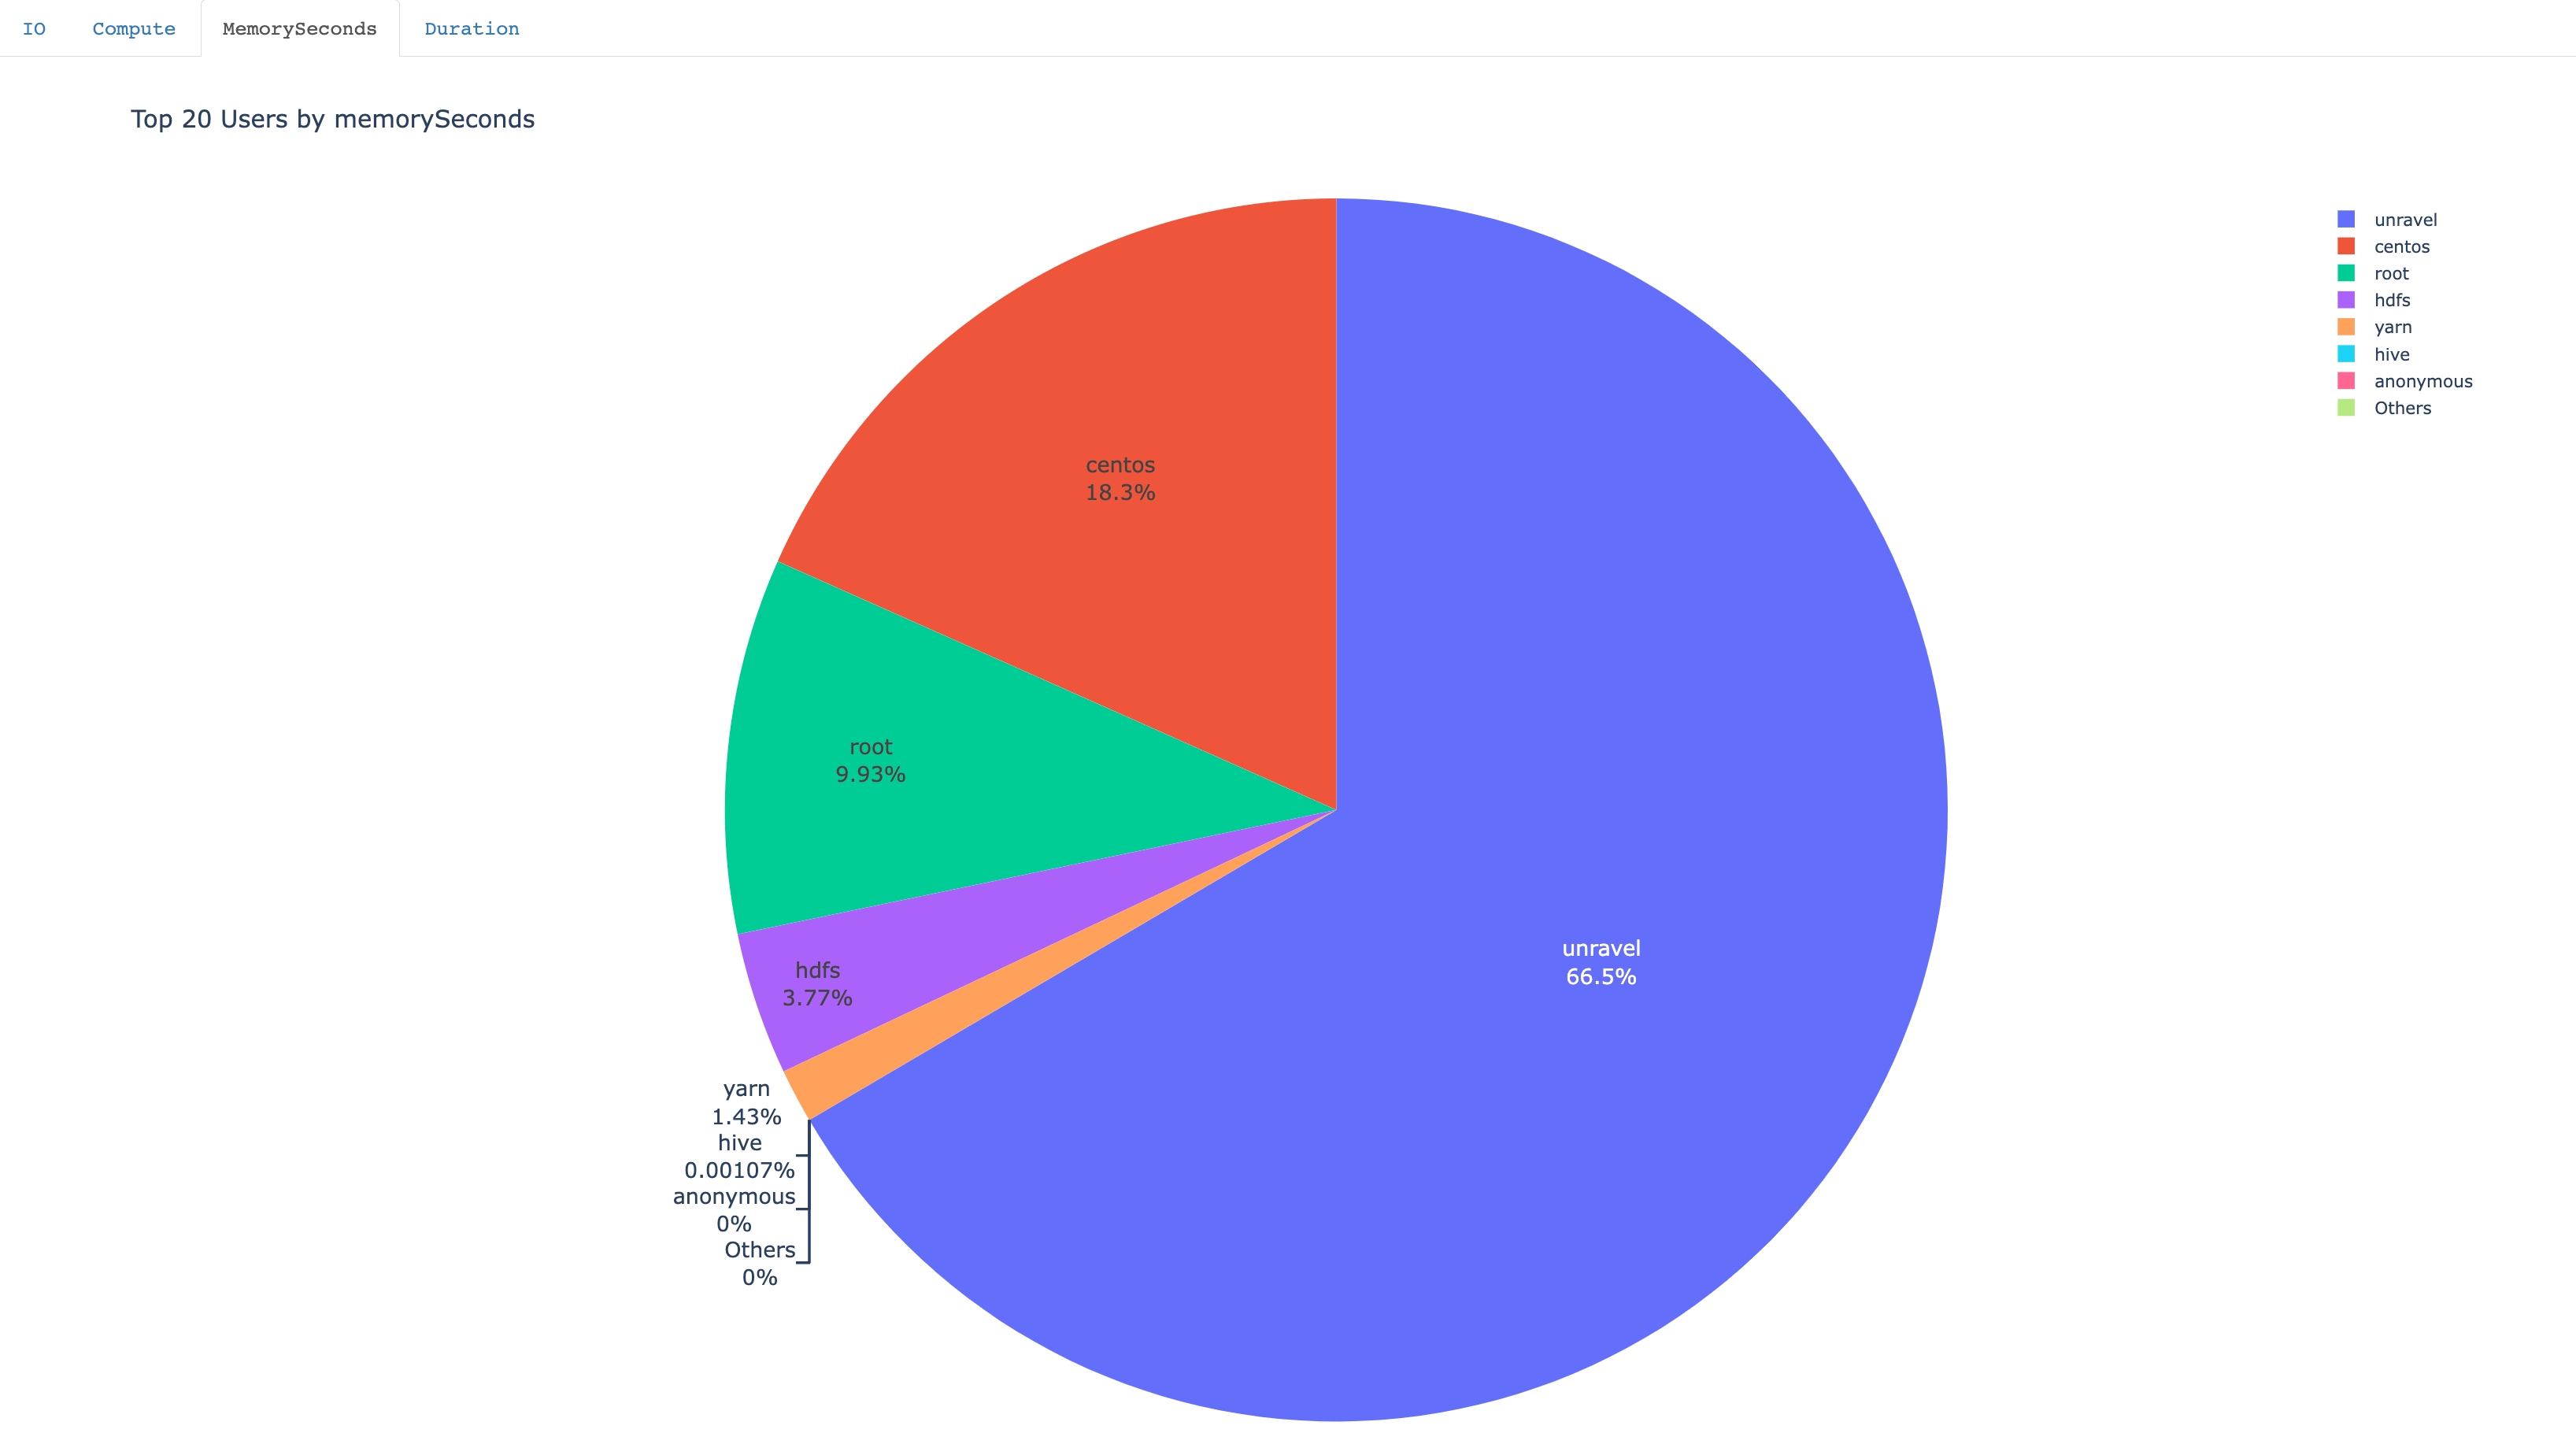
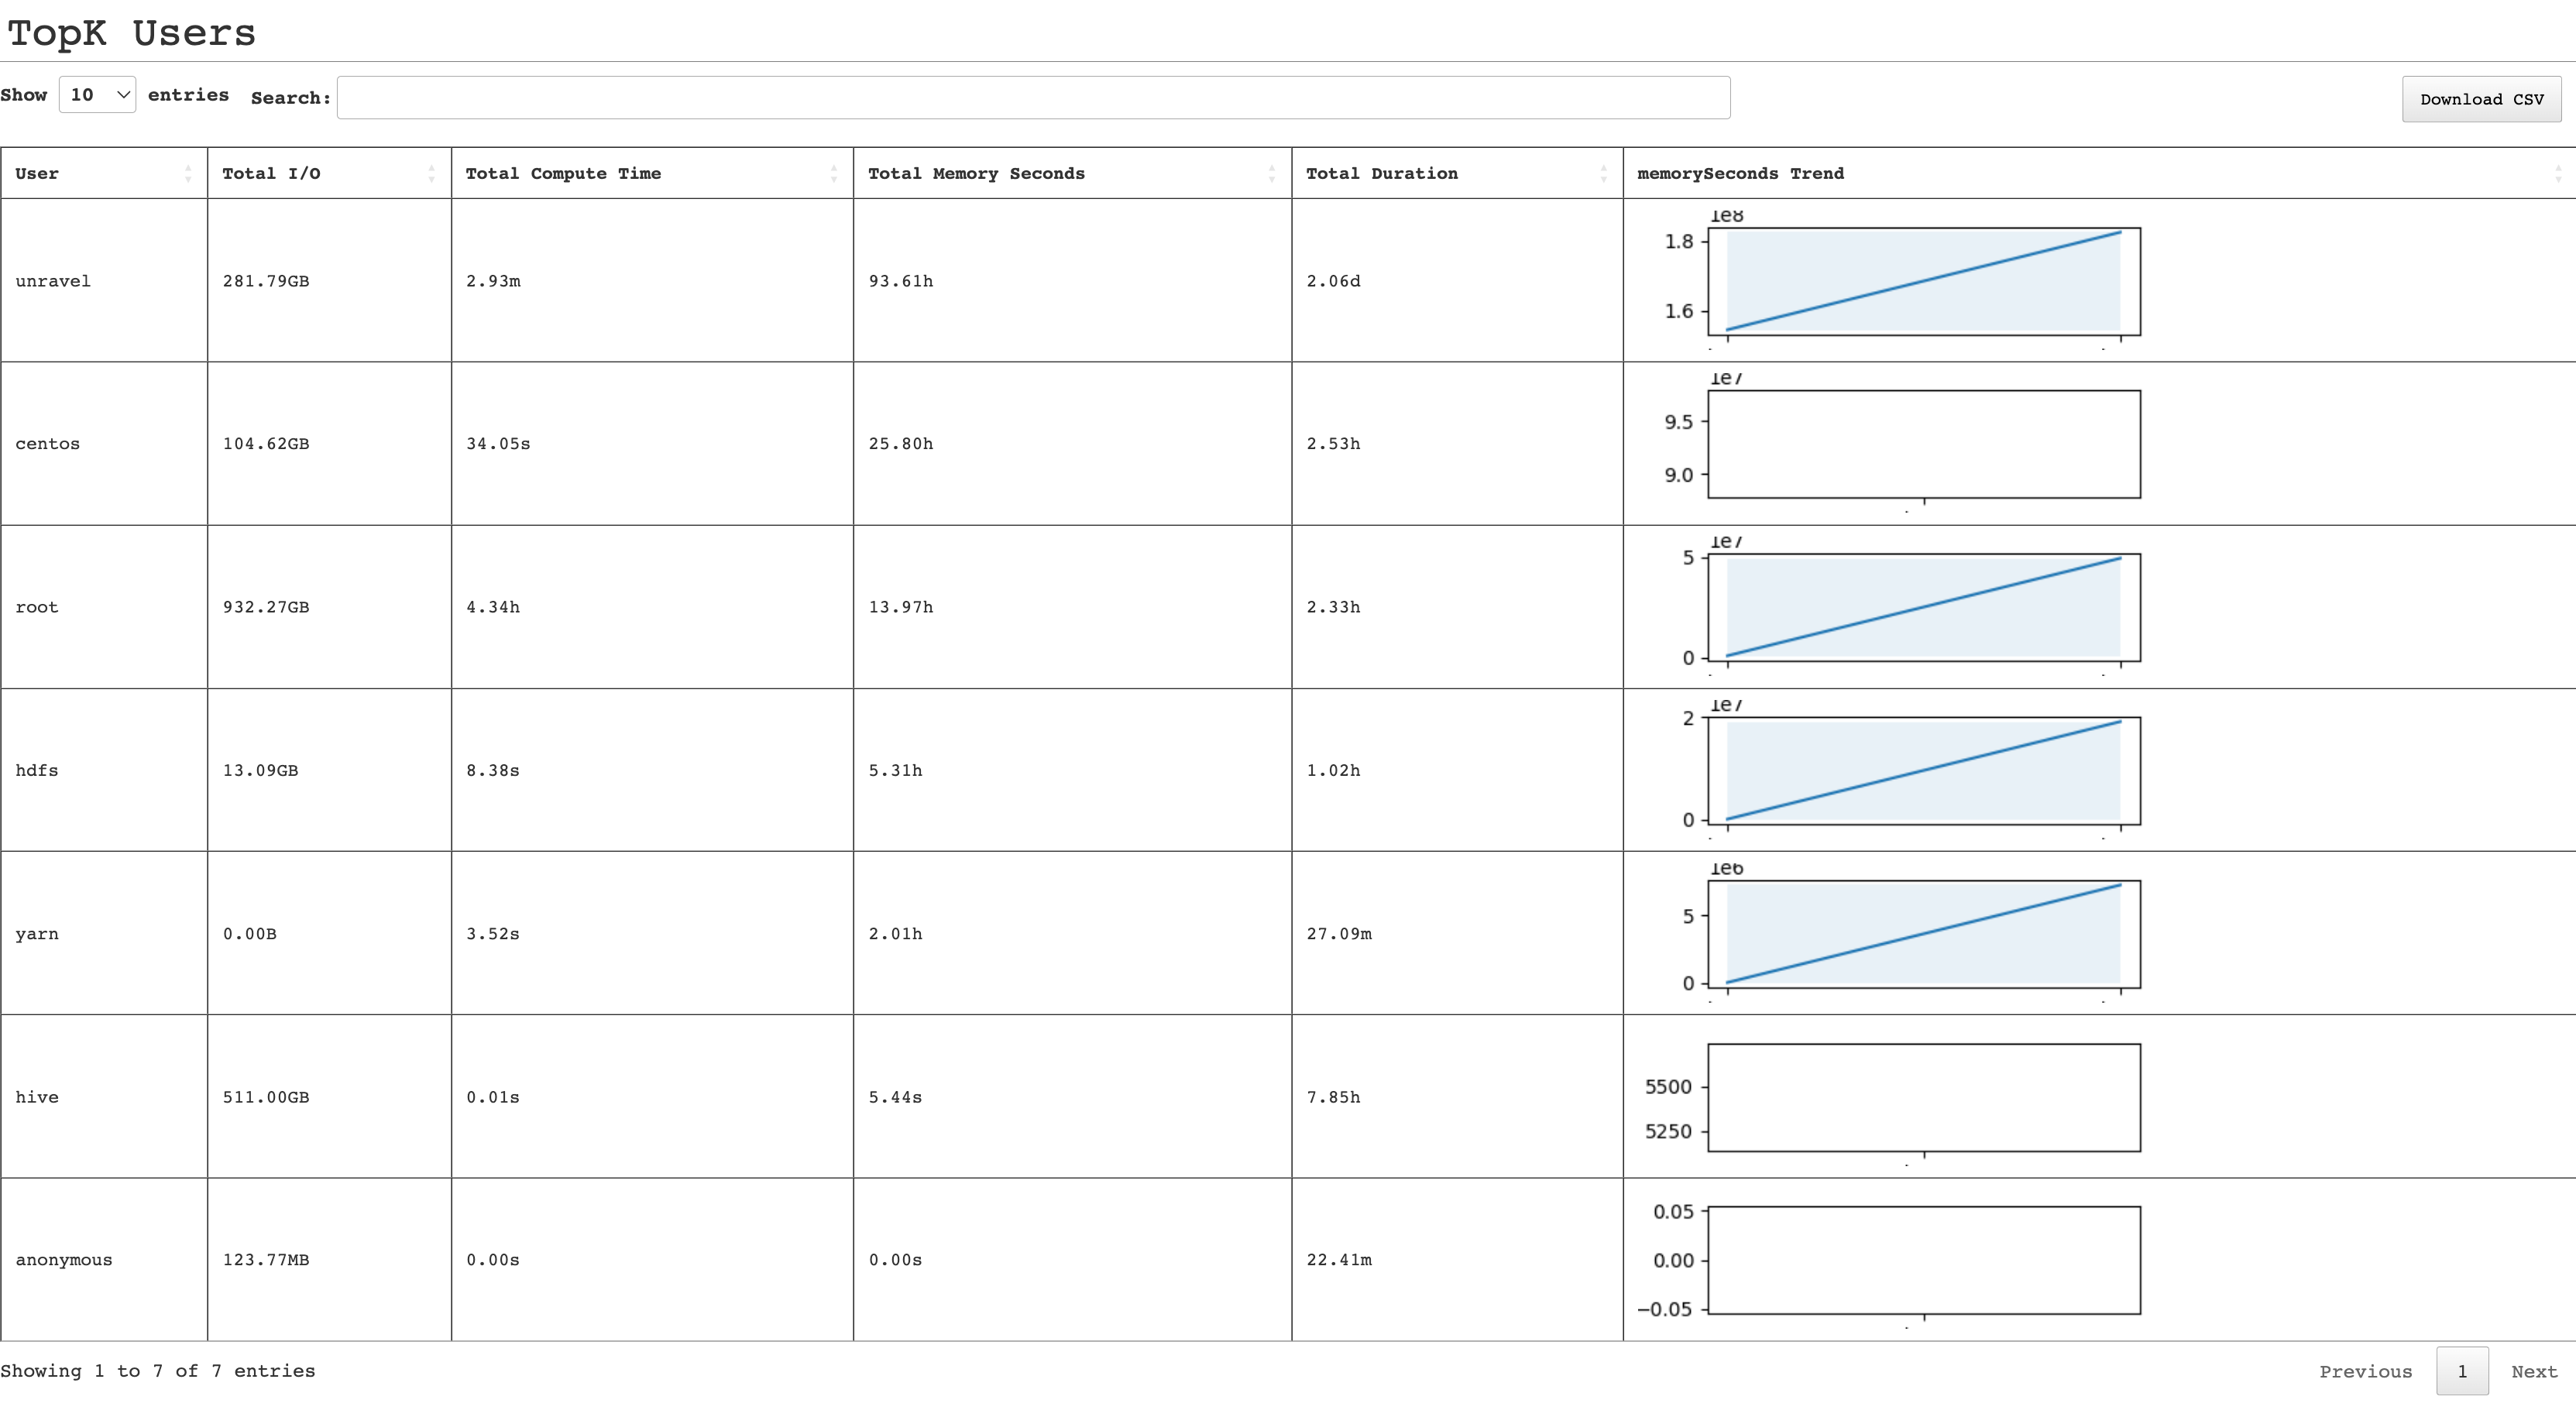
Table: The usage is represented in a tabular format with details about each metric usage by the top-k users and the IO trend.
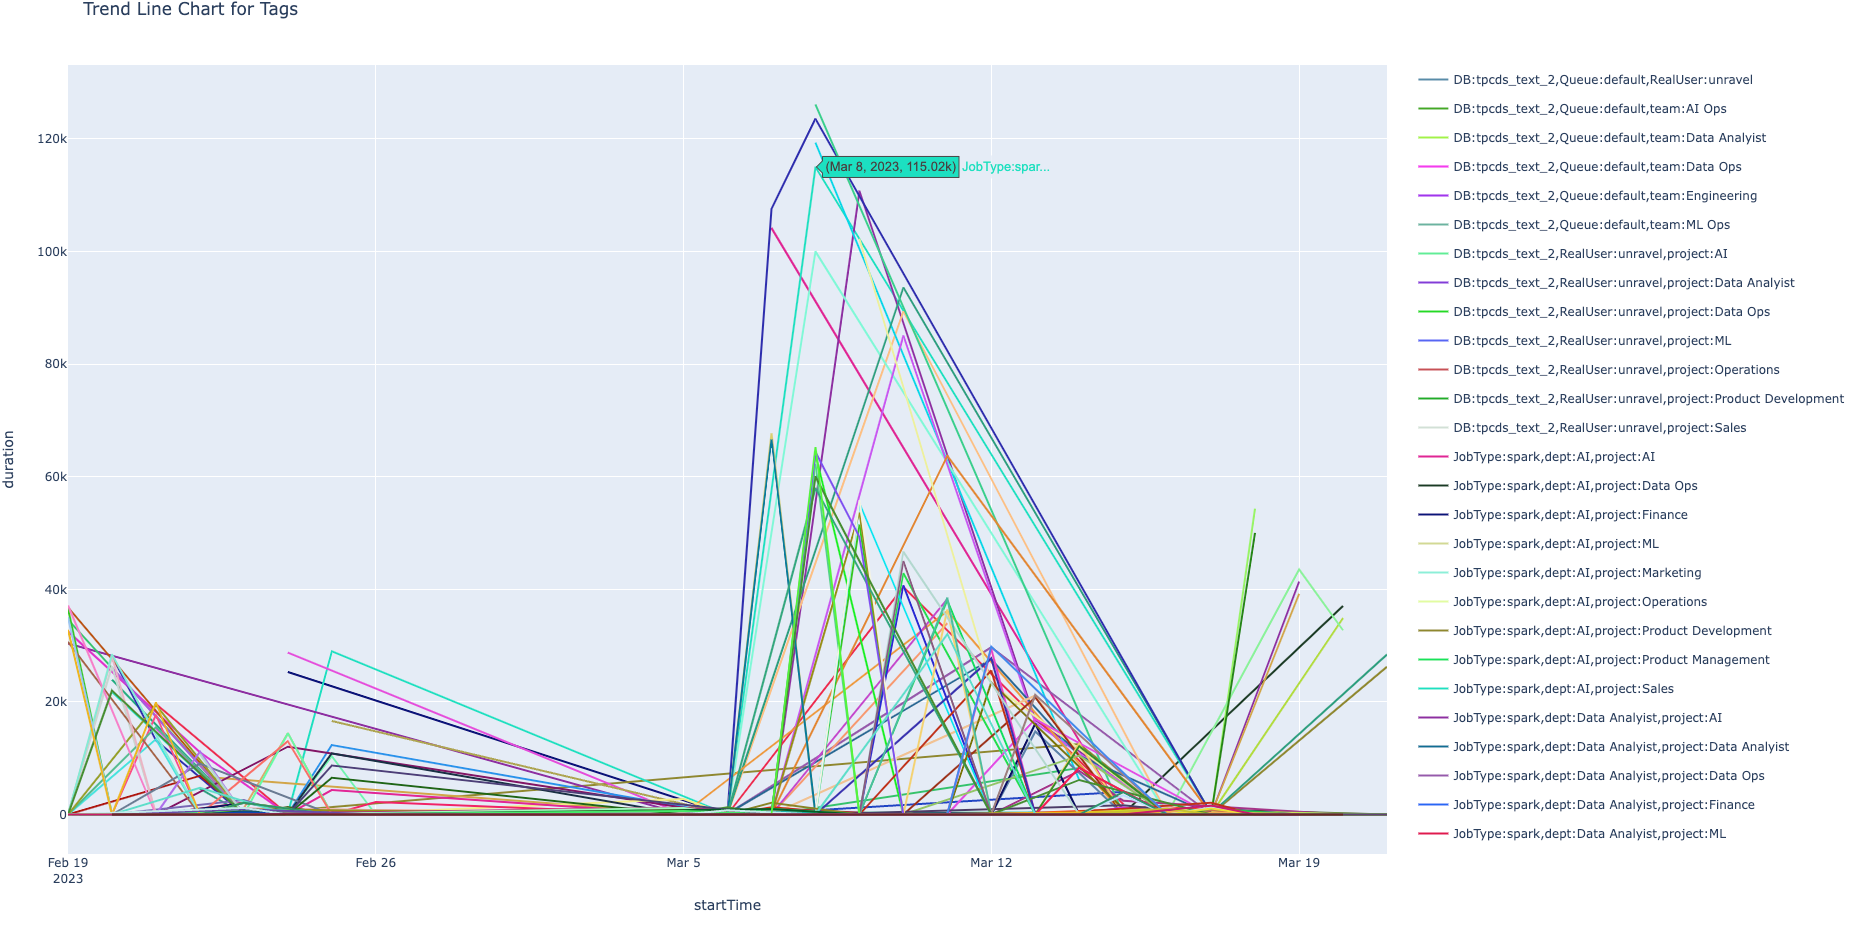
Trendline chart: The trendline chart, based on tags associated with the apps (key:value pairs), for a selected metric.
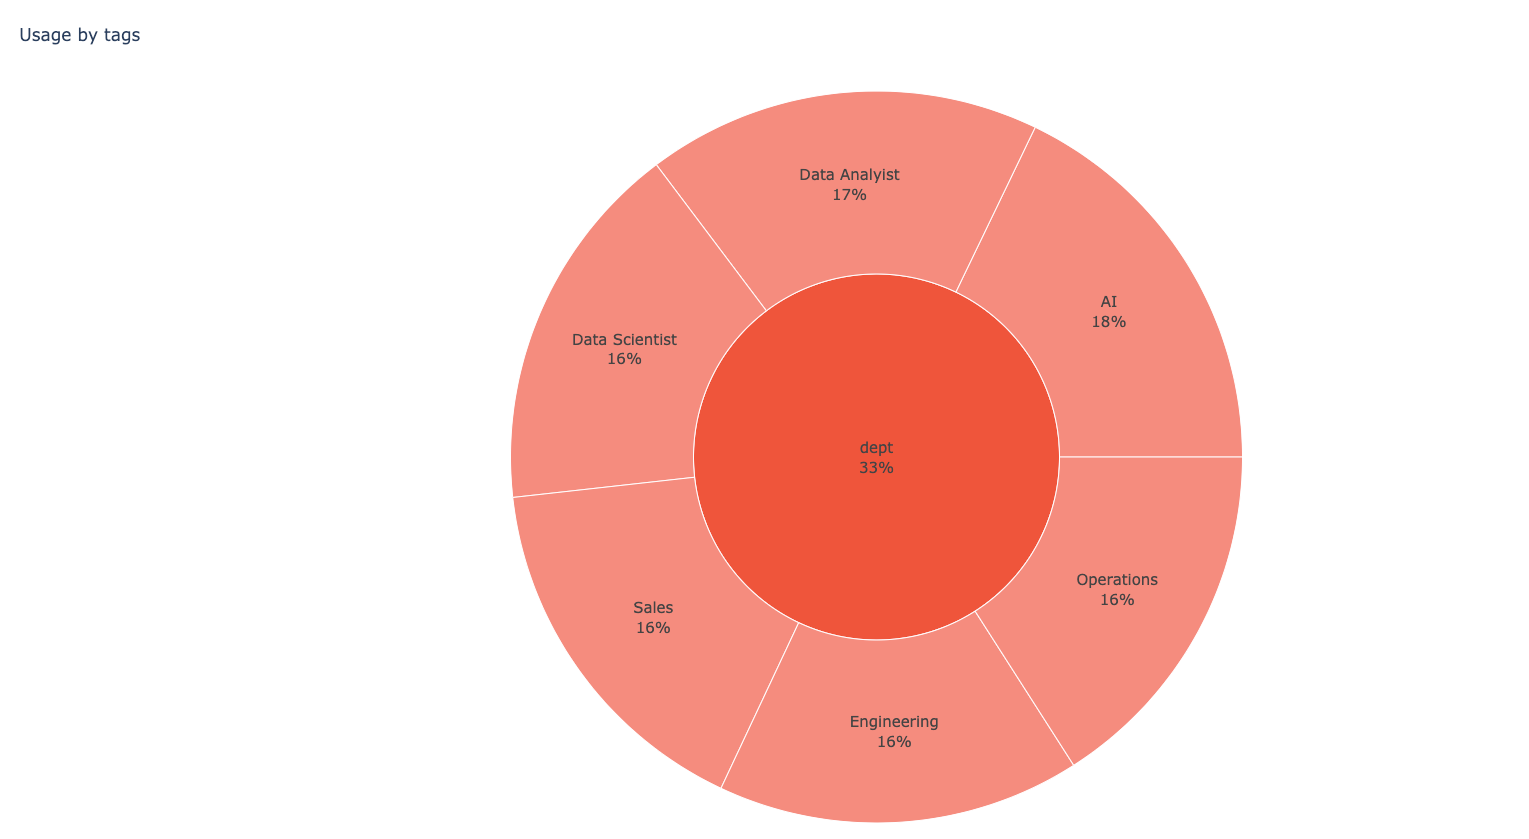
Sunburst chart: The sunburst chart shows the distribution of tag keys and values.
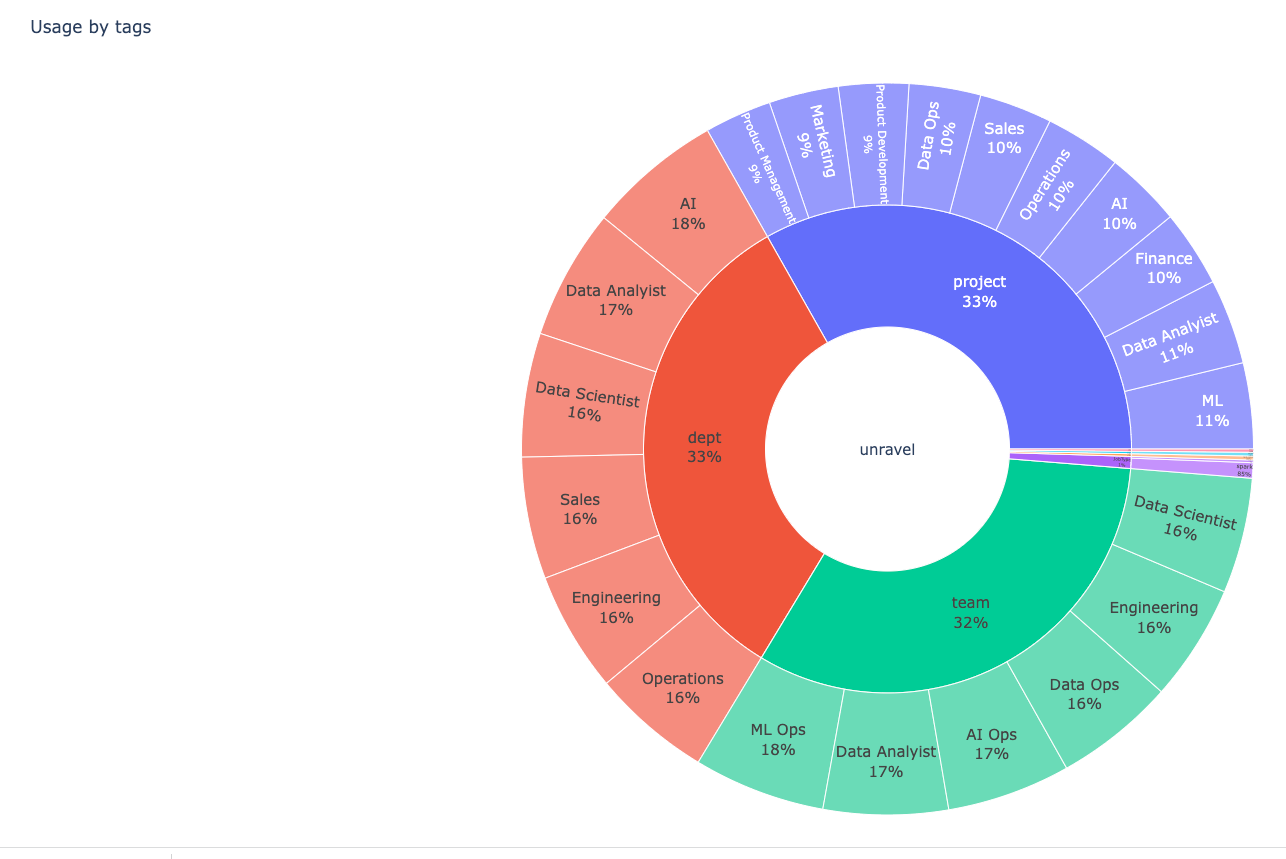
You can click a section on this chart to view the details of a specific tag. Click again on the chart to view all the sections.
Tip
If you want to analyze the usage trend of a specific top-k user, refer to Deep user analysis report.