Databricks cost breakdown report
This report analyzes the Databricks clusters based on the cost threshold.
Click Generate Reports > New button.
In the New Report dialog box, enter the following details.
Items
Description
General
Name
Name of the report.
Environment
Select your platform. The reports corresponding to the selected platform are only listed in the Report type. If you select the All option, all the reports are listed.
Report type
Type of report. Select Databricks cost breakdown report.
Schedule
Select the checkbox to schedule the report to run daily, hourly, weekly, or monthly. You can also set the schedule can using a cron expression. You can expand the Example drop-down and select the corresponding options. The next four sample run times are displayed for reference.
Retention
The number of days to retain the report files. All the reports are stored in the
unity-one/src/assets/reports/jobsdirectory. After completion of the retention period, the report files are automatically purged.Parameters
Look Back
Specify in days the period range that can be used to generate a report.
Use Exact Date-Time
Check this option and select the from and to dates to schedule the report for the exact time range specified. The only anomaly with this option is that the same report will be scheduled to be generated repeatedly.
Users
Select the users who must be included in the report. You can select multiple users. If not selected, all the users will be considered in the report.
Workspaces
Select the workspaces that must be included in the report. You can select multiple workspaces. If not selected, all the workspaces will be considered in the report.
Clusters
Select the clusters that you want to be included in the report. You can select multiple clusters. If not selected, all the clusters will be considered in the report.
Instance Type
Select the instance types that you want to be included in the report. You can select multiple instances. If not selected, all the instance types are considered in the report.
Cost
Specify the cost threshold for the clusters.
Notifications
Email to
Email ID to send the notification when the report is generated. You can specify multiple email IDs with comma separation. You can also select the Attach Files to Email checkbox to receive the reports as an attachment.
Advance Options
Profile Memory
Select this option if you want to generate logs that help to troubleshoot scenarios where the report takes excessive time to generate or fails to generate.
Caution
The option will increase the report run time excessively.
Click OK. The generated reports will be listed under Reports on the App UI.
Select the generated report and then click Run. After the report is successfully run, the details of the report runs are listed in the Run box on the right.
Click the following:
HTML files link to view the report details.
Input parameters link to view the parameters you chose to run the report.
Log file link to view the logs of the report.
The detailed Databricks cost breakdown report is shown.
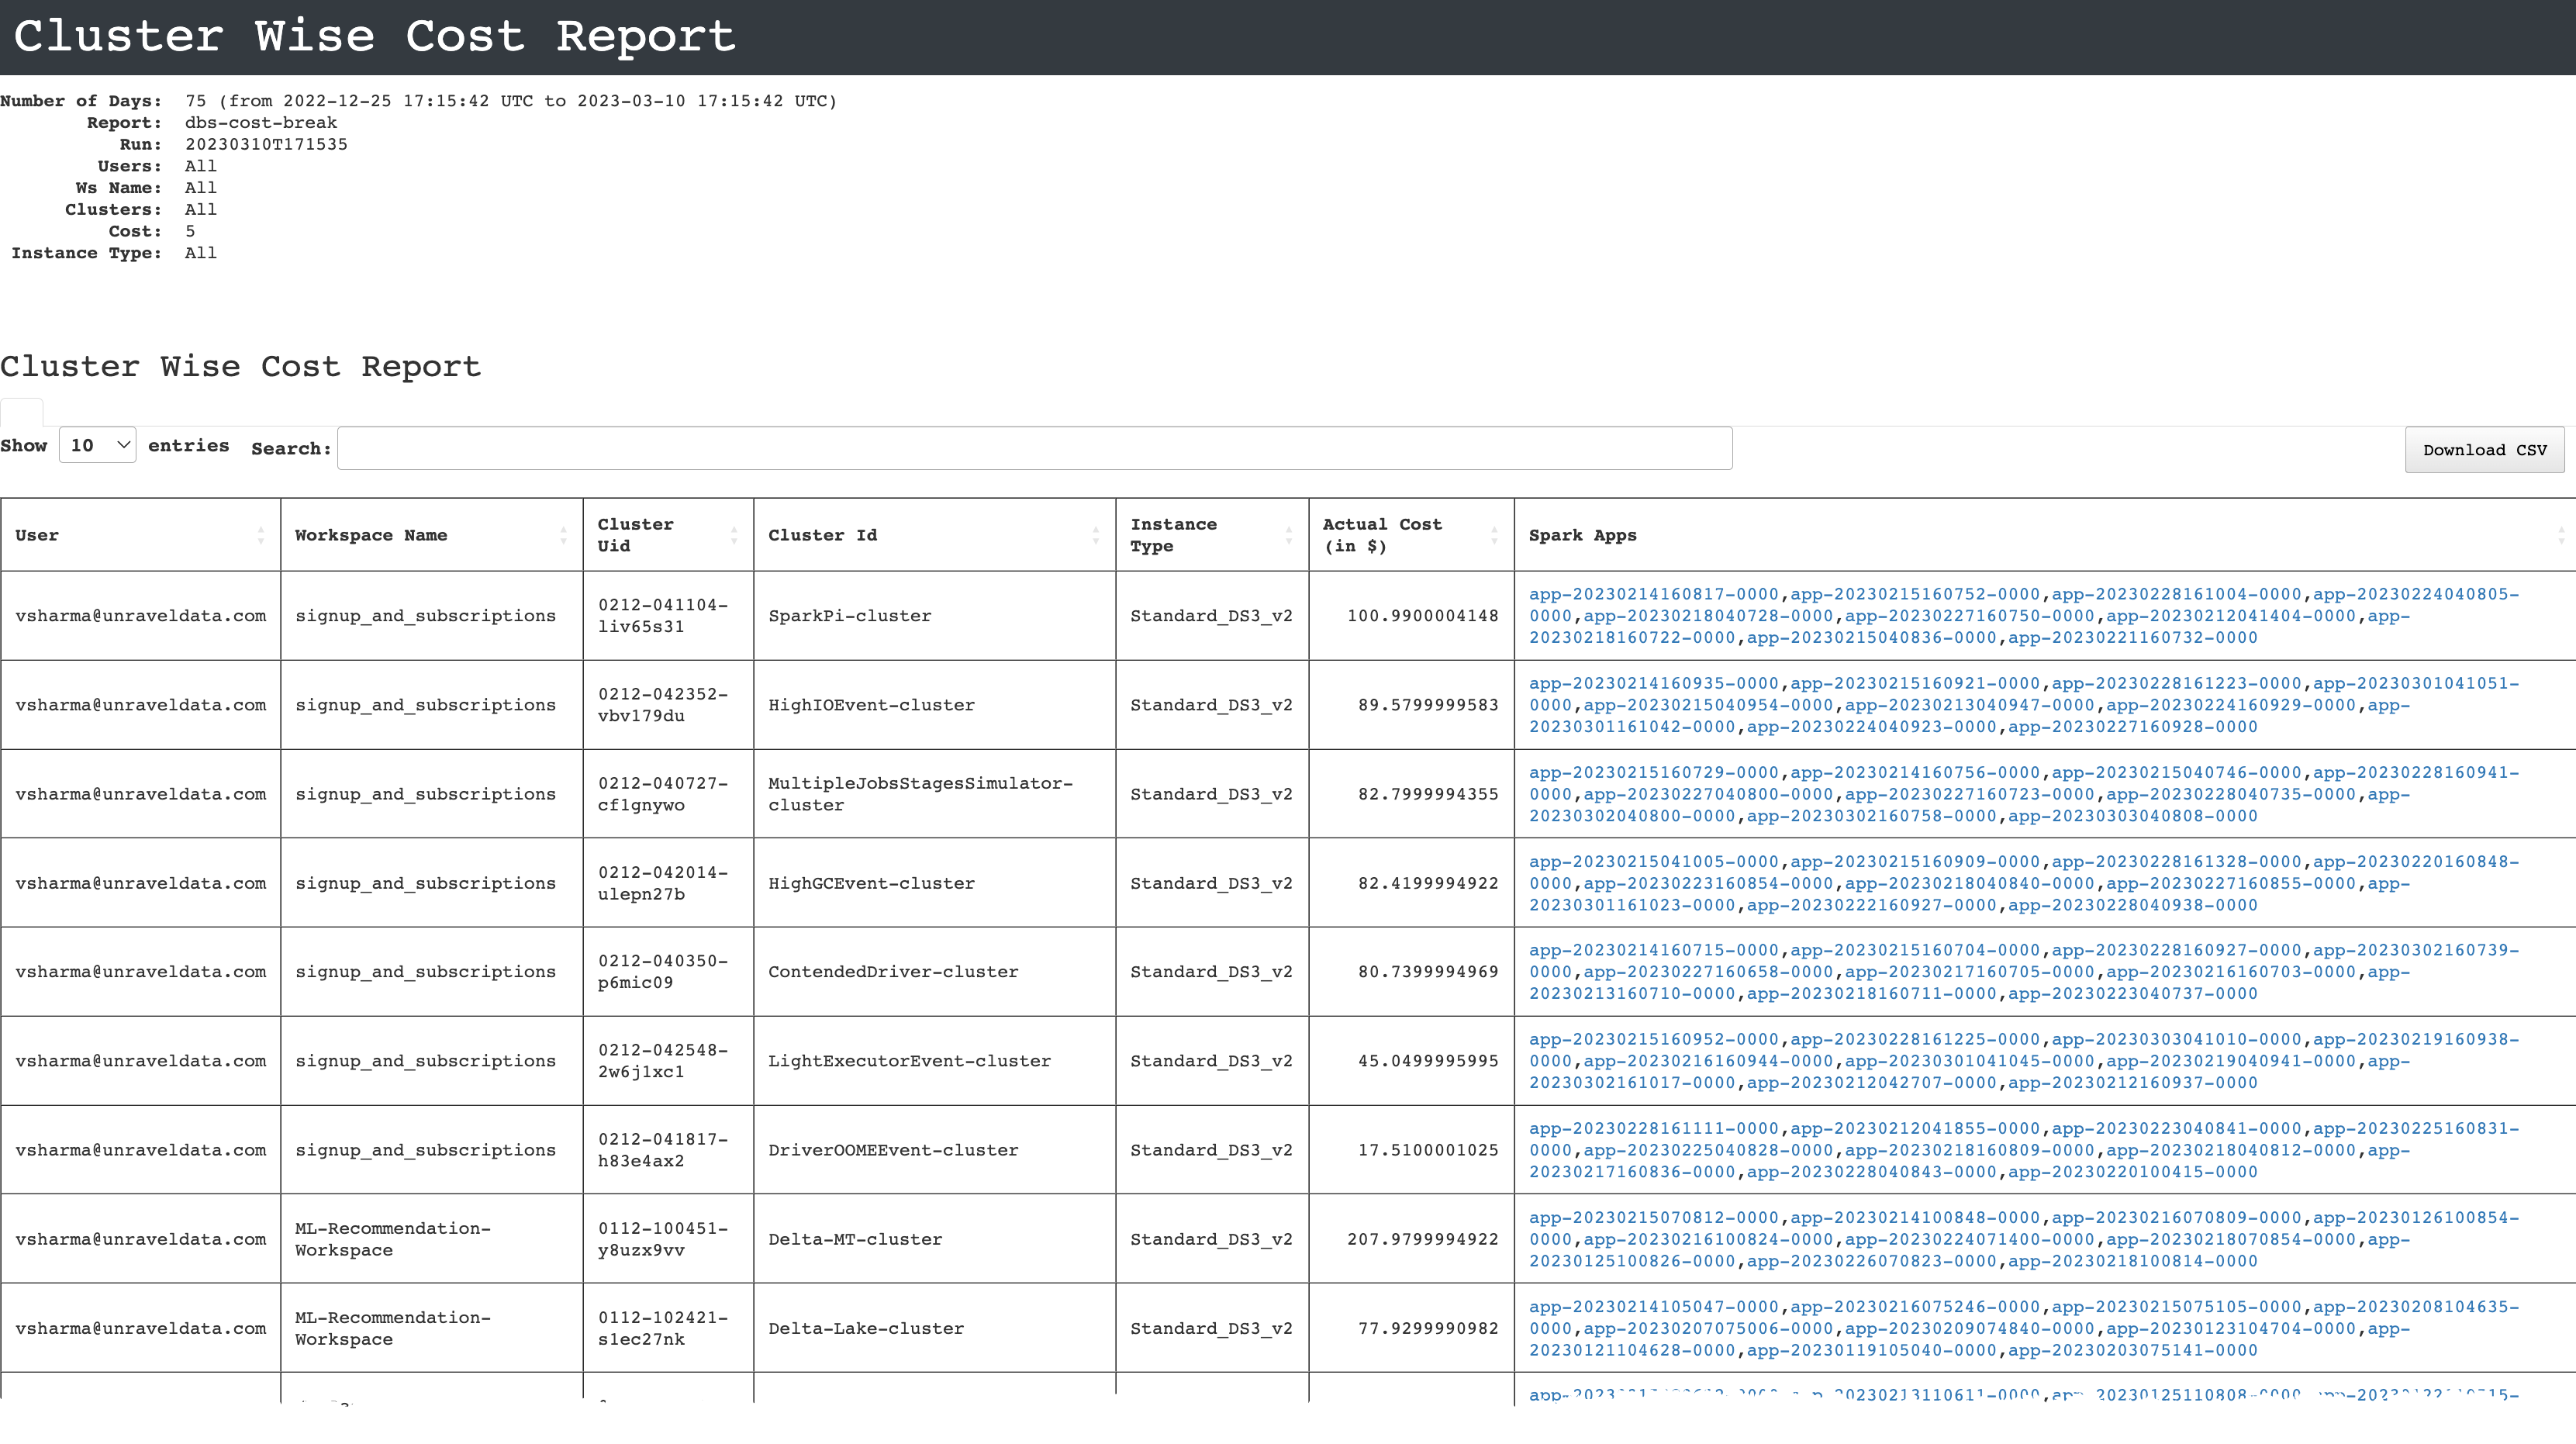
The following columns are included:
Users: All the selected users are listed.
Workspace name: All the selected workspaces are listed.
Cluster UID/ID: The cluster uid/ID of the selected clusters are listed.
Instance type: All the selected instance types are listed.
Actual cost: The aggregate cost of all the jobs.
Spark links: Links to Spark apps.