Deep user analysis report
The Deep user analysis report presents a comparison of the resource utilization across a dataset of baseline and target apps as specified. A detailed analysis of the resource consumption for each selected user across the duration, IO, memoryseconds, compute time, and cost metrics are shown. This report is useful to analyze the performance of users for Spark, Impala, Hive, and MR data.
Click Generate Reports > New button.
In the New Report dialog box, enter the following details.
Items
Description
General
Name
Name of the report.
Environment
Select your platform. The reports corresponding to the selected platform are only listed in the Report type. If you select the All option, all the reports are listed.
Report type
Type of report. Select Deep user analysis.
Schedule
Select the checkbox to schedule the report to run daily, hourly, weekly, or monthly. You can also set the schedule using a cron expression. You can expand the Example drop-down and select the corresponding options. The next four sample run times are displayed for reference.
Retention
The number of days to retain the report files. All the reports are stored in the
unity-one/src/assets/reports/jobsdirectory. After completion of the retention period, the report files are automatically purged.Parameters
Users
Select users to generate the Deep user analysis report. If not selected, all users are considered for the report.
Queues
Select the queues that you want to include in the report. You can select multiple queues. If none are selected, all queues detected will be included in the report.
Clusters
Select the clusters that you want to include in the report. You can select multiple clusters. If none are selected, all clusters detected will be included in the report.
TopK
The threshold of the highest-ranking score, which must be shown for the metrics chosen for the applications.
Trend interval
Select the interval to aggregate the metrics for the trend graphs. The options are daily, hourly, weekly, or monthly. If not selected the interval will be computed internally based on the Look Back days.
Tag Filter
The option to filter based on tags, if not selected then all tags will be considered. You can specify the tags as follows:
Key: Specify the tag name. A single key can have more than one value.
Values: Specify the values based on the selected tag name. If the value is empty, all the values for the selected key are considered.
Click the Add button to add multiple key-value pairs. Click the Remove button to remove a key-value pair.
Features Filter
Filters the key-value features fetched from feature indices. The custom features/fields can be added in features indices by modifying the
customizable_feature.py. Those features will be available here.Increased Thresholds/Decreased Thresholds
Specify the threshold percentage for the following metrics. This percentage indicates an increase or decrease in apps for the following metrics:
Duration threshold
Specify a threshold for the duration. If the duration exceeds the specified threshold, it will indicate an increase in duration. The default value is 5%.
IO threshold
Specify a threshold for IO. If the IO exceeds the specified threshold, it will indicate an increase in the IO. The default value is 5%.
Compute threshold
Specify a threshold for computation. If the computation exceeds the specified threshold, it will indicate an increase in the computation. The default value is 5%.
MemorySeconds threshold
Specify a threshold for memory in seconds. If the memory exceeds the specified threshold, it will indicate an increase in memory. The default value is 5%.
Baseline / Target
Specify the time range for baseline and target usage for metrics.
Look Back
Specify the period range in days when you can select applications for report generation.
Use Exact Date-Time
Check this option and select the from and to dates and times to schedule the report for the exact time range specified. The only anomaly with this option is that the same report will be scheduled to be generated repeatedly.
Notifications
Email to
Email ID to send the notification when the report is generated. You can select the Attach Files to Email checkbox to receive the reports as an attachment.
Advanced Options
Profile memory
Select this option if you want to generate logs that help to troubleshoot scenarios where the report takes excessive time to generate or fails to generate.
Caution
The option will increase the report run time excessively.
Click OK. The generated reports will be listed under Reports on the App UI.
Select the generated report and then click Run. After the report is successfully run, the details of the report runs are listed in the Run box on the right.
Click the following:
HTML files link to view the report details. A link is displayed for each user that you wanted to analyze.
Input parameters link to view the parameters you chose to run the report.
Log file link to view the logs of the report.
A detailed report is generated for each user specified in the parameters, which contains resource utilization comparisons between baseline and target apps. This report comprises the following sections:
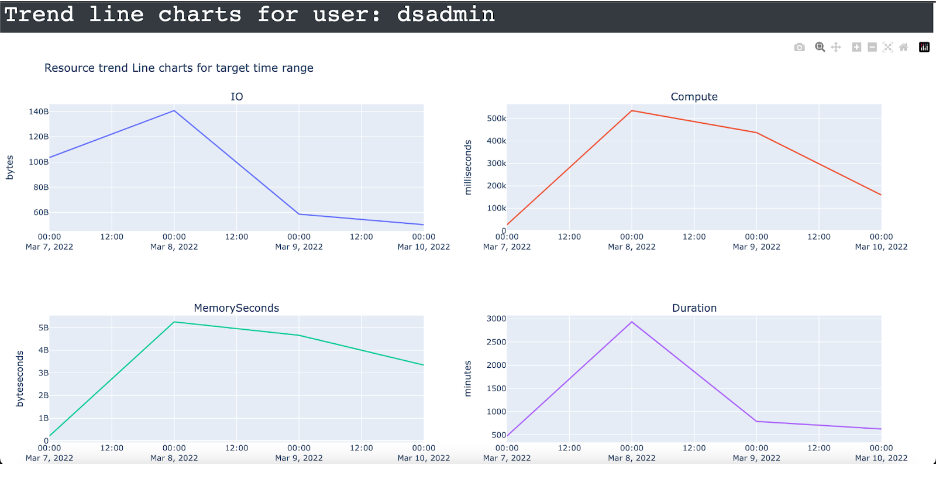
Trend line chart of the user: The trend line graphs are presented for each metric (IO, compute, memory second, and duration) in the target time range, where Y-axis is the resource metric and X-axis is the Trend interval.
Analysis of the application kind: The analysis of the application kind is presented, where the application kind can be Hive, Impala, Spark, or MR. For each metric (IO, compute, memory second, and duration) a pie chart is shown, which classifies the count/percentage into the following:
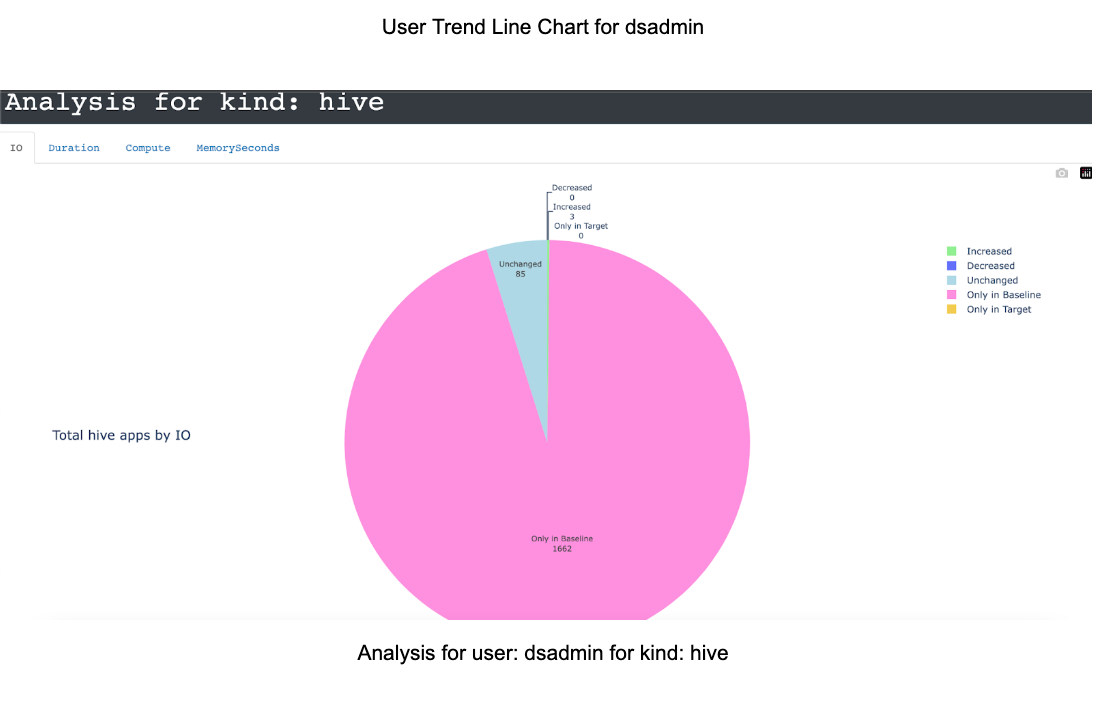
Increased Apps: Apps that had increased metrics value across the target time range. This is derived using the increased threshold parameters for each metric.

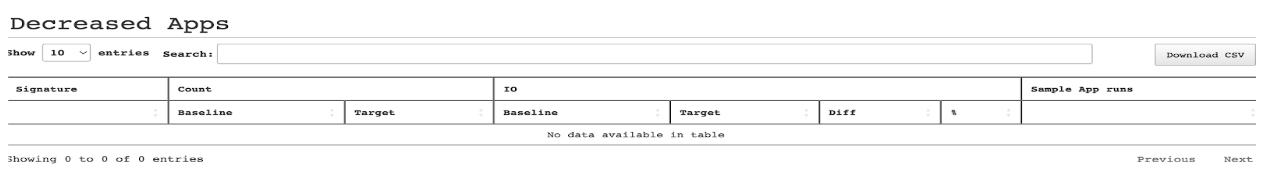
Decreased Apps: Apps that had decreased metrics value across the target time range. This is derived using the decreased threshold parameters for each metric.
Unchanged Apps: Apps that had no changes in the metrics across the target time range. This is derived using decreased and increased threshold parameters for each metric.
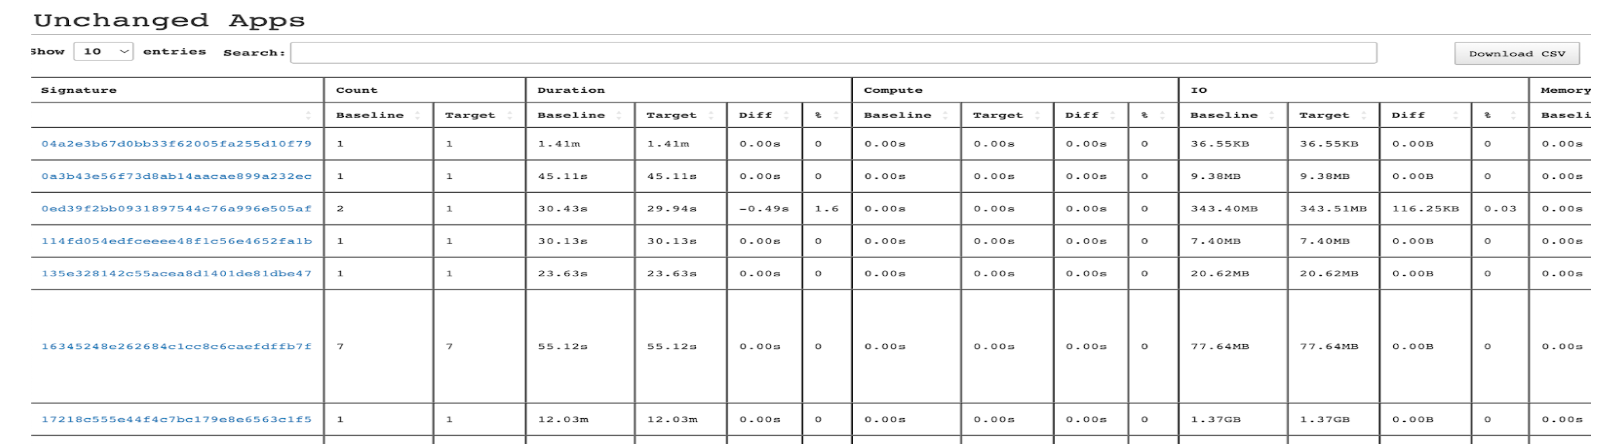
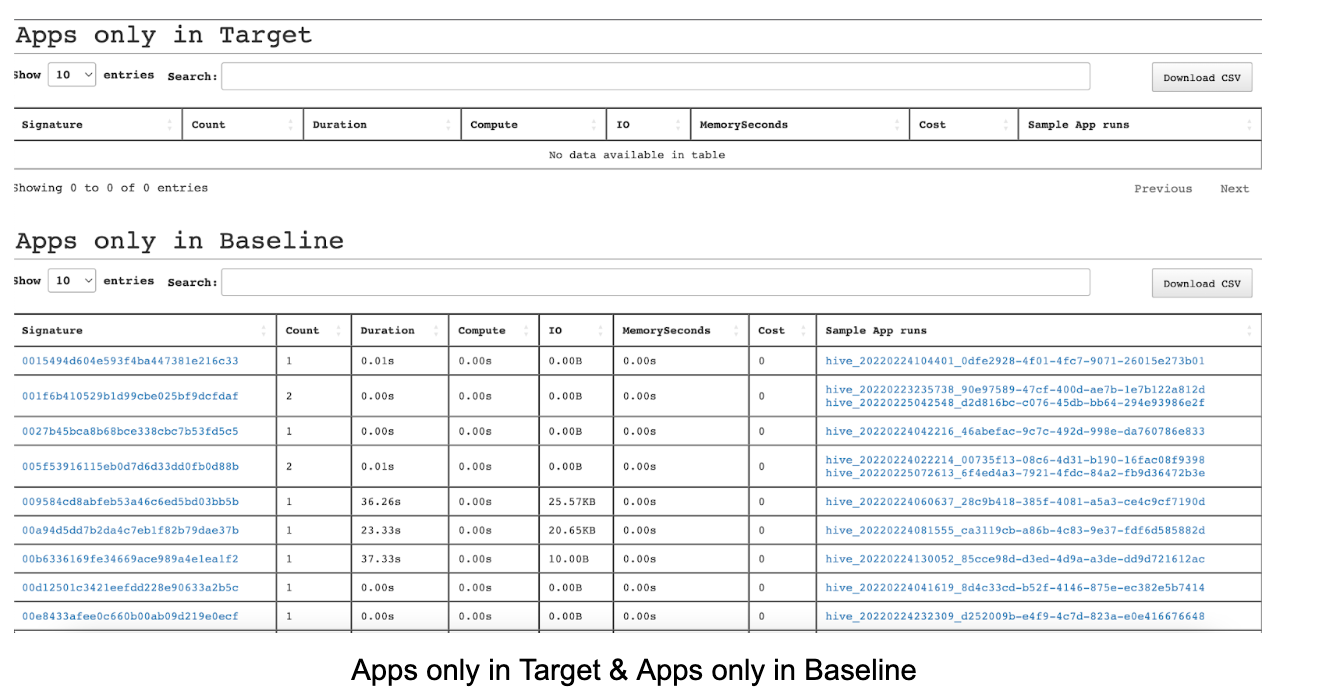
Apps only in Target/Baseline: Apps that are only in the target/baseline time range.
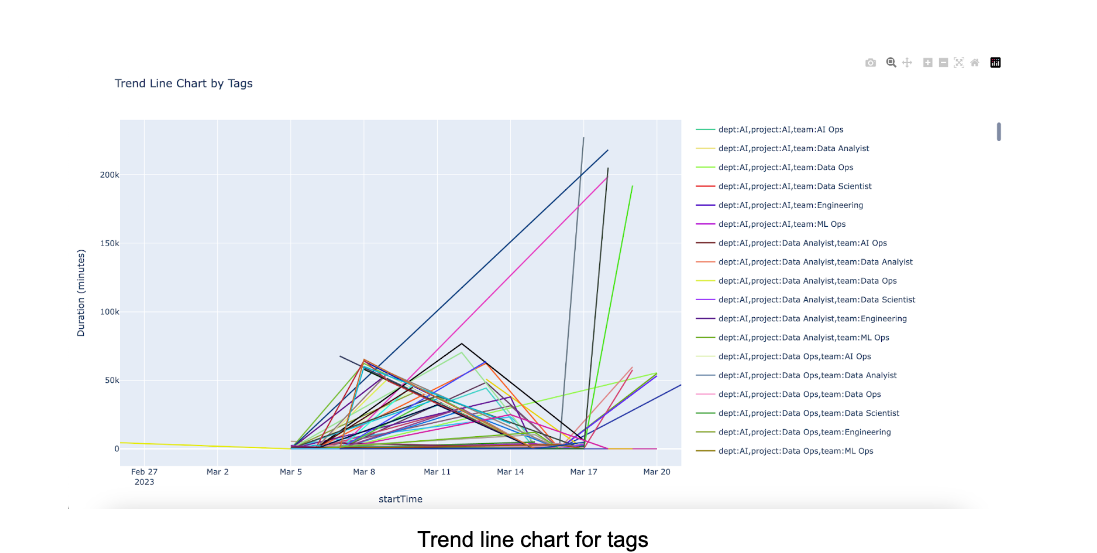
Trendline chart: The trendline chart by tags.
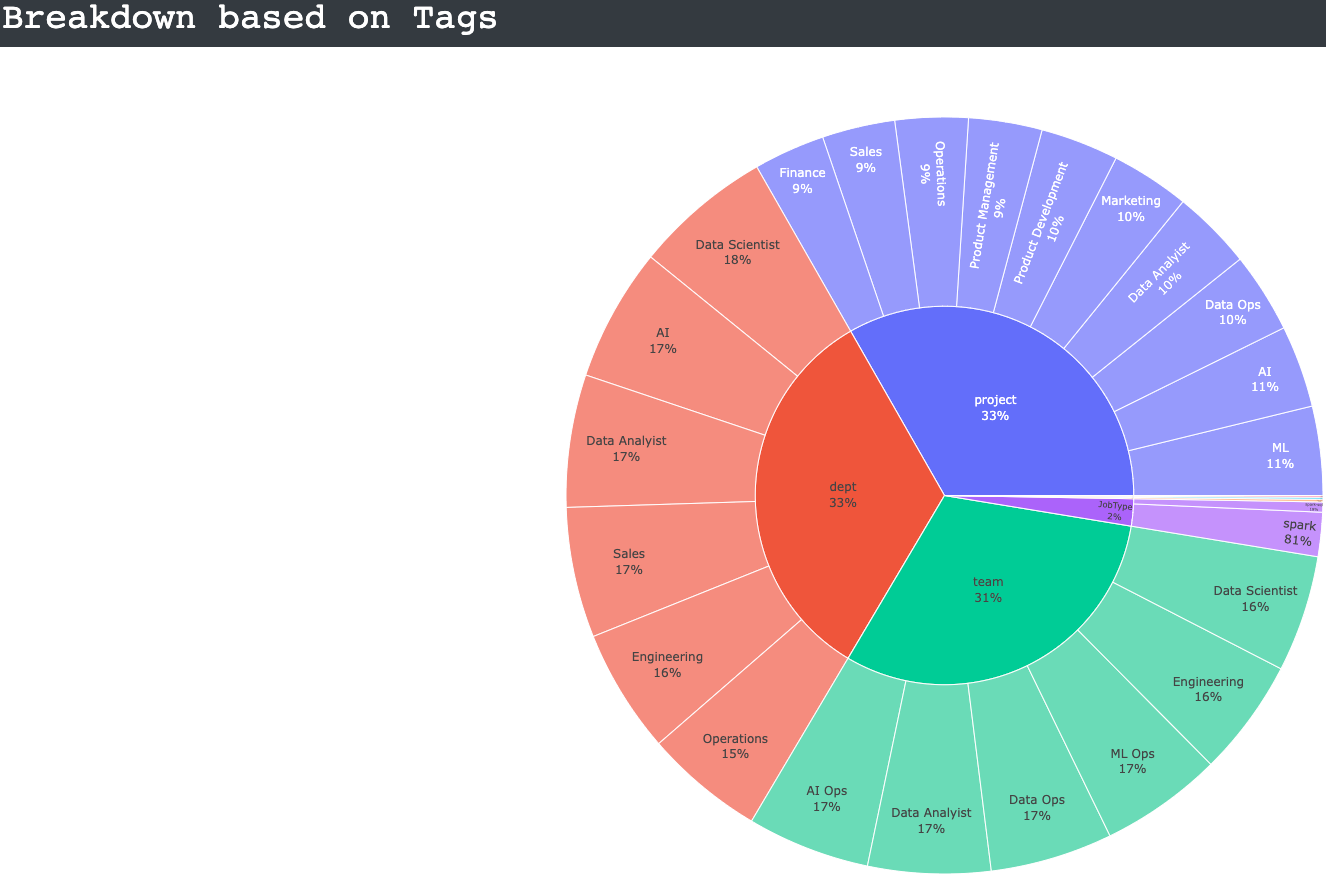
Sunburst chart: The sunburst chart for usage by tags.
Viewing metrics and insights
Open the report and click any app link from the Signature column.
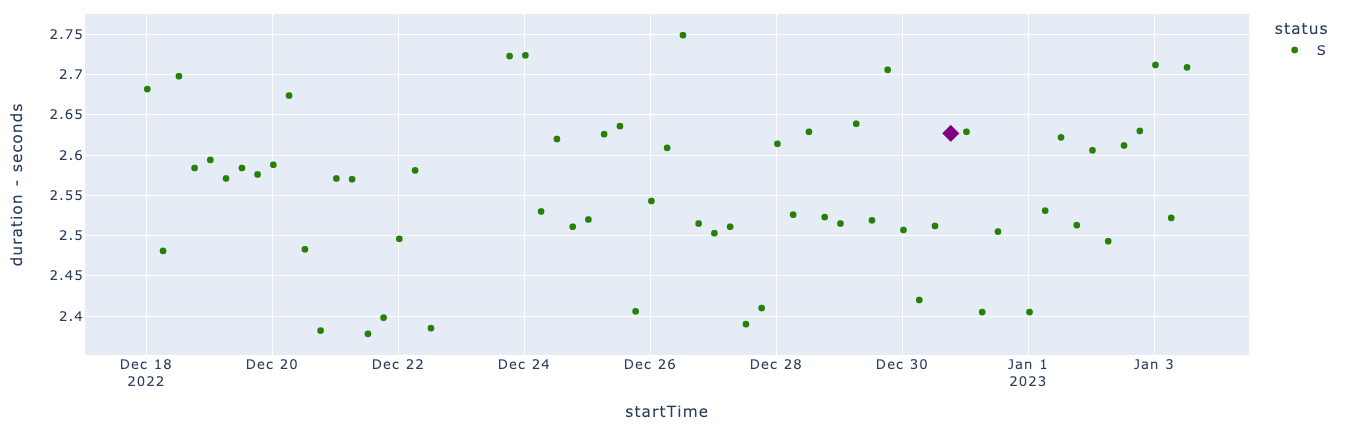
The Metrics tab displays the trend charts for the Duration, IO, MemorySeconds, and CPU metrics. The dots plotted on the trend charts are the app runs. The app info is provided in the right panel.
You can select any of the following features to view the metric trends:
status
cluster id
cluster UID
Click any dot on any of the Metric trend charts. This becomes the app target run. The details of the app target run appear in the App Run info panel on the right.
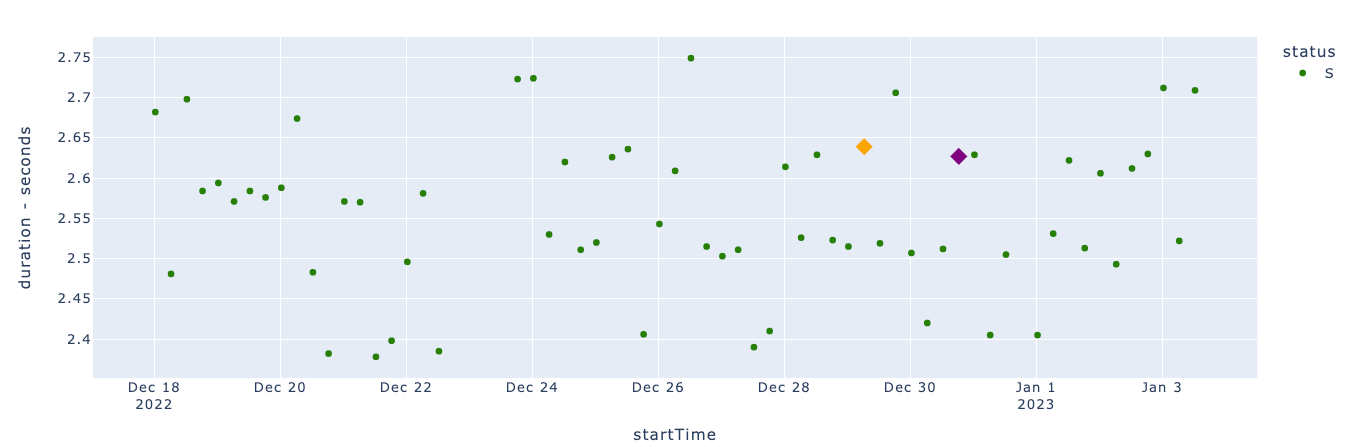
In the App Run info panel, click the ID link. This is the ID link of the app target run. The Metric tab is shown with the app target run you have chosen in a different color. The details of the app target run are displayed in the App Target Run panel on the right. Click the View in Unravel link to view the app's details in Unravel.
Select any dot (other than the dot for the app target run) on any of the Metric trend charts. This becomes the app baseline run. This is highlighted in a different color. The details of the app target run are displayed in the App Baseline Run panel on the right. Click the View in Unravel link to view the app's details in Unravel.
In the App Baseline Run panel, click Compare.
Select an app from the App Type options:
Hive on Tez
Spark
Impala
From the Cluster, select a cluster.
Specify the app runs that you want to compare.
Baseline App Run: Specify the ID of the baseline app.
Target App Run: Specify the ID of the target app with which you want to compare the baseline app.
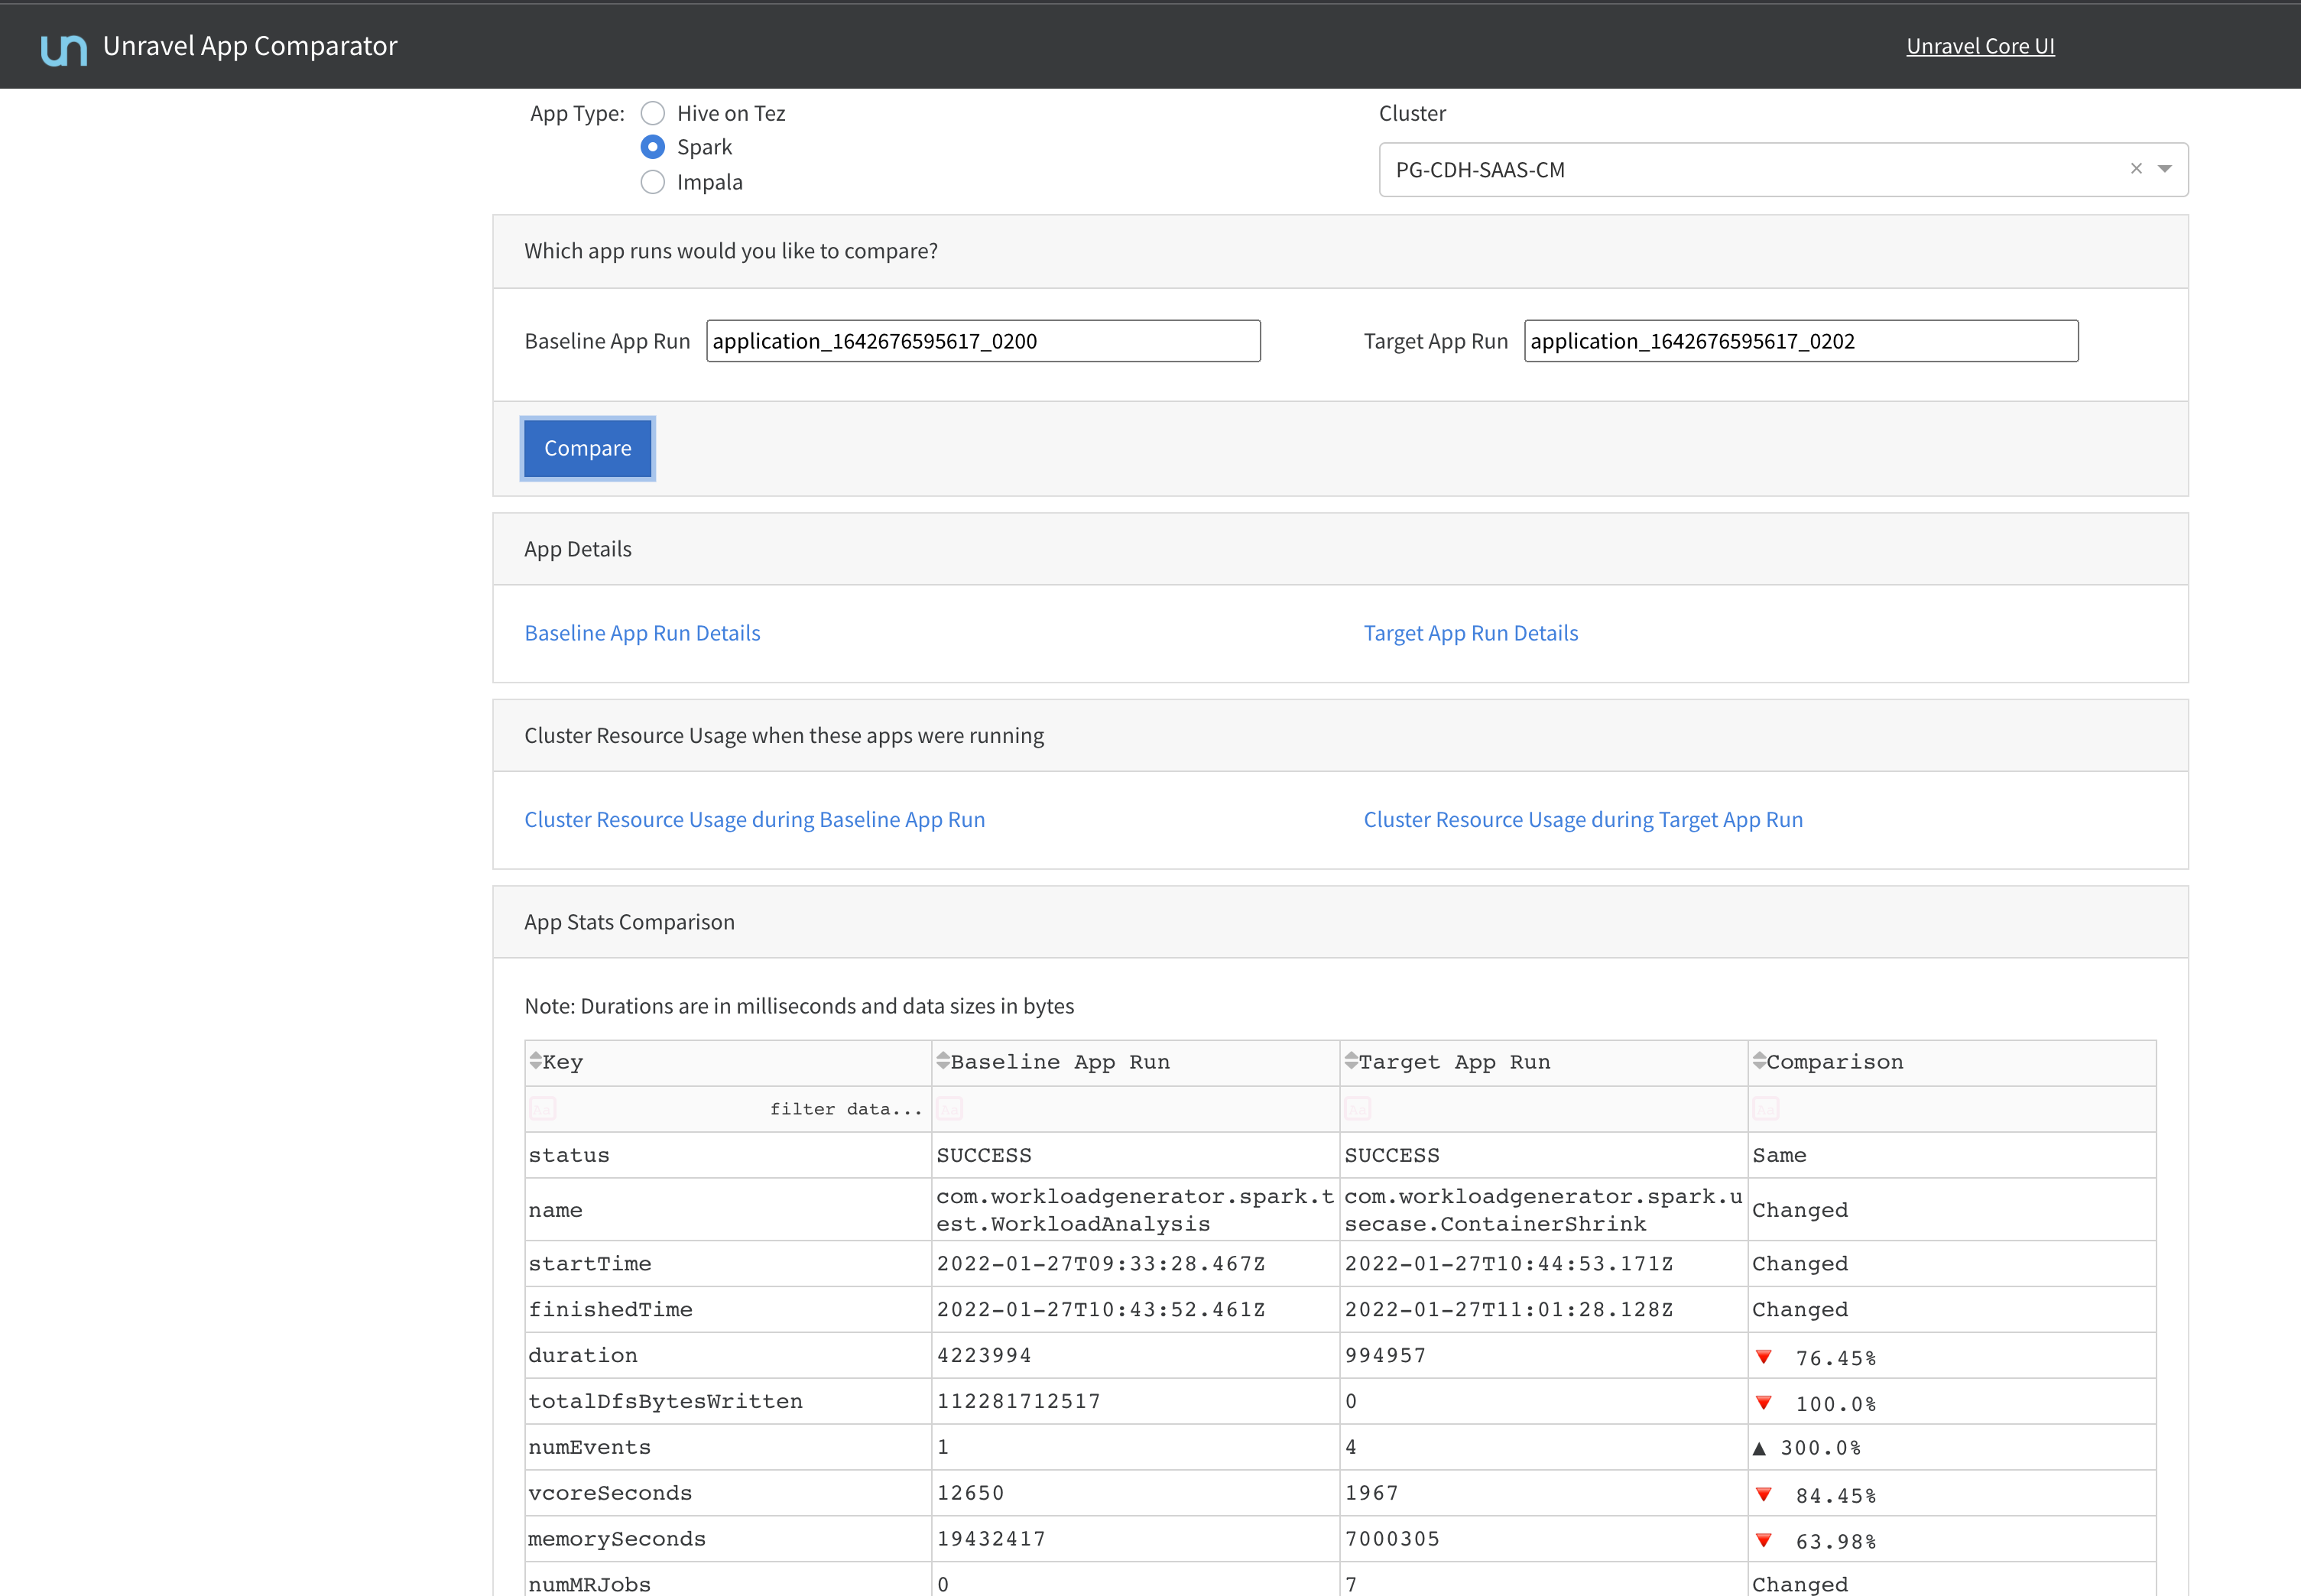
Click Compare. The following app details are given for the baseline and target app run:
App details
Cluster resource usage when these apps were running
App statistics comparison details
App config comparison details
Query string comparison details
Query plan comparison details
In the App Baseline Run panel, click Refresh Insights. The insights are provided in the following sections.
Baseline comparison
The results of the comparison are displayed.
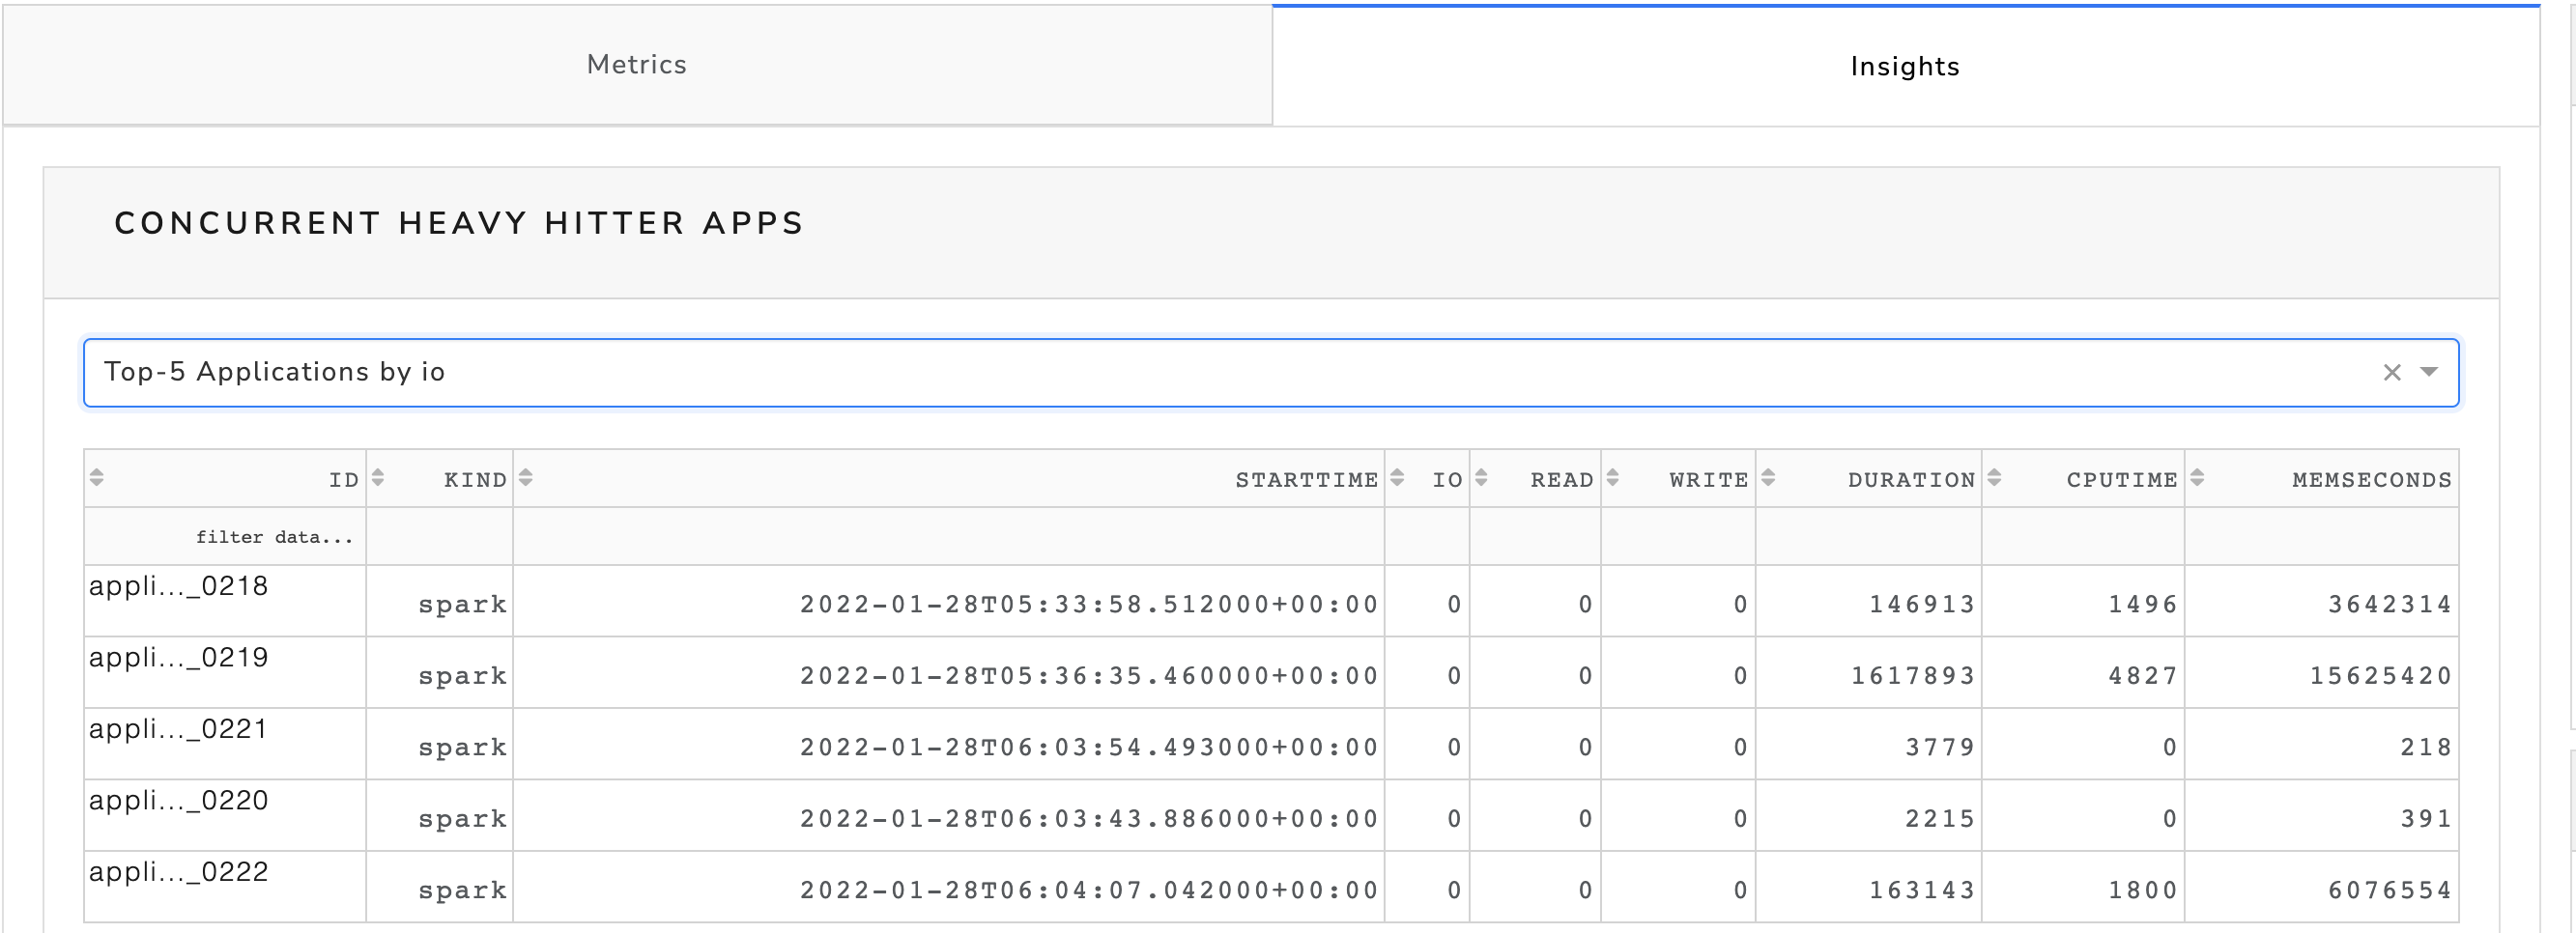
Concurrent heavy hitter apps
This section will show up only when the information is available.
Select this option to view the top five applications in a specific category.
Click the Concurrent heavy hitter apps option.
Select any option from the Top-5 Applications option.
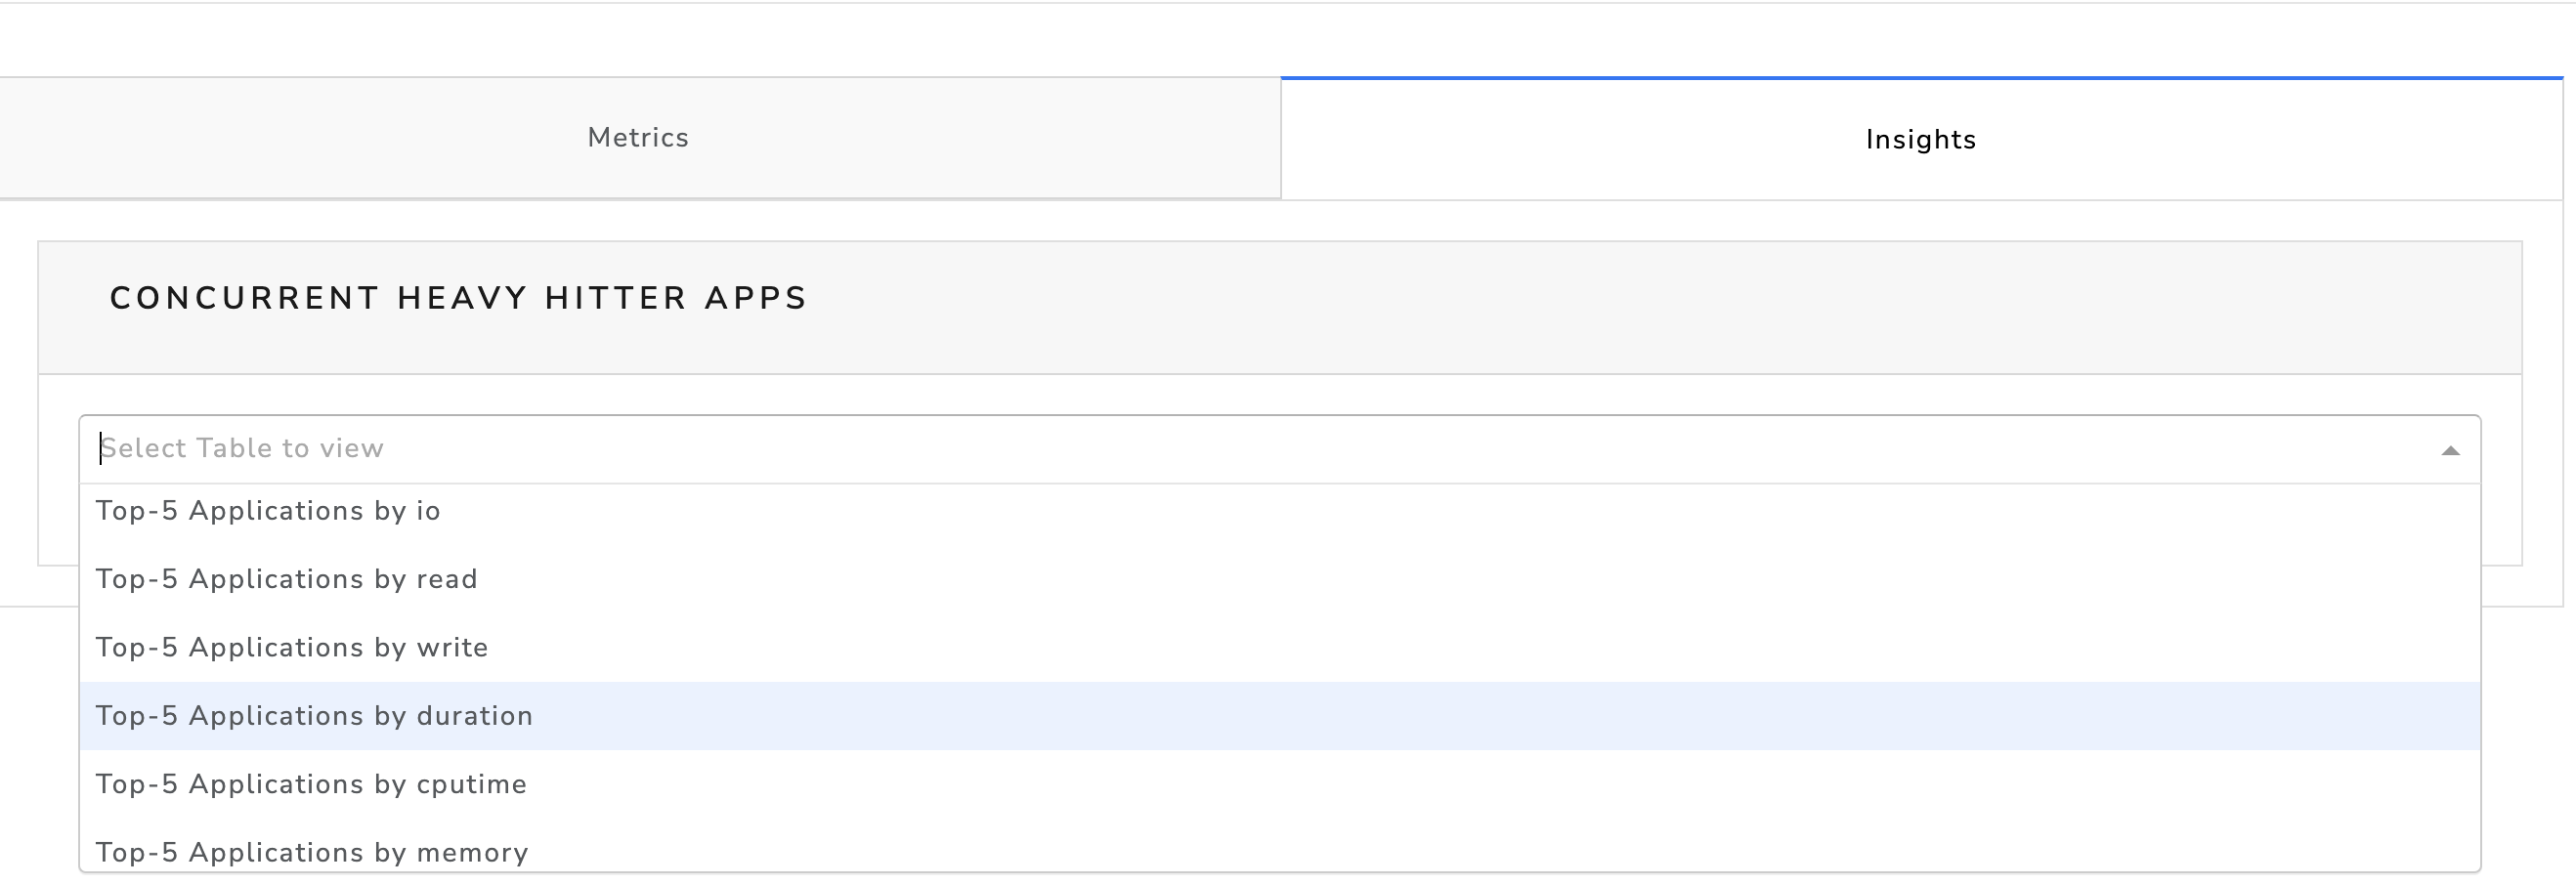
The corresponding details are displayed.