Static Code Search report
The Static Code Search Report enables users to analyze Spark applications over a specified time range by extracting program-related metadata. This report helps understand application behavior and debugging issues and optimizes Spark workloads.
Key features
Application Metadata Analysis: Extracts key program details such as application ID, user, queue, and cluster information.
Code Inspection: Displays Spark application code, allowing users to review logic, identify inefficiencies, and detect optimization opportunities.
Execution Status Tracking: Monitors job execution states, including start time, finish time, and final status.
Cluster Utilization Overview: Identifies which clusters applications ran on, helping in resource planning and troubleshooting.
Generating a new report
The following are the fields required to generate a Satic Code Search report:
Report Name: Name assigned to the report for identification.
Retention Period (Mandatory): Defines how long the report is retained before deletion.
Lookback Period (Mandatory): Specifies the historical timeframe to analyze.
Search String (Optional): Filters program records based on a keyword or pattern.
Email ID (Optional): Specifies recipients for automated email notifications.
For details on the other fields, refer to the following section:
Using the report
The Static Code Search Report provides an in-depth analysis of Spark applications, helping users optimize execution patterns, troubleshoot issues, and enhance performance. By leveraging metadata insights, code visibility, and execution tracking, this report is a valuable tool for monitoring and improving Spark workloads.
The report presents Spark application details in a structured format with the following fields:
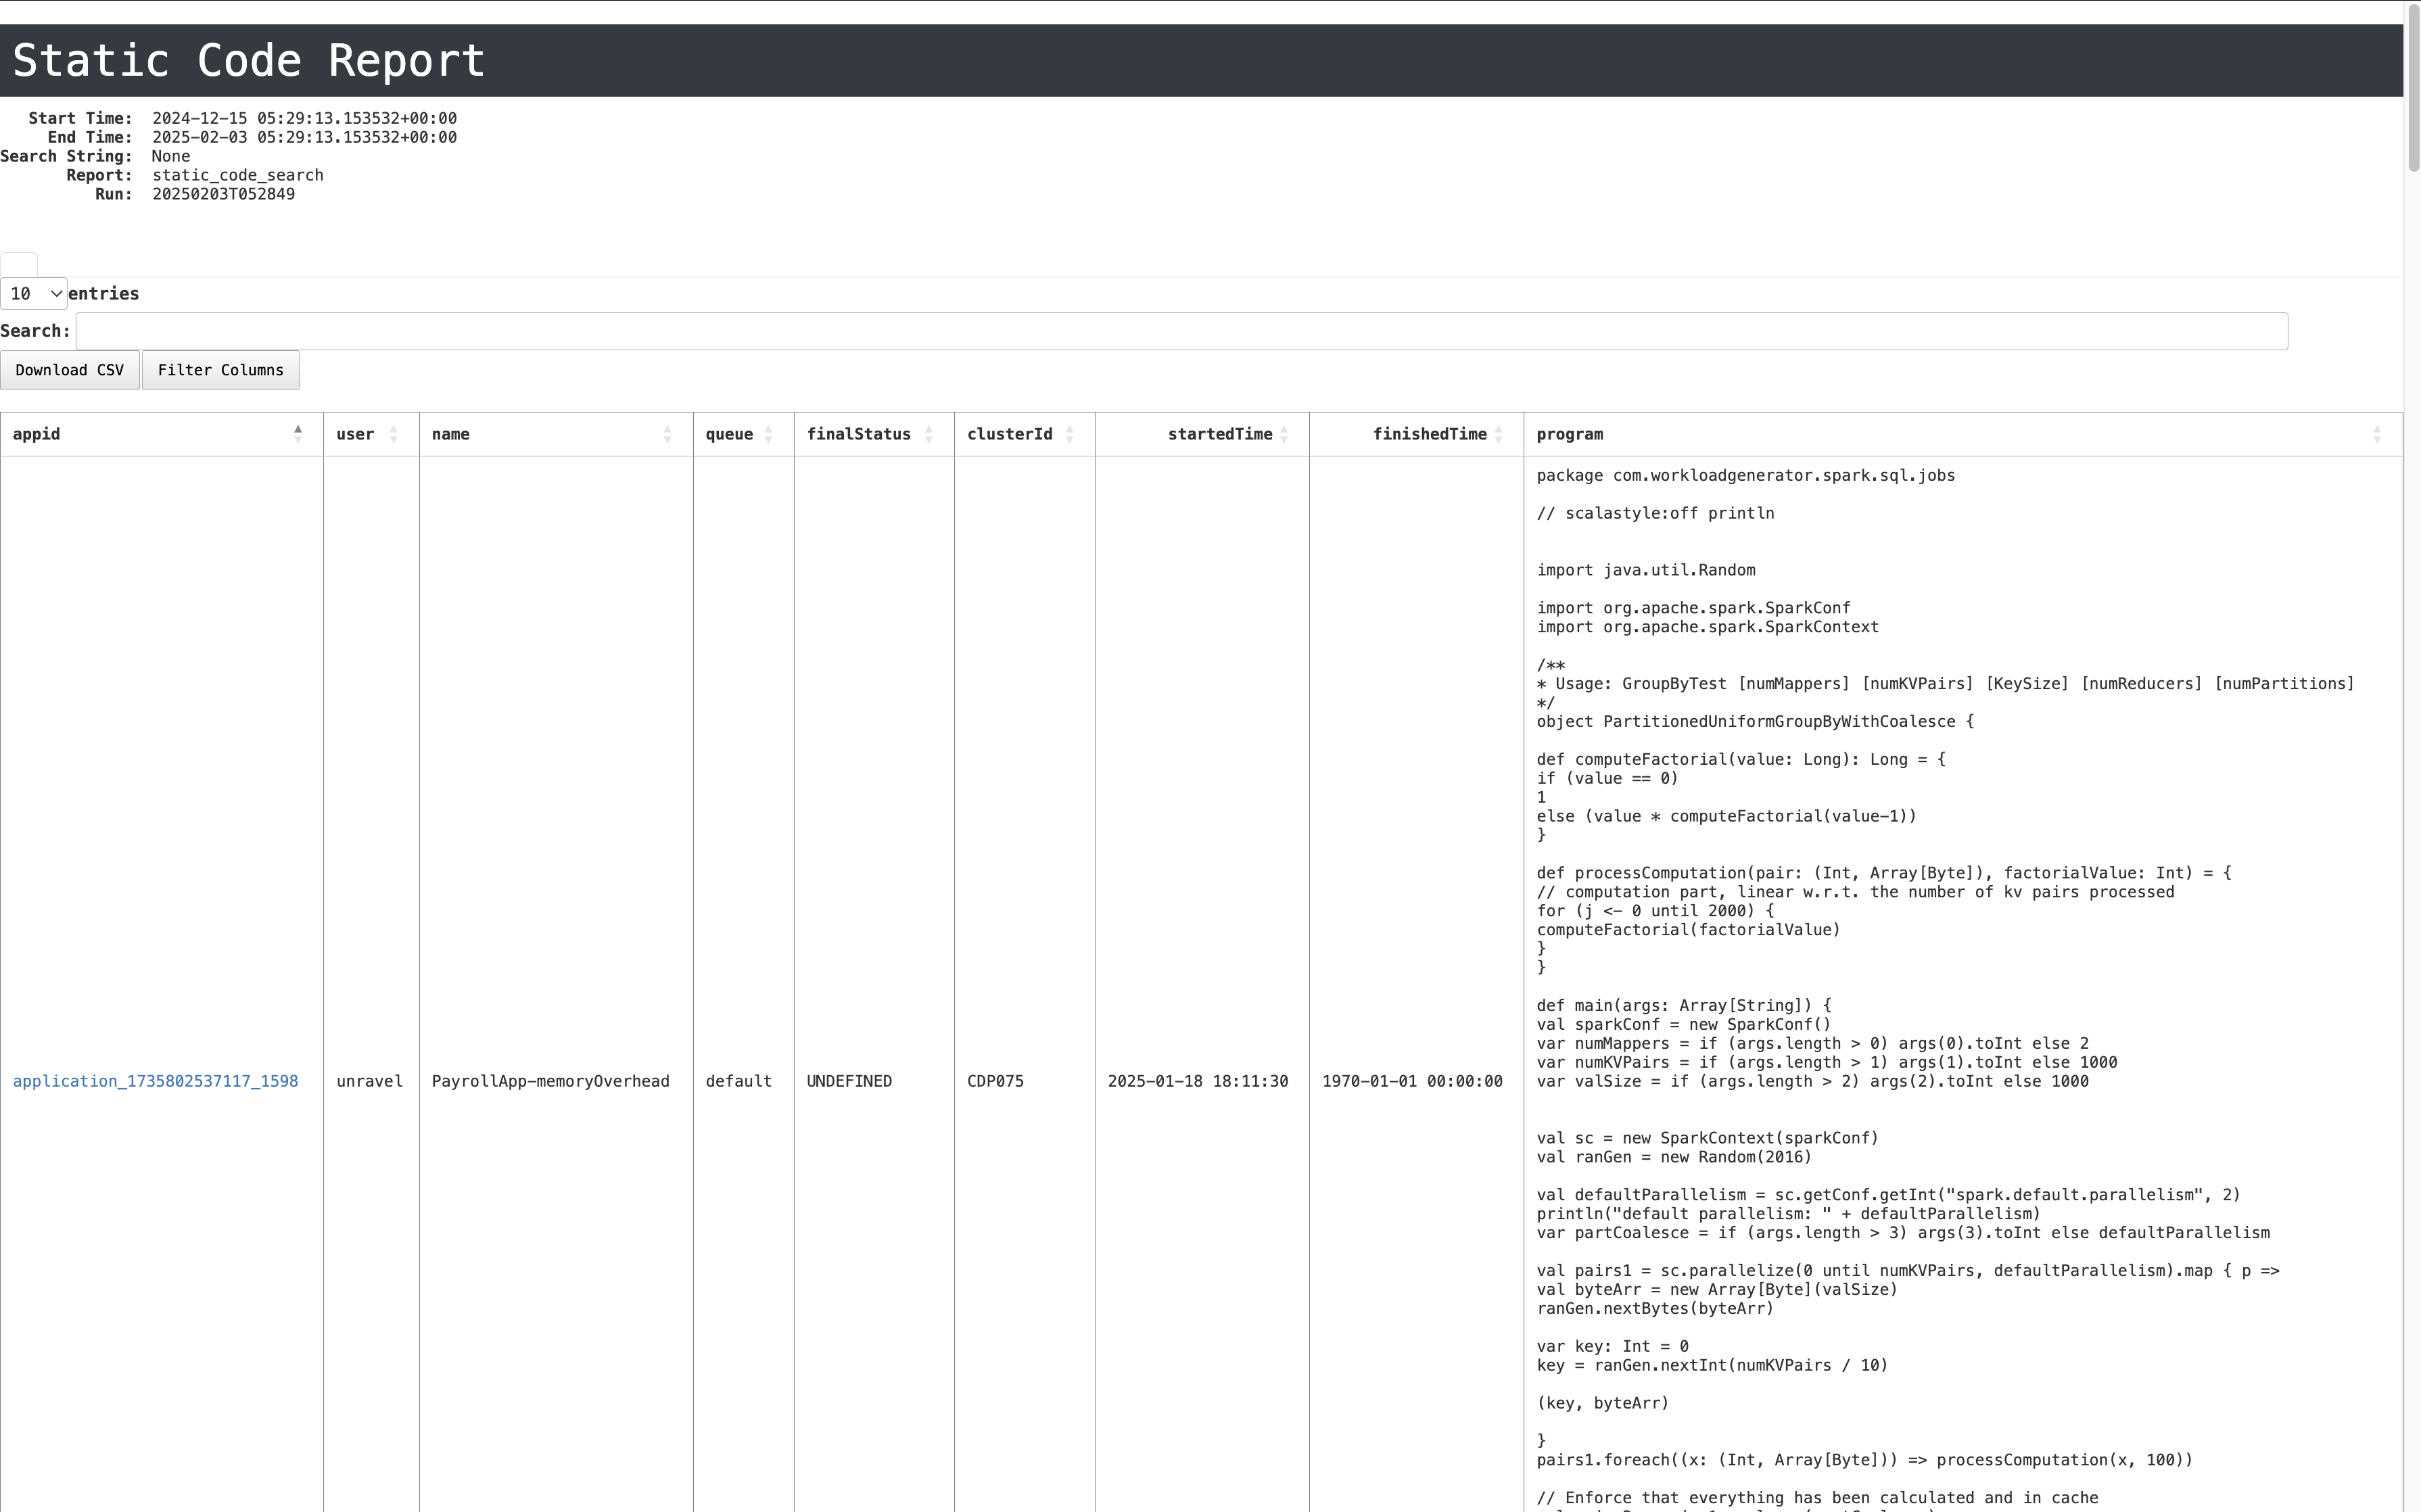
App ID: Unique identifier for the Spark application.
User: Name of the user who executed the application.
Name: Name assigned to the Spark application.
Queue: The queue in which the application was executed.
Final Status: Indicates whether the application completed successfully or failed.
Cluster ID: Identifier of the cluster where the application was executed.
Started Time: Timestamp marking when the application started.
Finished Time: Timestamp marking when the application ended.
Program: The actual Spark program executed, including its logic and configurations.