Troubleshooting and Tuning
Open the Unity One app with the following URL and click the Go button on Troubleshoot & Tune Apps.
http://
<unravelhost>:8111In the Select The Application dialog box, enter any of the following options and click the corresponding Submit button:
App Run ID
Spark App Name
Pipeline ID
Pipeline Name
The following details are displayed.
Metrics tab:
The Metrics tab shows all the query runs of the application via trend graphs.
The
 dot on the graph represents the query run ID you entered to troubleshoot or tune. The
  dots represent all the other query runs of the application. You can view the discrepancies of the query run you want to troubleshoot by checking the dot on the following graphs compared to the other dots.
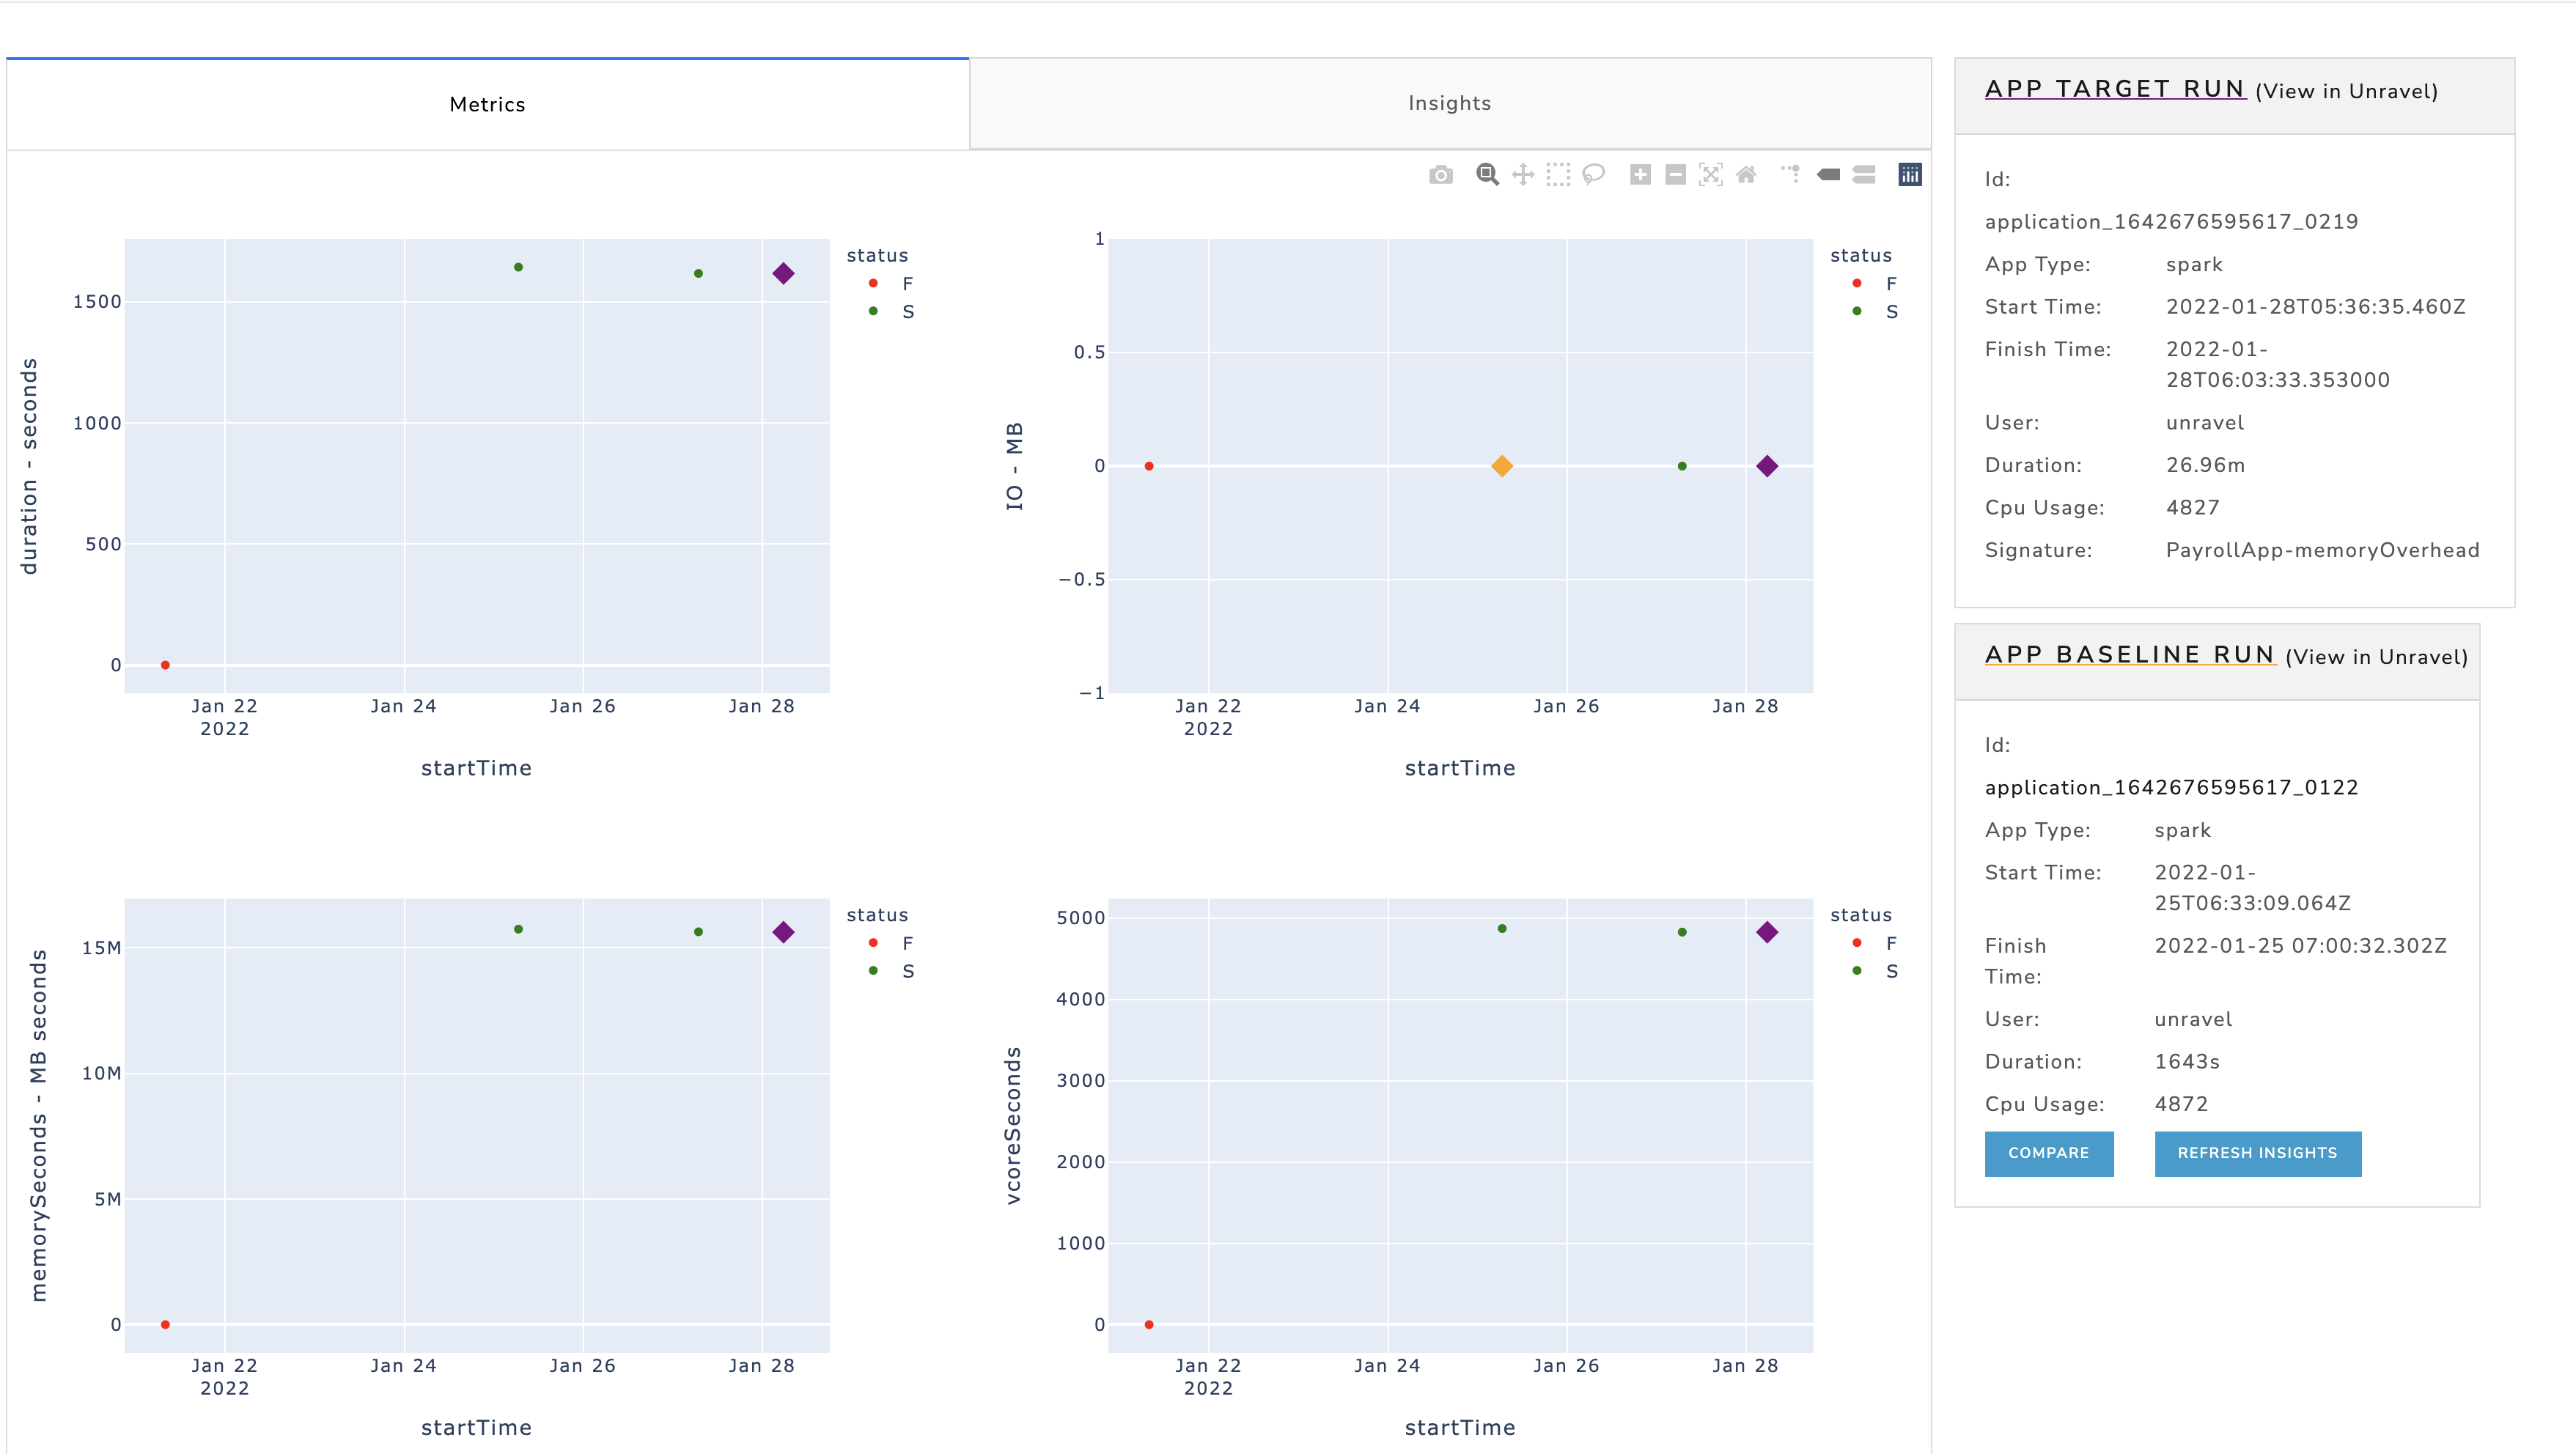
You can further compare the query run that you want to troubleshoot with any of the other query runs of the application in detail.
Check the App Target Run and App Baseline Run IDs and click Compare. The Compare analysis is presented in the following sections.
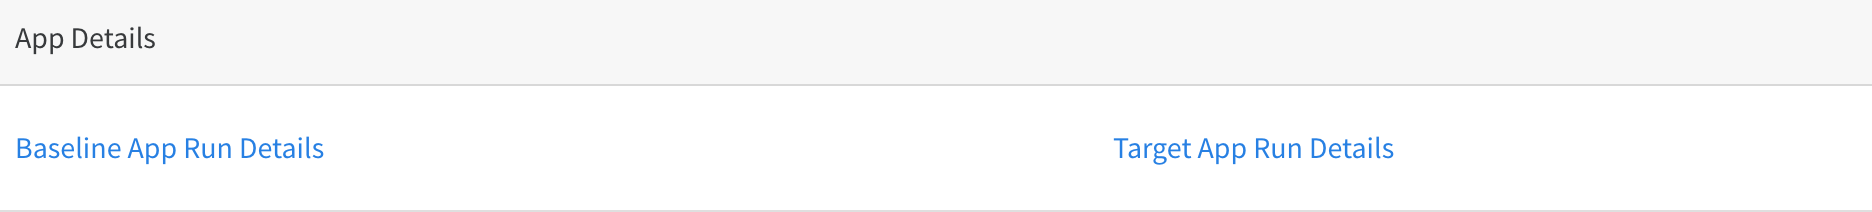
App Details
Click the links to view the corresponding Target App or the Baseline App details. The links open Unravel UI where you can view the application details.
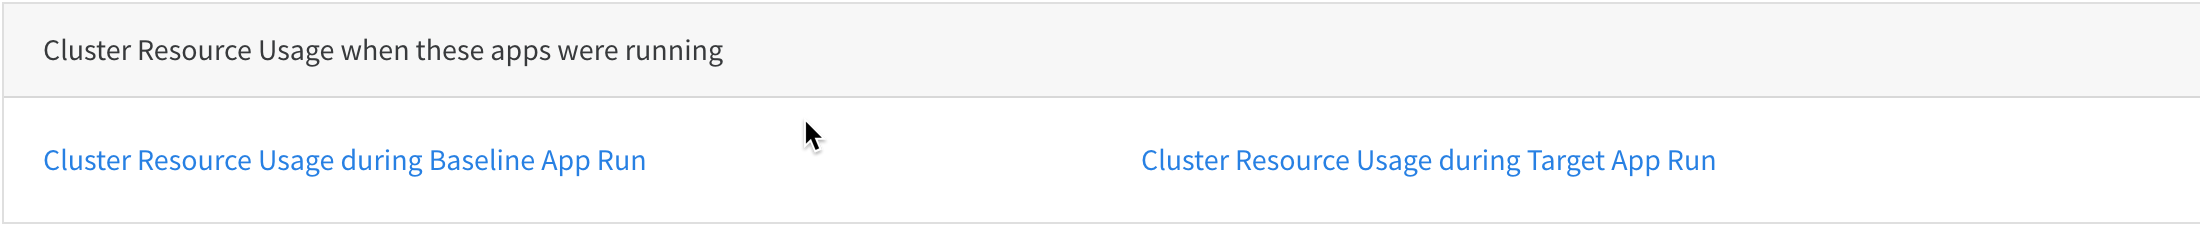
Cluster Resource Usage when these apps were running
You can check the resource usage details during the period when the Target App or the Baseline App was running. Click the links to view the Resource usage page on the Unravel UI for the Target App or the Baseline App.
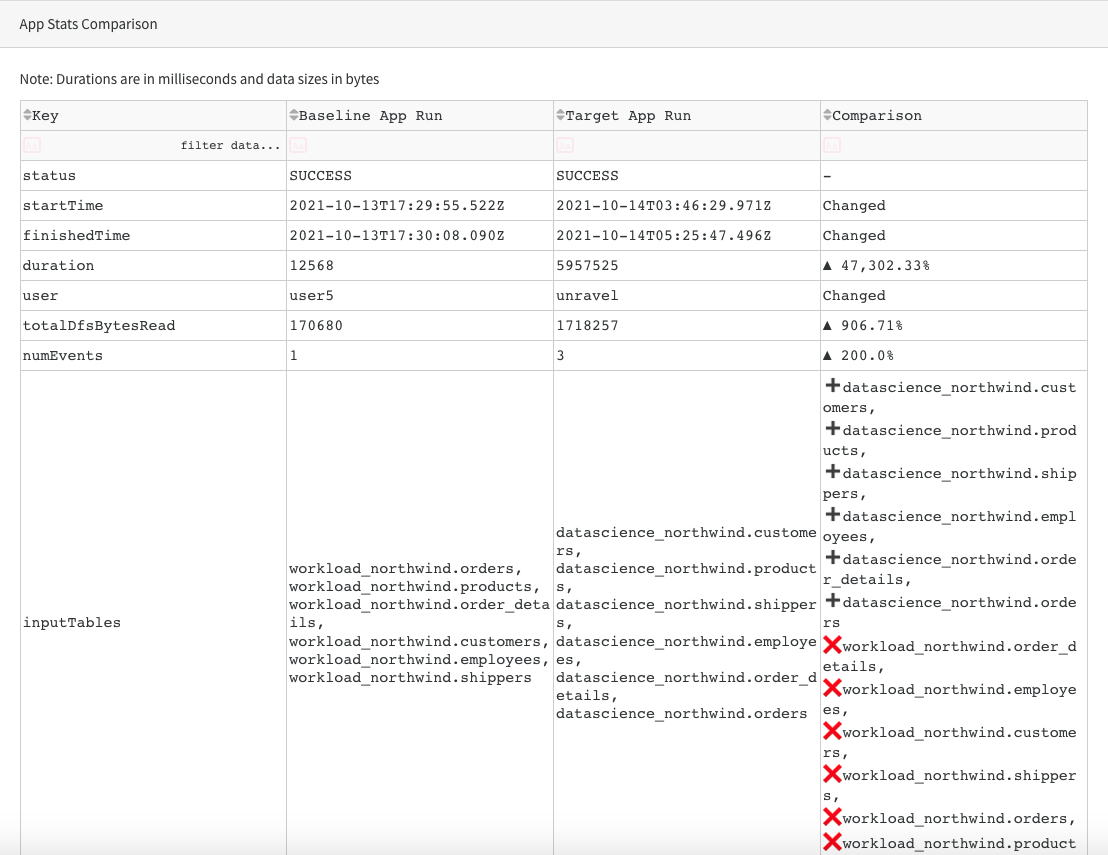
App Stats Comparison
You can view the list of those statistics of the Target App and the Baseline App wherever there has been a difference.
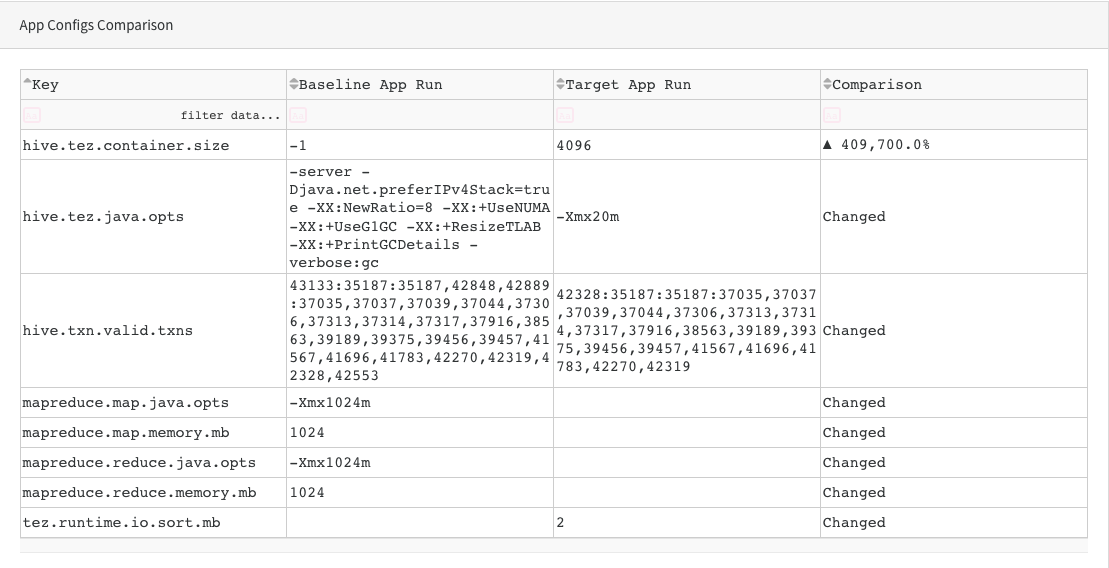
App Configs Comparison
You can view the list of those configuration details of the Target App and the Baseline App wherever there has been a difference.
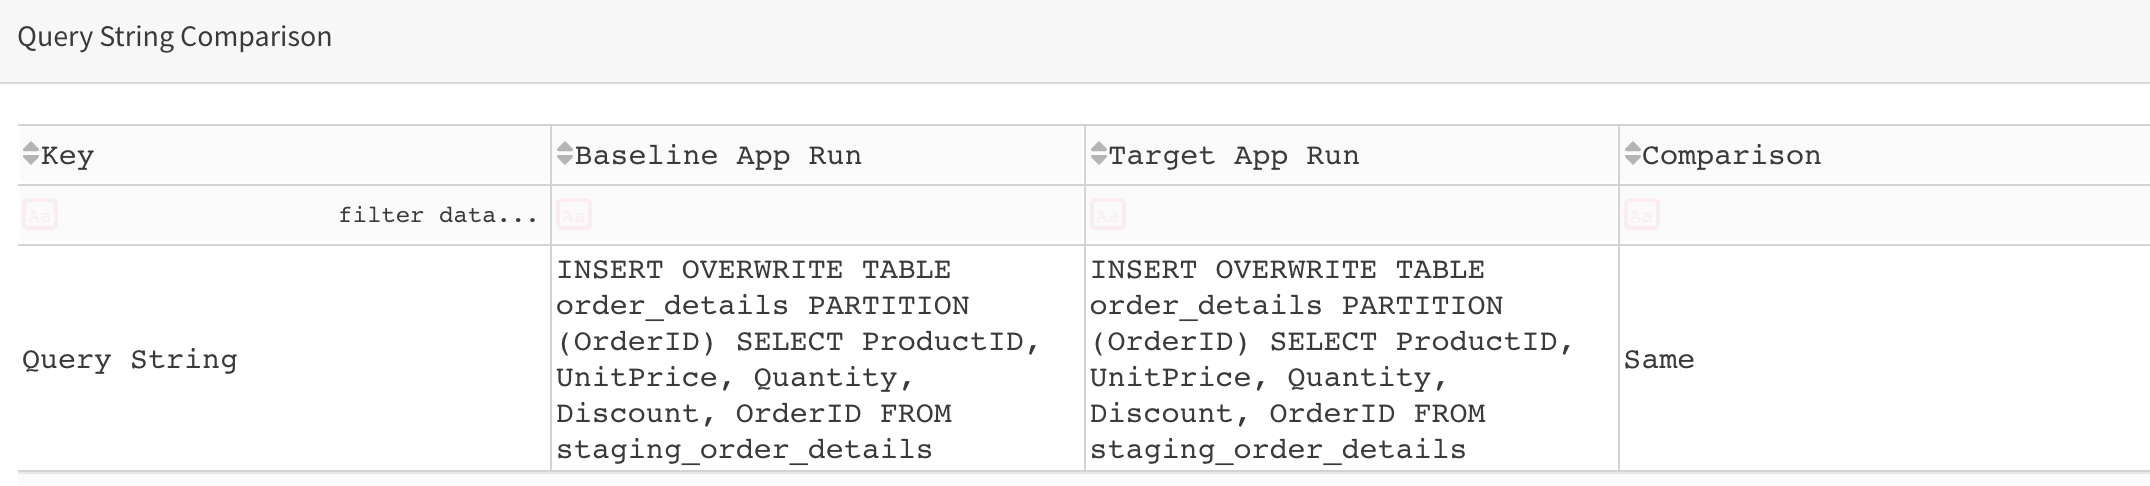
Query String Comparison
You can view the differences in the query strings between the Target App and the Baseline App.
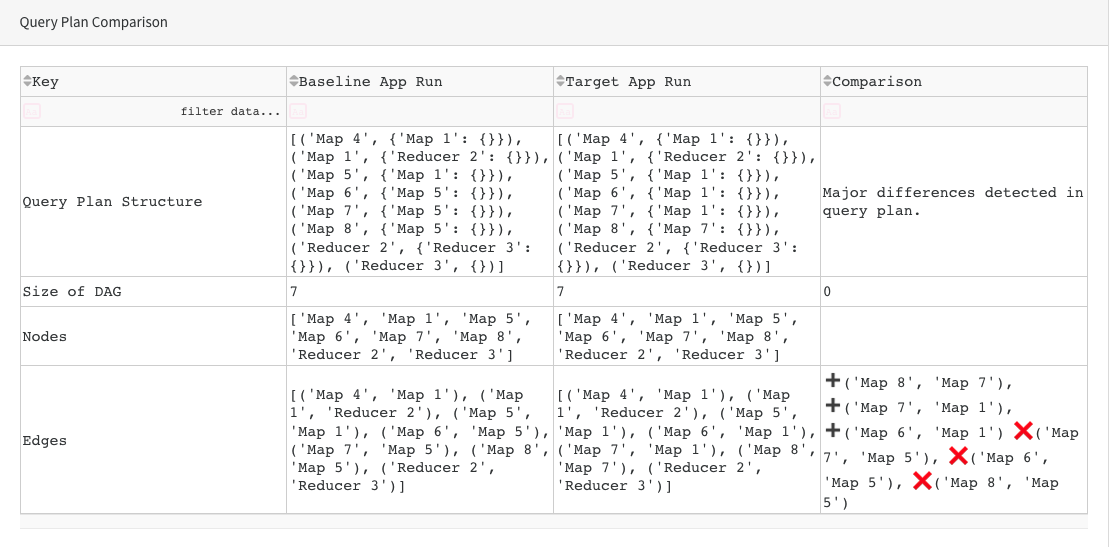
Query Plan Comparison
You can view the differences in the query plan between the Target App or the Baseline App. A further detailed comparison is provided for counters within the query plan.
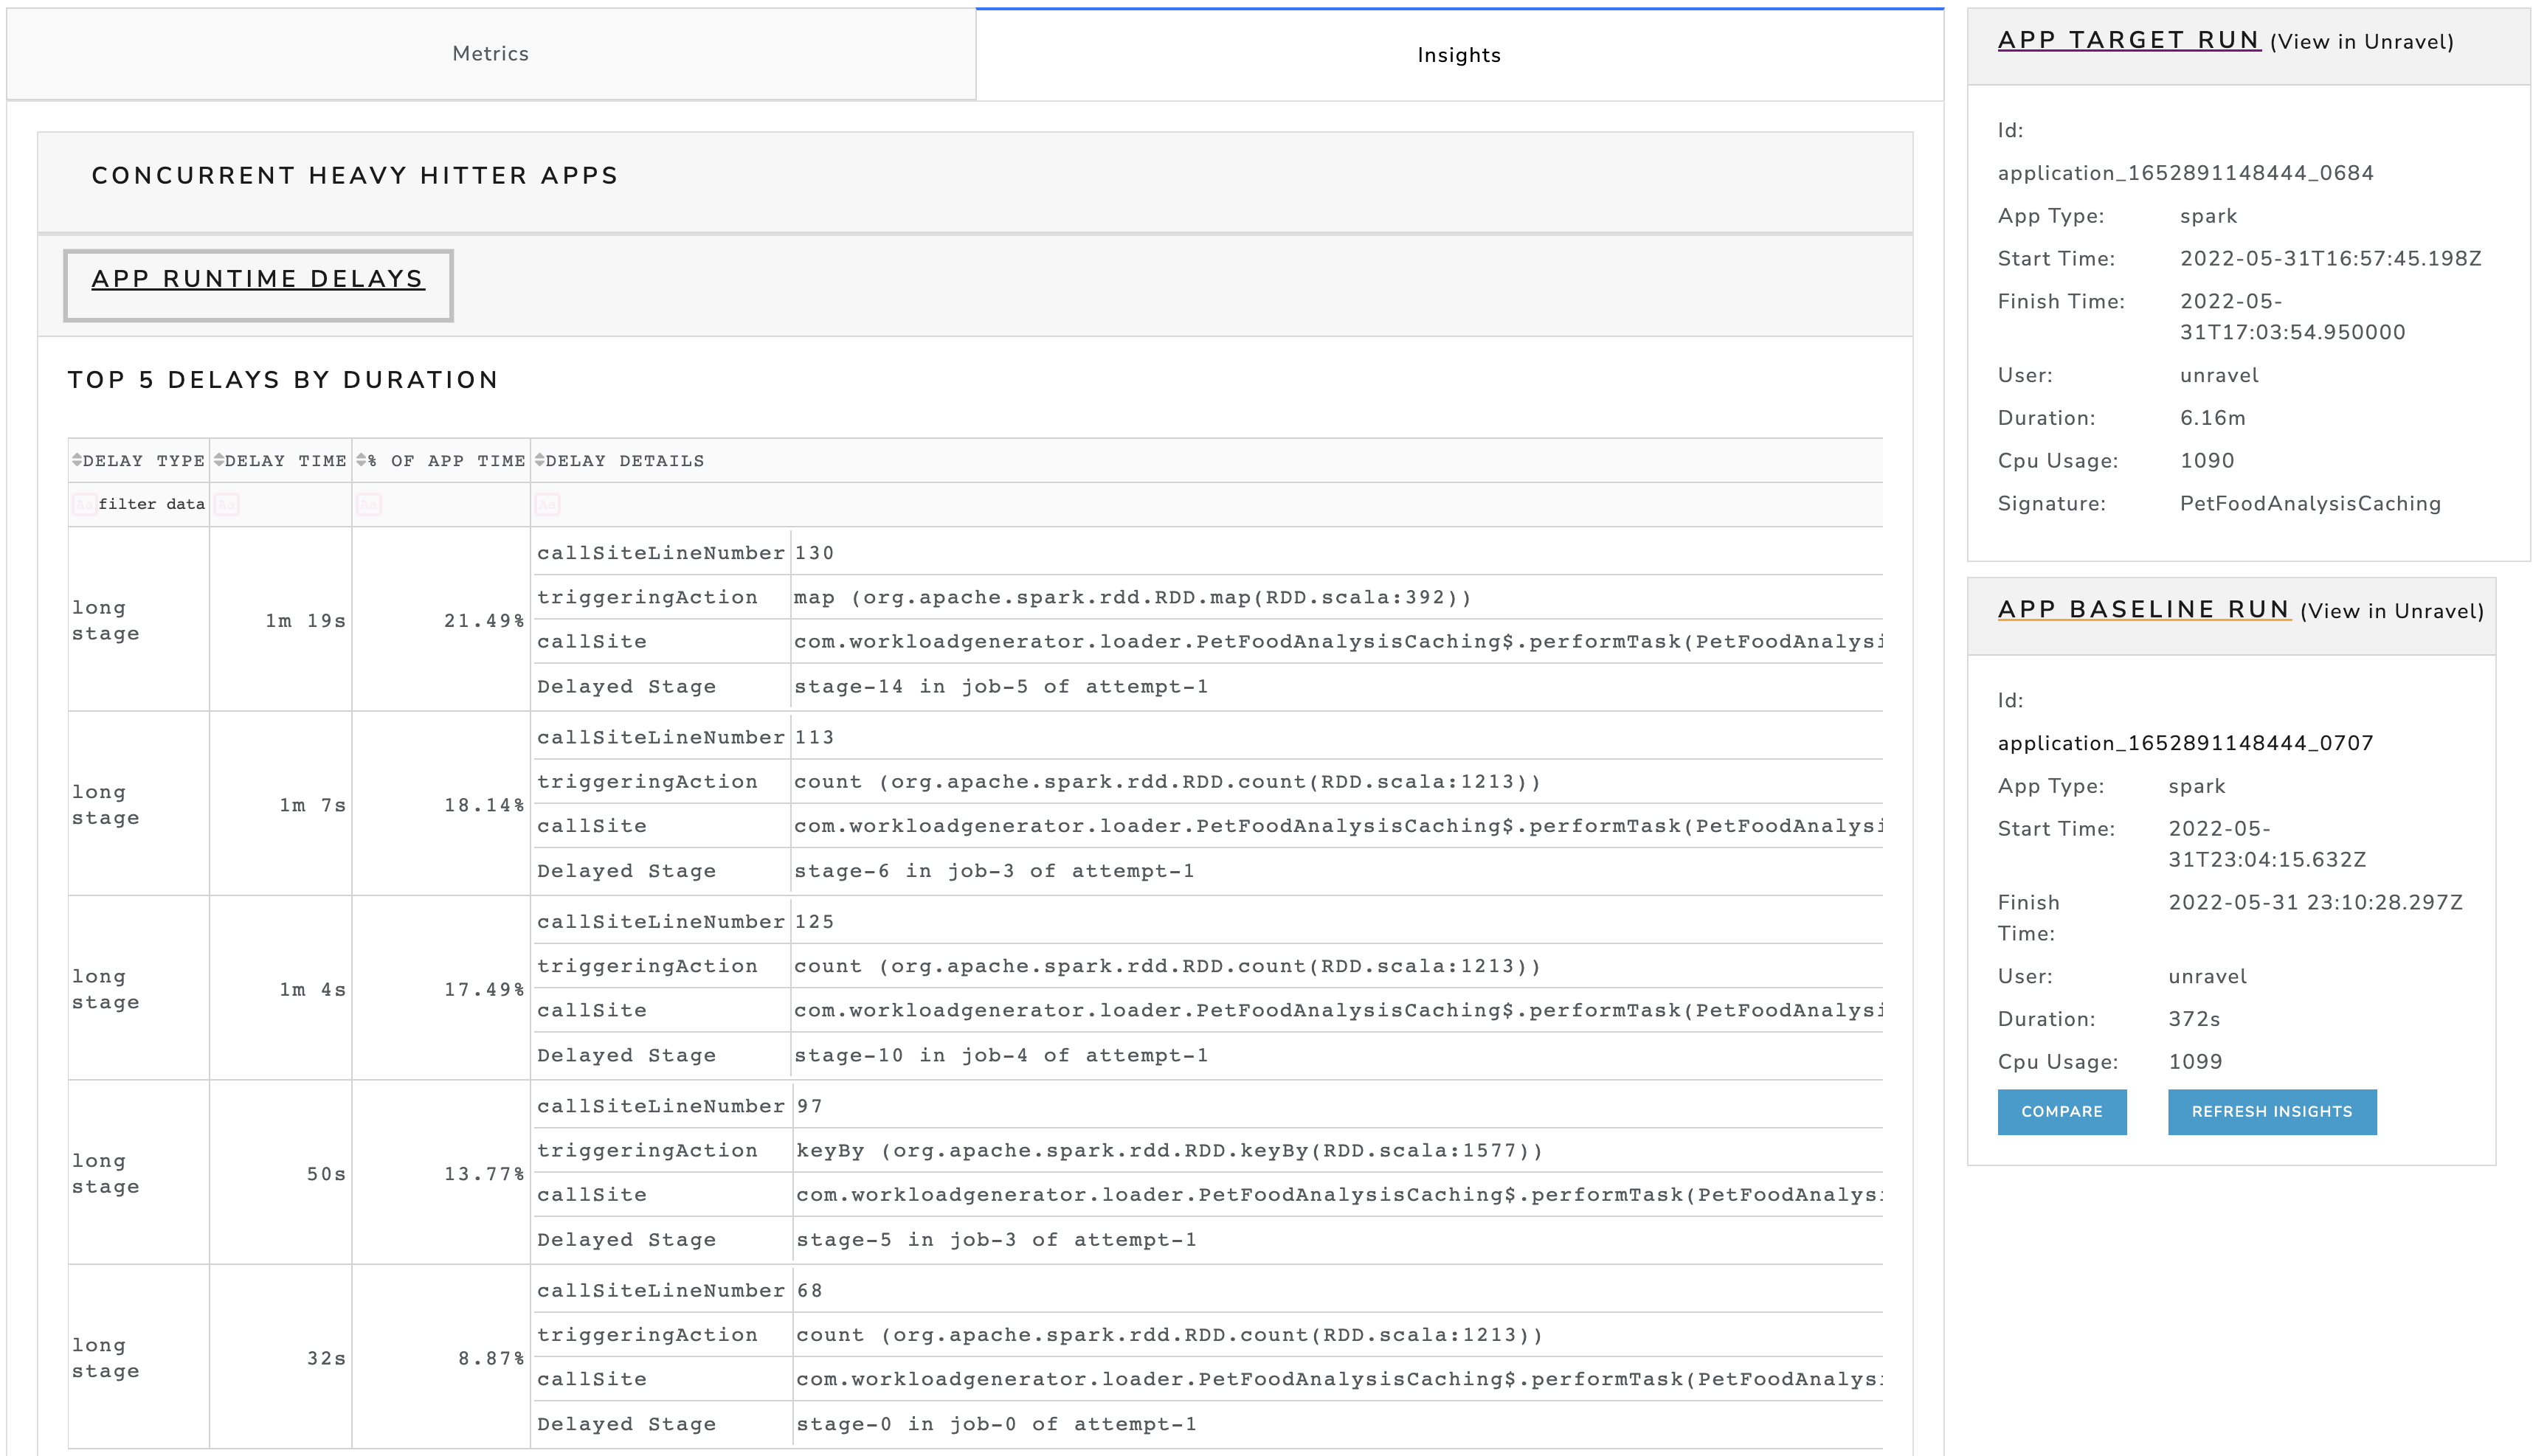
Insights tab
The Insights tab provides a comprehensive analysis, based on various factors, regarding the App failure, along with comparisons and areas where the application can be tuned to give the desired result.
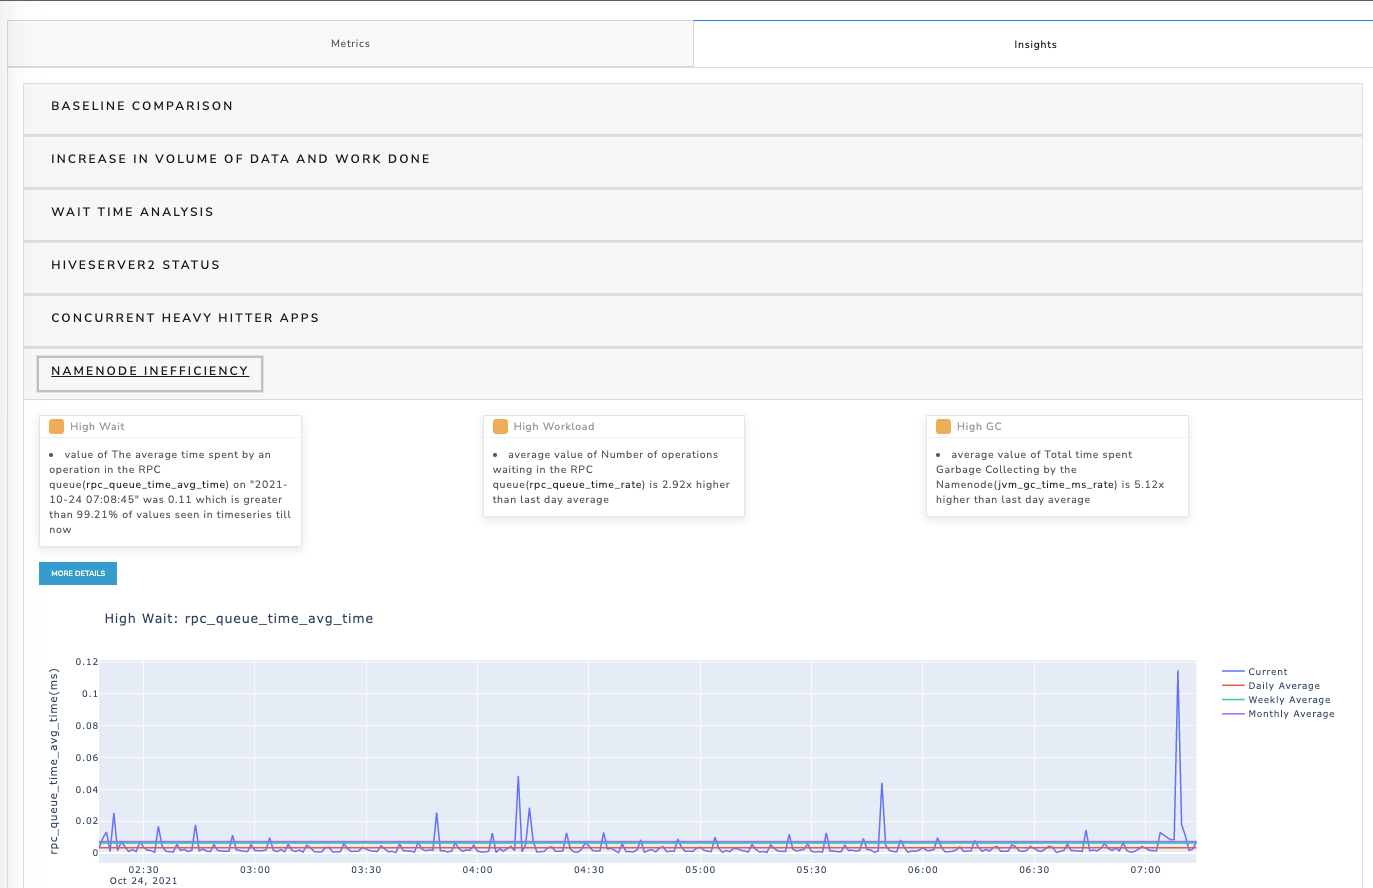
Concurrent heavy hitter apps
Select this option to view the top five applications in a specific category.
Click the Concurrent heavy hitter apps option.
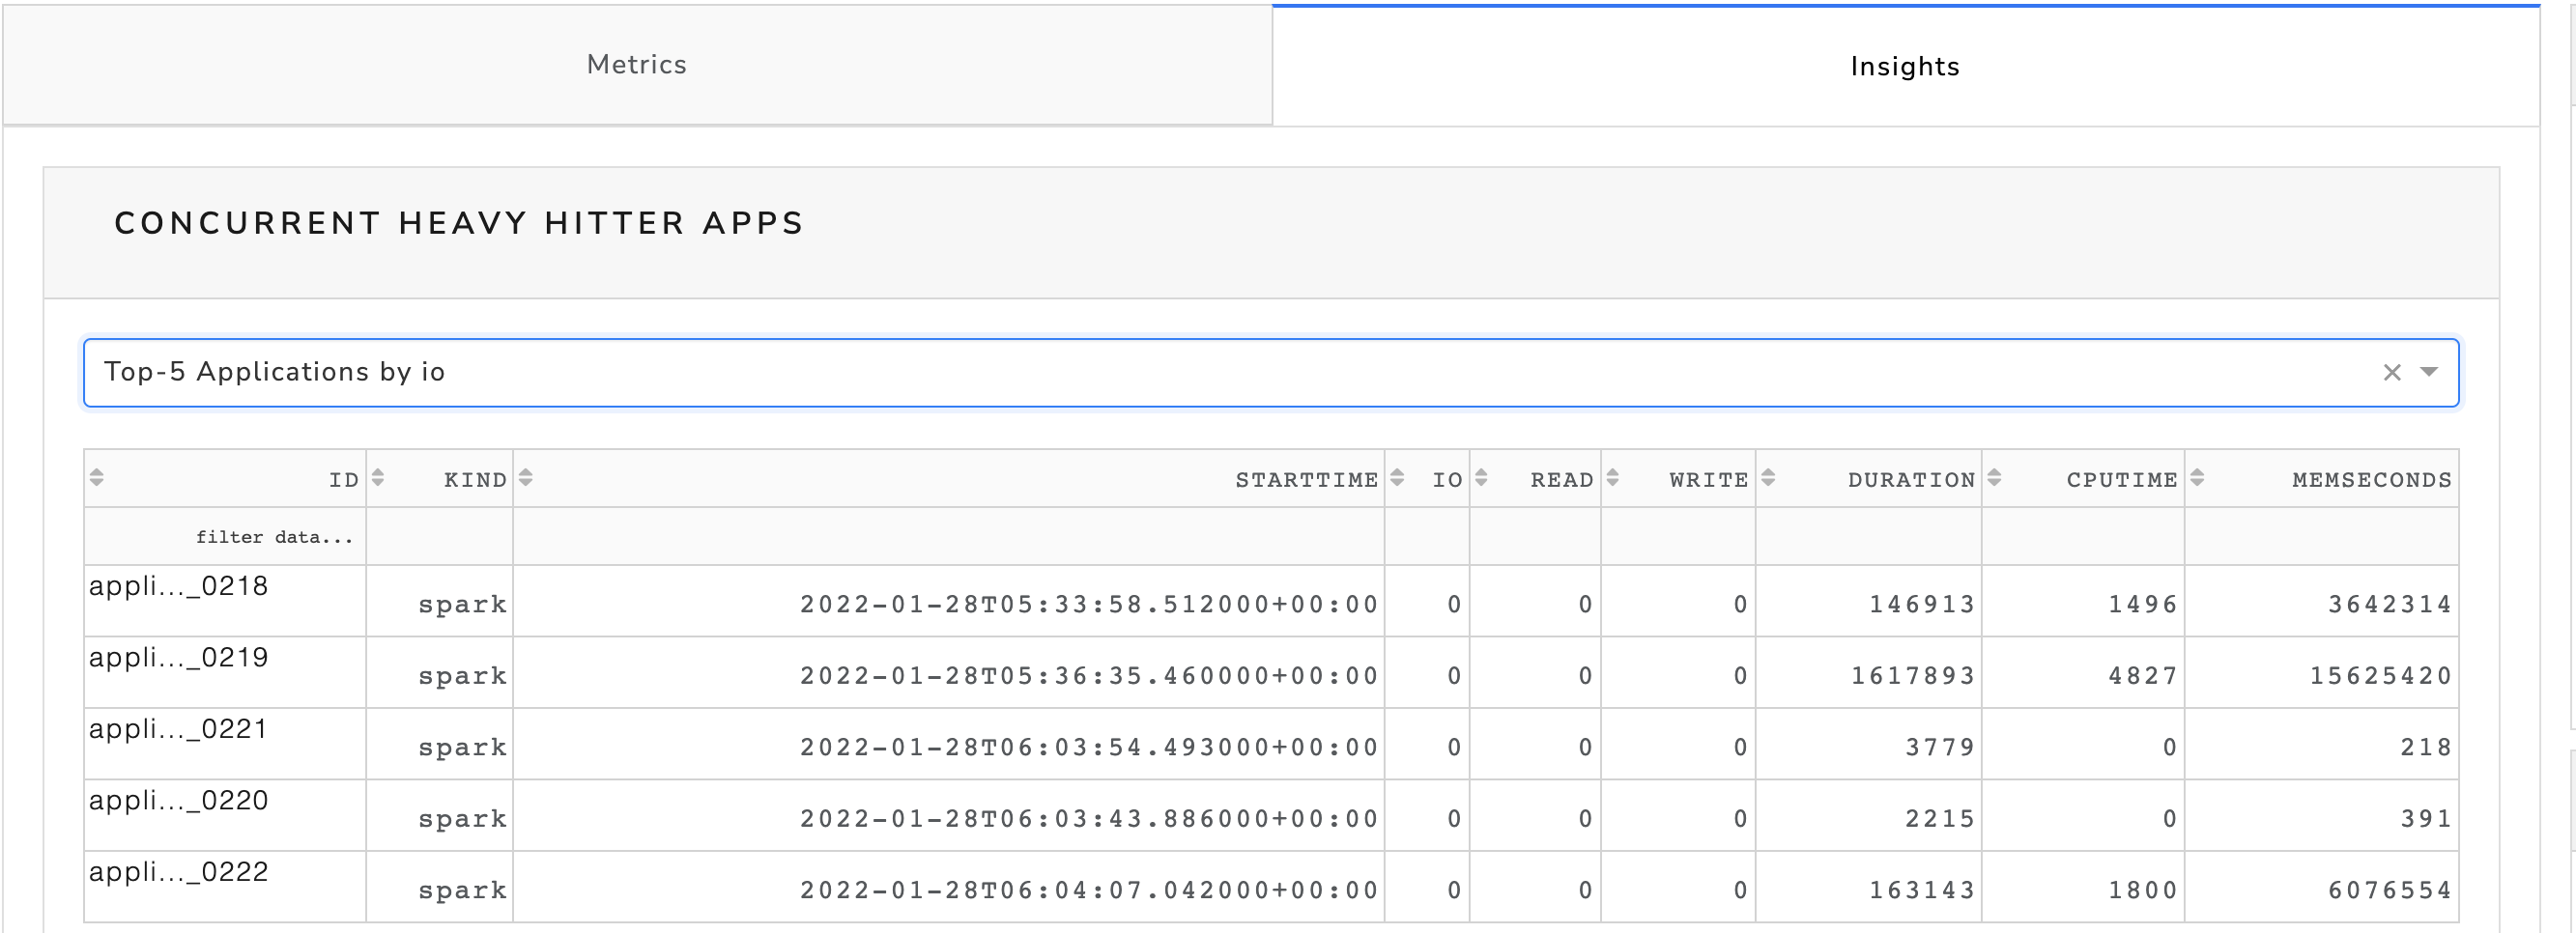
Select any option from the Top-5 Applications option.
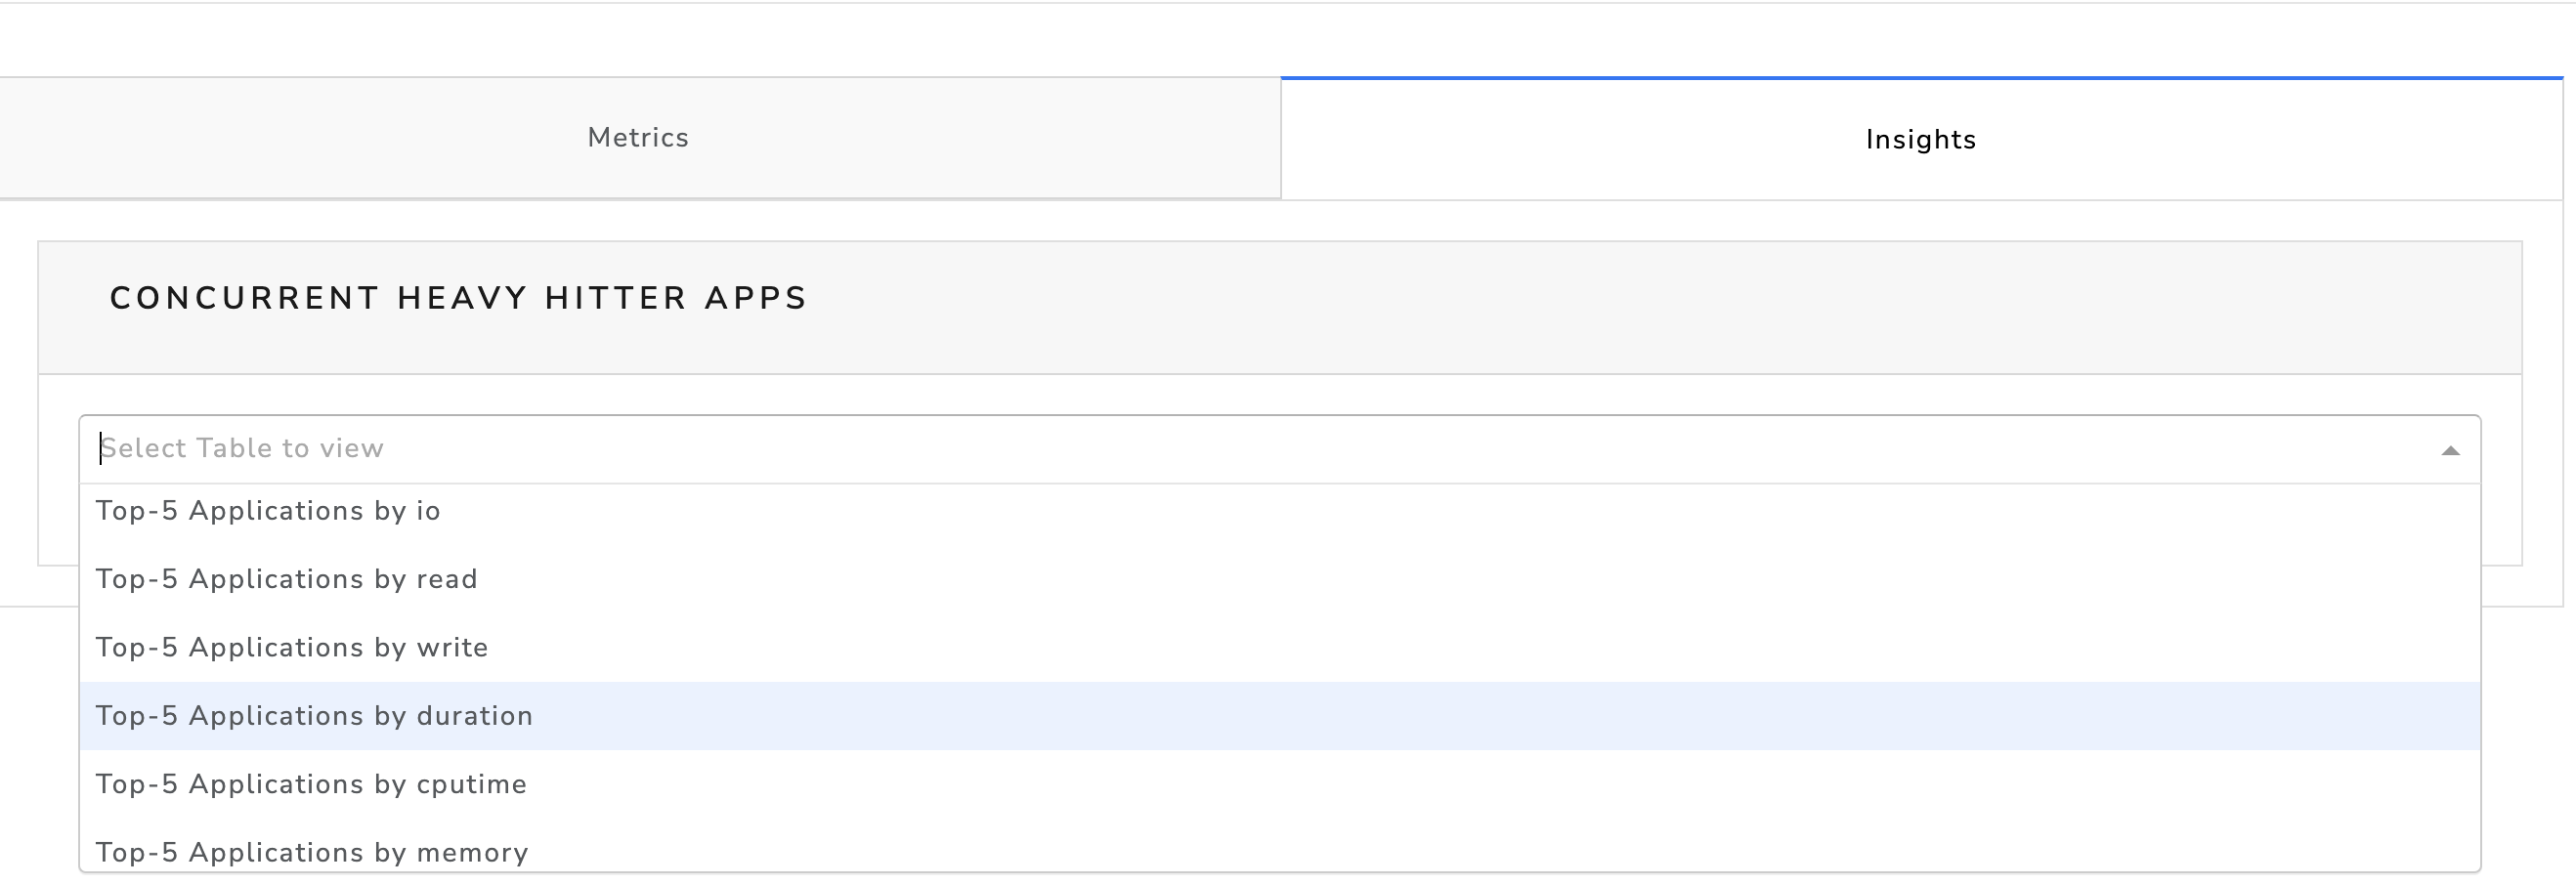
The corresponding details are displayed.
App Runtime Delays
Select this option to view top five delays by duration.