Queue Insights
The Queue Insights application helps manage resources and workloads. Once installed, you can easily select specific time ranges and clusters to analyze. The app gives you a clear view of how different queues are performing, helping you spot issues.
Get Insights
The app lets you dive into the details. You can choose a time range, cluster, and specific queues to see detailed performance metrics. This information helps you understand what's going wrong and what's working well.
Optimize
Using these insights, you can adjust configurations, balance workloads more effectively, and improve system performance. This means less wasted resources and faster processing times.
Keep Improving
By using it regularly, you can monitor and improve your resource management. The app helps you ensure your scheduler is always running efficiently, saving you money and boosting productivity.
Pre-requisites
Queue Insights app tar file:
Queue-Insights-0.0.1-dist.tar.gz
Yarn metrics extractor file:
yarn_metrics_extractor.py
Resource Scheduler URL: For example, http://citi01.unraveldata.com:8088
Configuration steps for packages released before November 2024
Edit the config.py file.
Open a terminal.
Navigate to the unity-one configuration directory:
cd /opt/unravel/data/apps/unity-one/src
Open the config.py file for editing and add the following script at the end of the file, replacing the placeholders with the relevant cluster names, resource scheduler URL.
cluster_id_mapping = { 'cluster name1': ['resource scheduler URL 1'], 'cluster name2': ['resource scheduler URL 2'],
}
yarn_metrics_extractor_sleep = 120
Save and close the file.
Edit the reports_main.py file.
Navigate to the reports directory:
cd /opt/unravel/data/apps/unity-one/src/reports
Open the reports_main.py file for editing and add the following script at line number 78:
if not disable_ast_extractor_launch: if not util.is_dbx_platform(es.es): threading.Thread(name='ast-extractor', target=launch, args=('ast_extractor.py',), daemon=True).start() threading.Thread(name='scheduler', target=launch, args=('yarn_metrics_extractor.py',), daemon=True).start()Save and close the file.
Place the yarn_metrics_extractor.py file in the src directory:
cd /opt/unravel/data/apps/unity-one/src
Configuration steps for packages released in Novemeber 2024 and later
Edit the config.py file.
Open a terminal.
Navigate to the unity-one configuration directory:
cd /opt/unravel/data/apps/unity-one/src
Open the config.py file for editing and locate the following script. Replace the placeholders with the relevant Resource Scheduler URLs:
cluster_id_mapping = { 'cluster name1': ['resource scheduler URL 1'], 'cluster name2': ['resource scheduler URL 2'],
}
yarn_metrics_extractor_sleep = 120
Save and close the file.
Edit the reports_main.py file.
Navigate to the reports directory:
cd /opt/unravel/data/apps/unity-one/src/reports
Open the reports_main.py file for editing and locate the following script :
if not disable_ast_extractor_launch: if not util.is_dbx_platform(es.es): threading.Thread(name='ast-extractor', target=launch, args=('ast_extractor.py',), daemon=True).start() ########### Queue-Insights ########## # threading.Thread(name='scheduler', target=launch, args=('yarn_metrics_extractor.py',), daemon=True).start()if not disable_ast_extractor_launch: if not util.is_dbx_platform(es.es): threading.Thread(name='ast-extractor', target=launch, args=('ast_extractor.py',), daemon=True).start() threading.Thread(name='scheduler', target=launch, args=('yarn_metrics_extractor.py',), daemon=True).start()Un-comment (remove the # symbol) the threading.Thread line of code .
Save and close the file.
Installing and opening Queue Insights app
Refer to Installing Queue Insights app.
Using the Queue Insights app
Queue Insights Overview
On the Unravel UI, from the upper-right corner, click
 . The App Store page is displayed.
 Click the Queue Insights image to open the app.
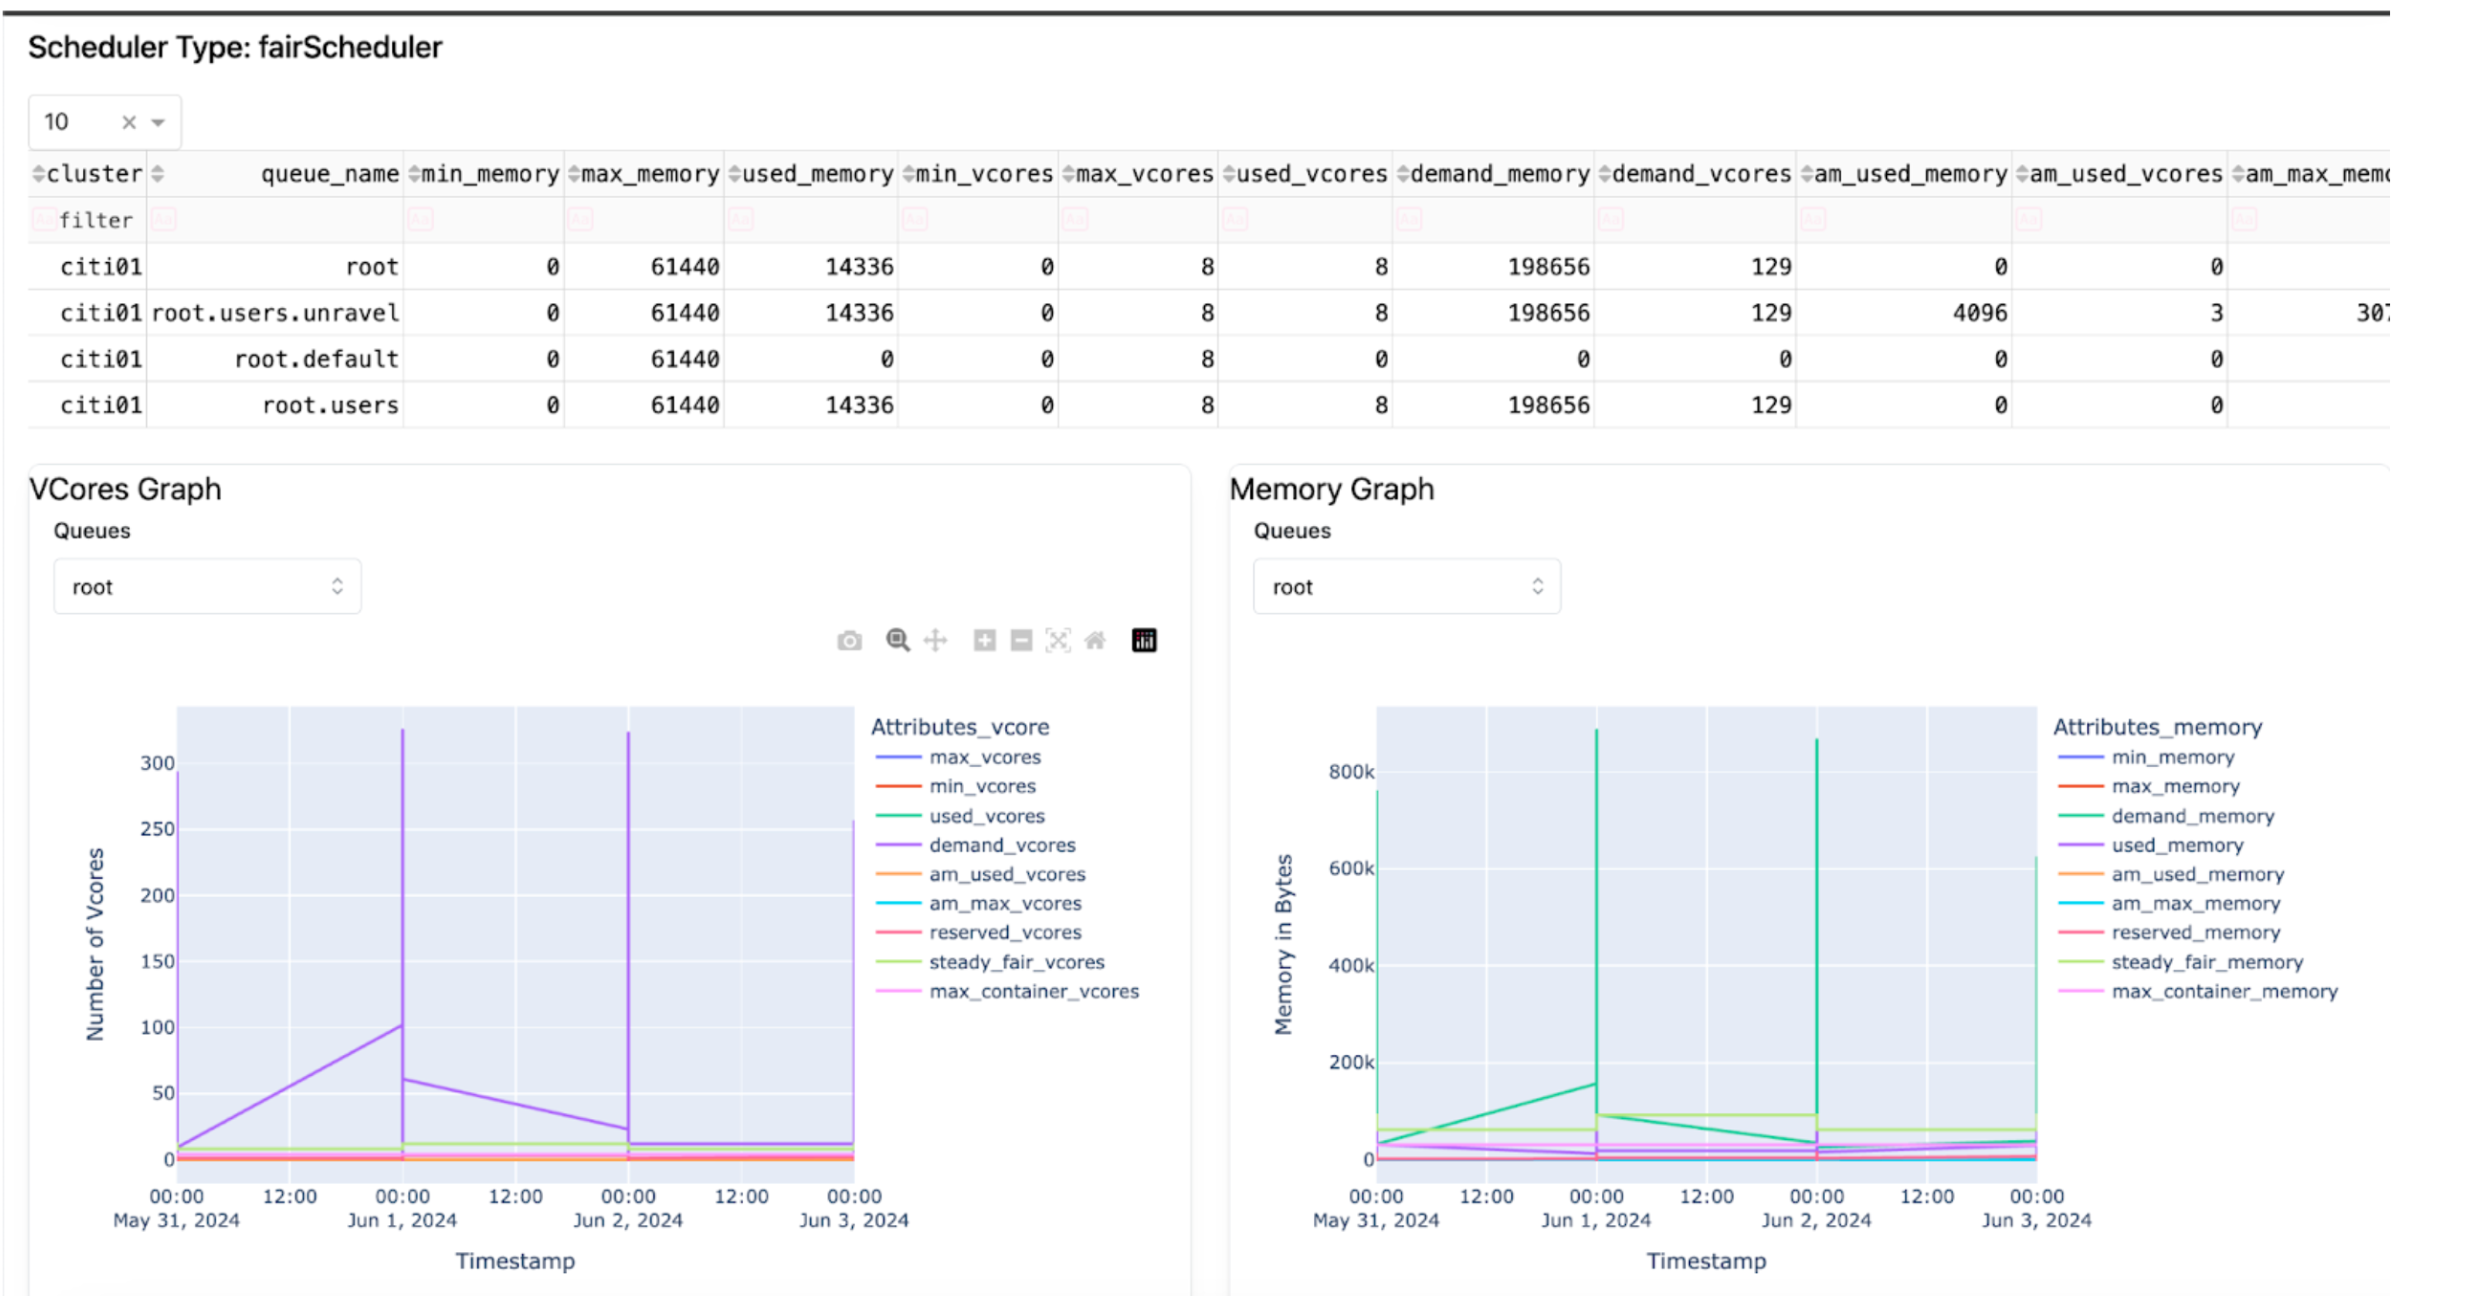
Select the desired time range and cluster and click Submit. The queue insights for the selected time range and cluster are displayed.
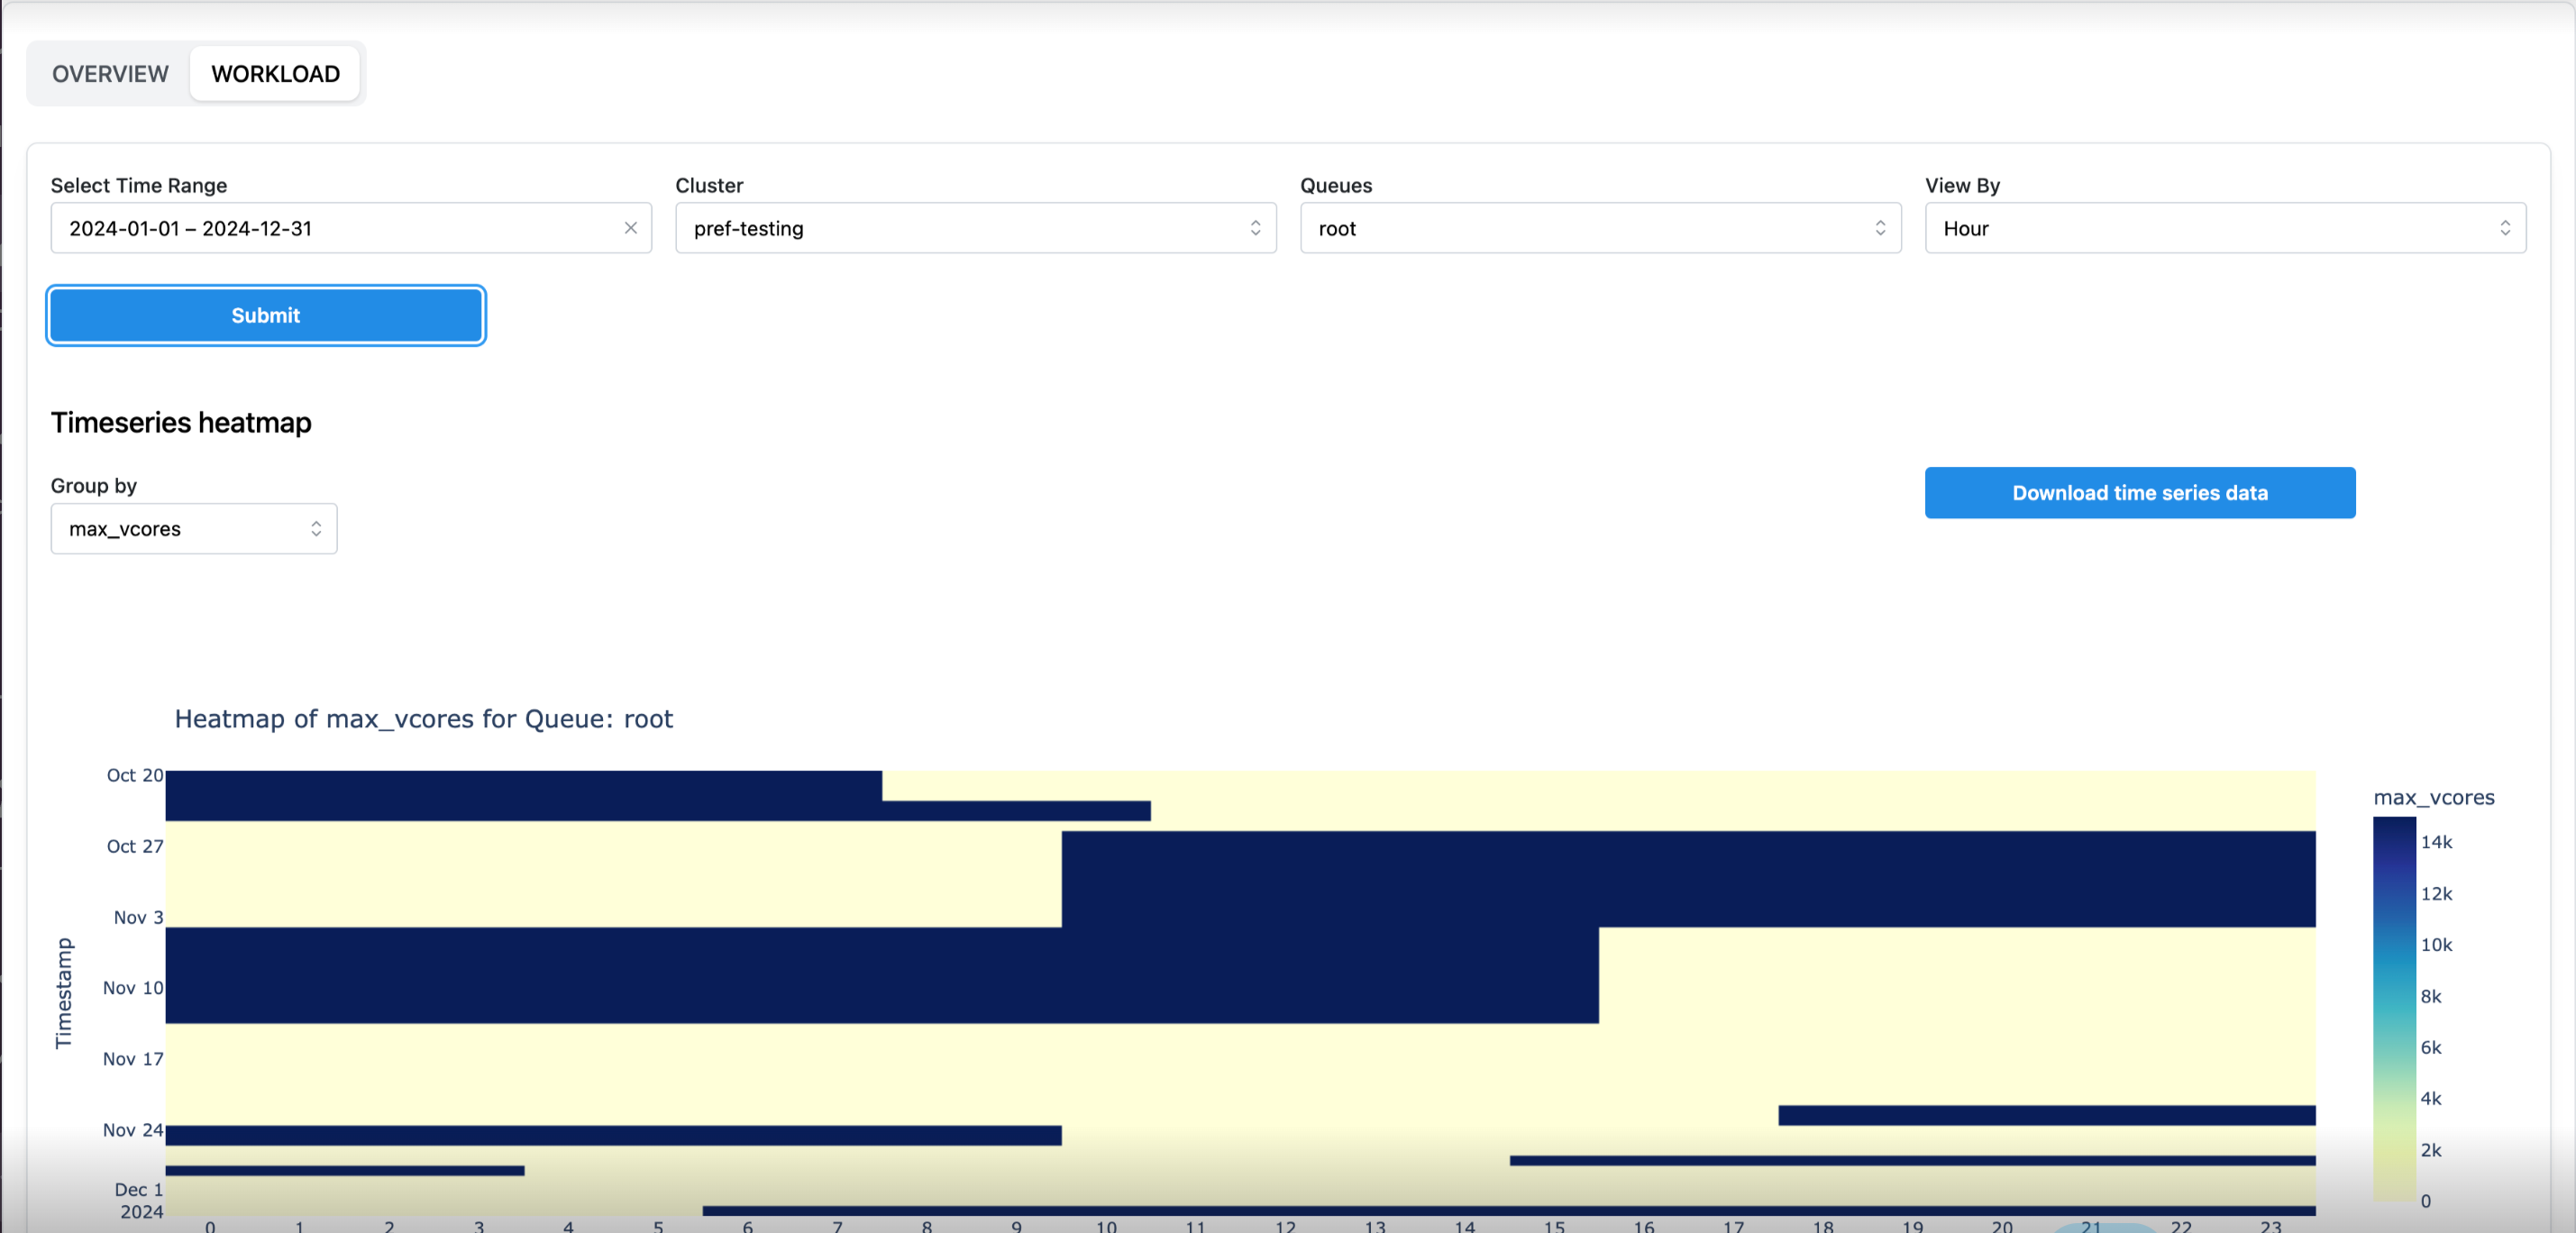
Workload
Click Workload.
Select the time range, clusters, queues, and view by time values.
Click Submit. The insights for the workload are displayed.