Clusters (Cloud clusters)
Note
This tab is visible only for Databricks clusters.
The Cloud clusters > Clusters tab displays the list of clusters and their corresponding configurations. You can filter the clusters based on the status, duration, user, workspace, and tags.
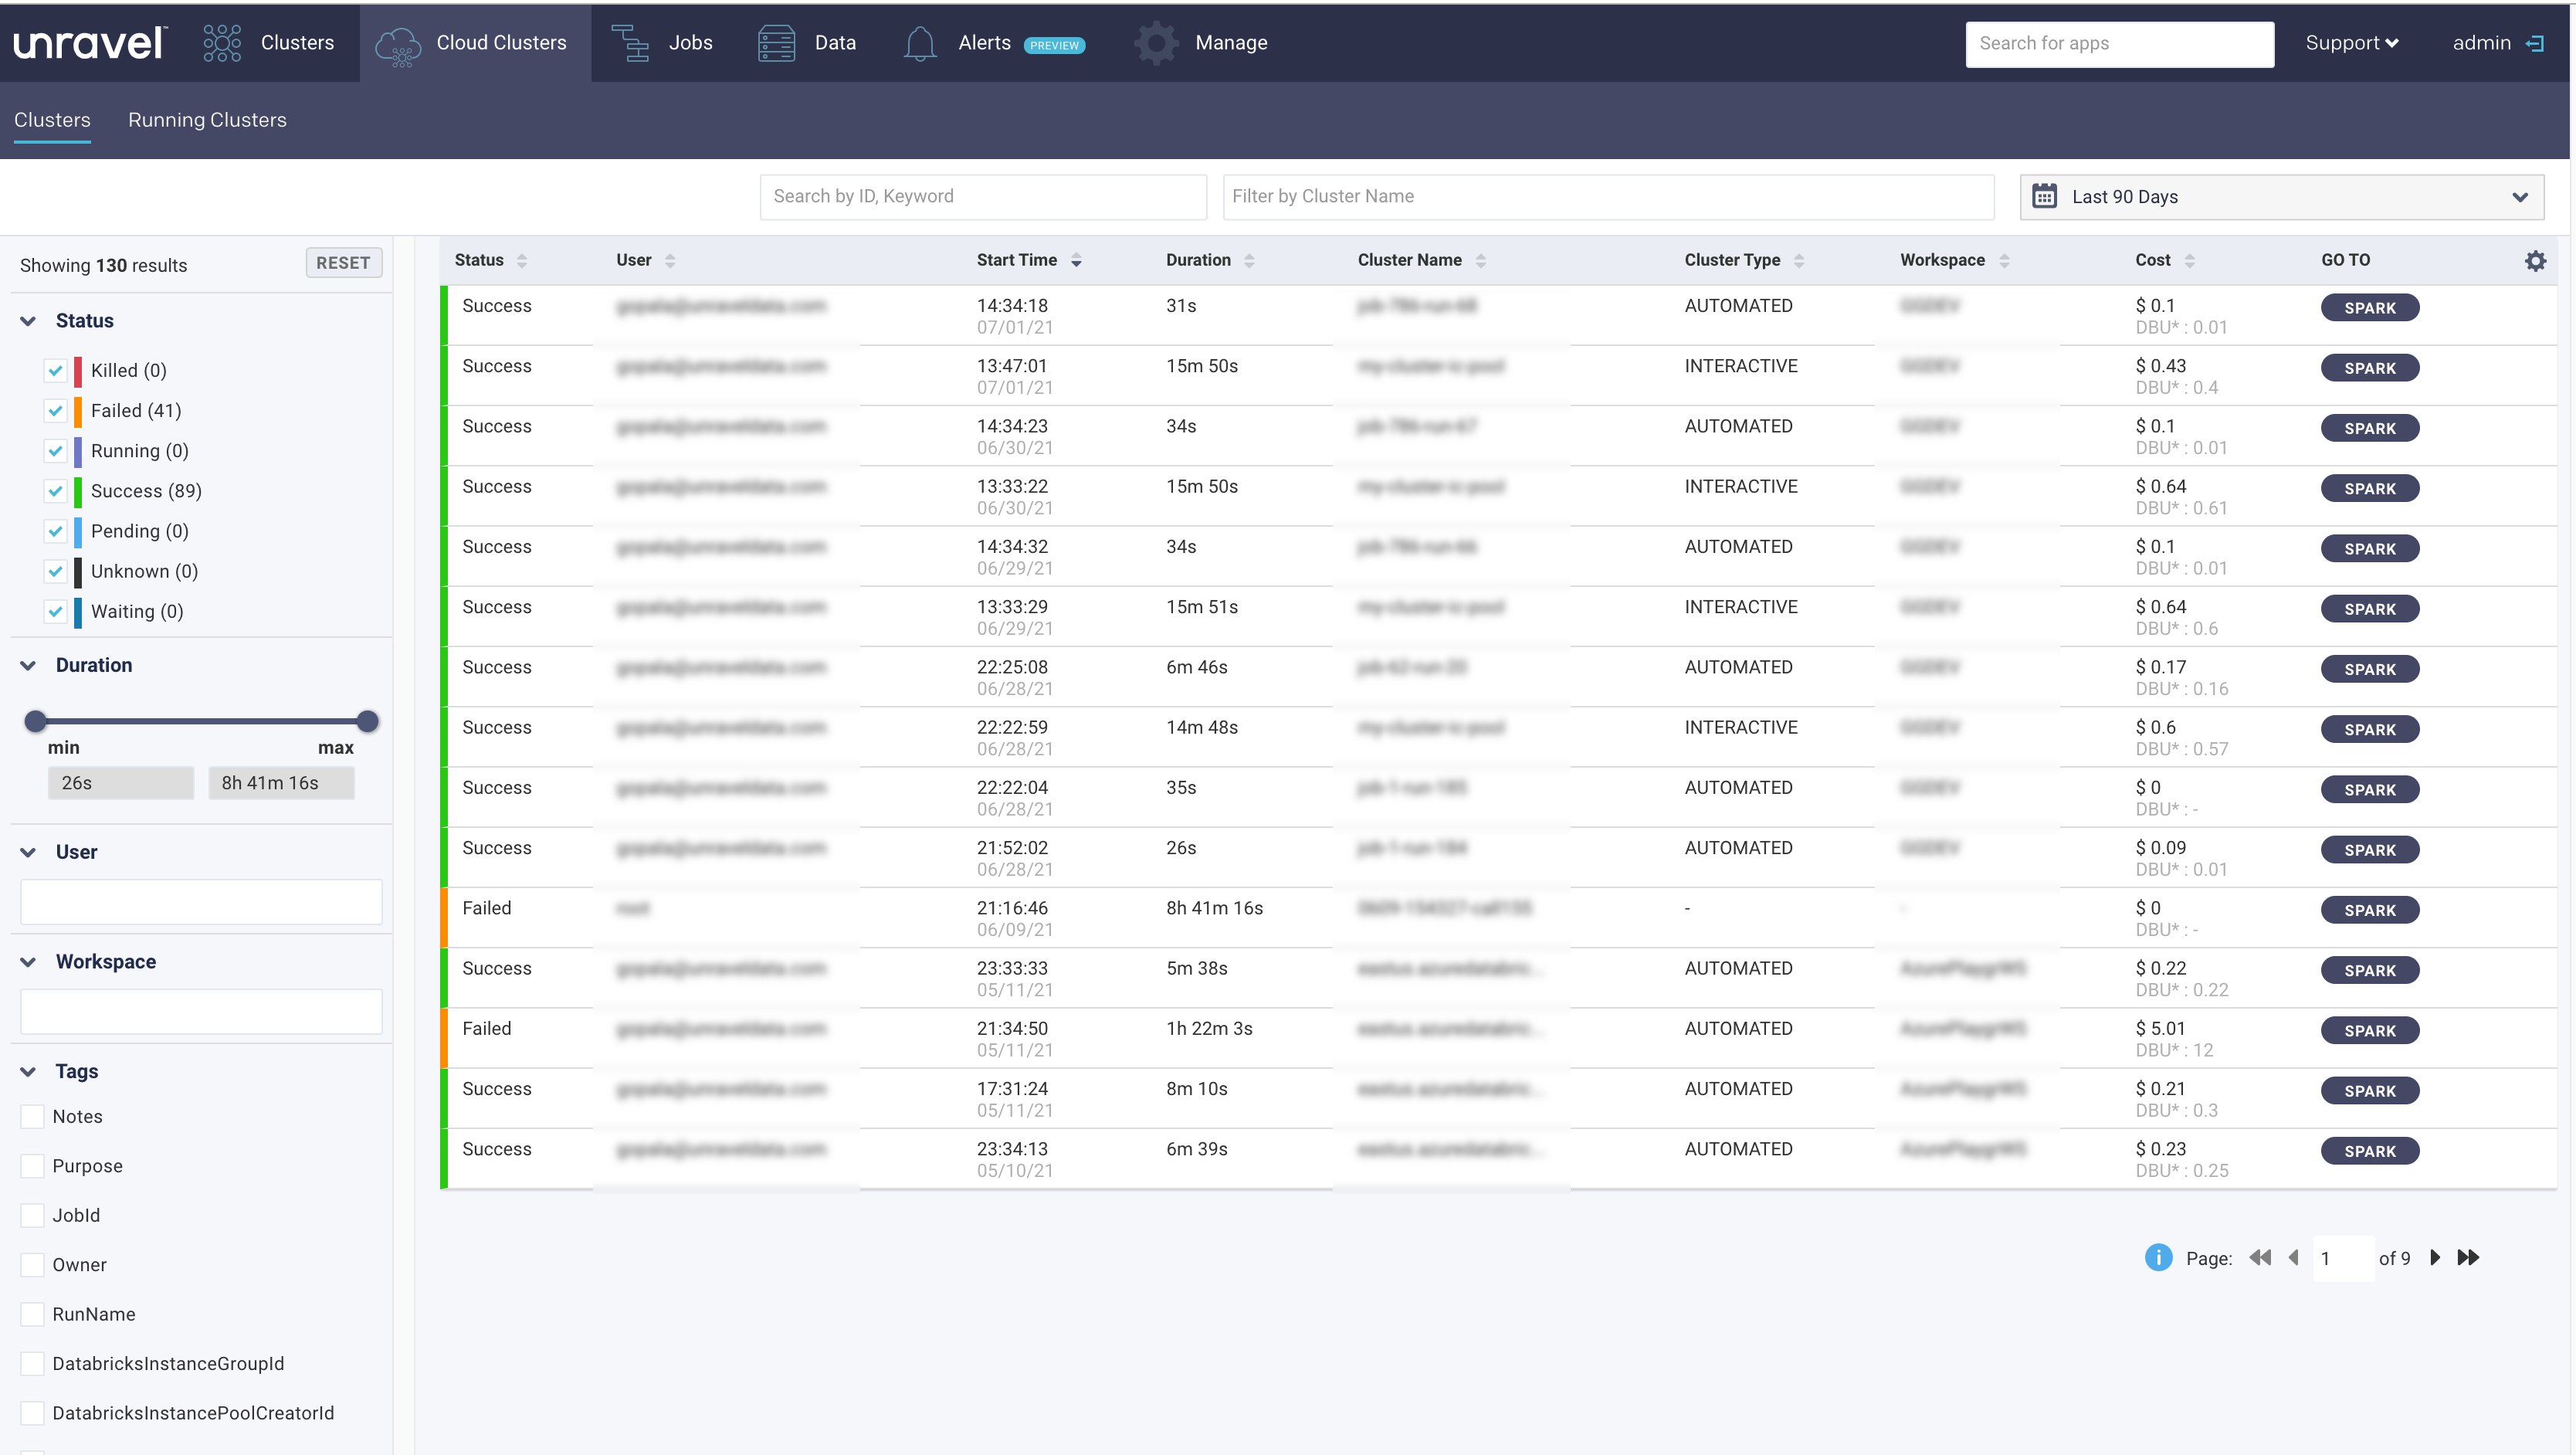
The cluster list displays the following columns:
Columns | Description |
|---|---|
Status | Status of the cluster. |
User | Name of the user running the jobs on the cluster. |
Start time | The start time and day of the cluster. |
Duration | Total time taken by the cluster to process the jobs. |
Workspace | Name of the Databricks workspace. |
Cluster Name | Name of the Databricks cluster. |
Cluster Type | Type of the Databricks cluster. (Interactive, Automative). |
Cost | An estimated cost incurred in running the apps on the cluster. This cost is calculated based on VM and DBU prices. |
Go To | Click to access the Application Performance Management (APM) page where more details of a specific job, which is run on the cluster, are displayed. |
Filtering clusters
You can filter clusters by:
Selecting a date and time range of the running clusters.
Using ID or keyword.
Using cluster name
The left sidebar lets you filter the clusters by:
Status: Status of the cluster, success, failed, or killed.
Duration: You can use the slider to set the range, or enter it directly in the from and to text boxes.
User: Name of user, who runs the jobs on the cluster. Click in the text box for a list of valid values.
Workspace: Databricks workspaces. Click in the text box for a list of valid values. Click the value to select it.
Tags: List of created tags. Click the checkbox next to the tag and then click in the text box for the valid values.
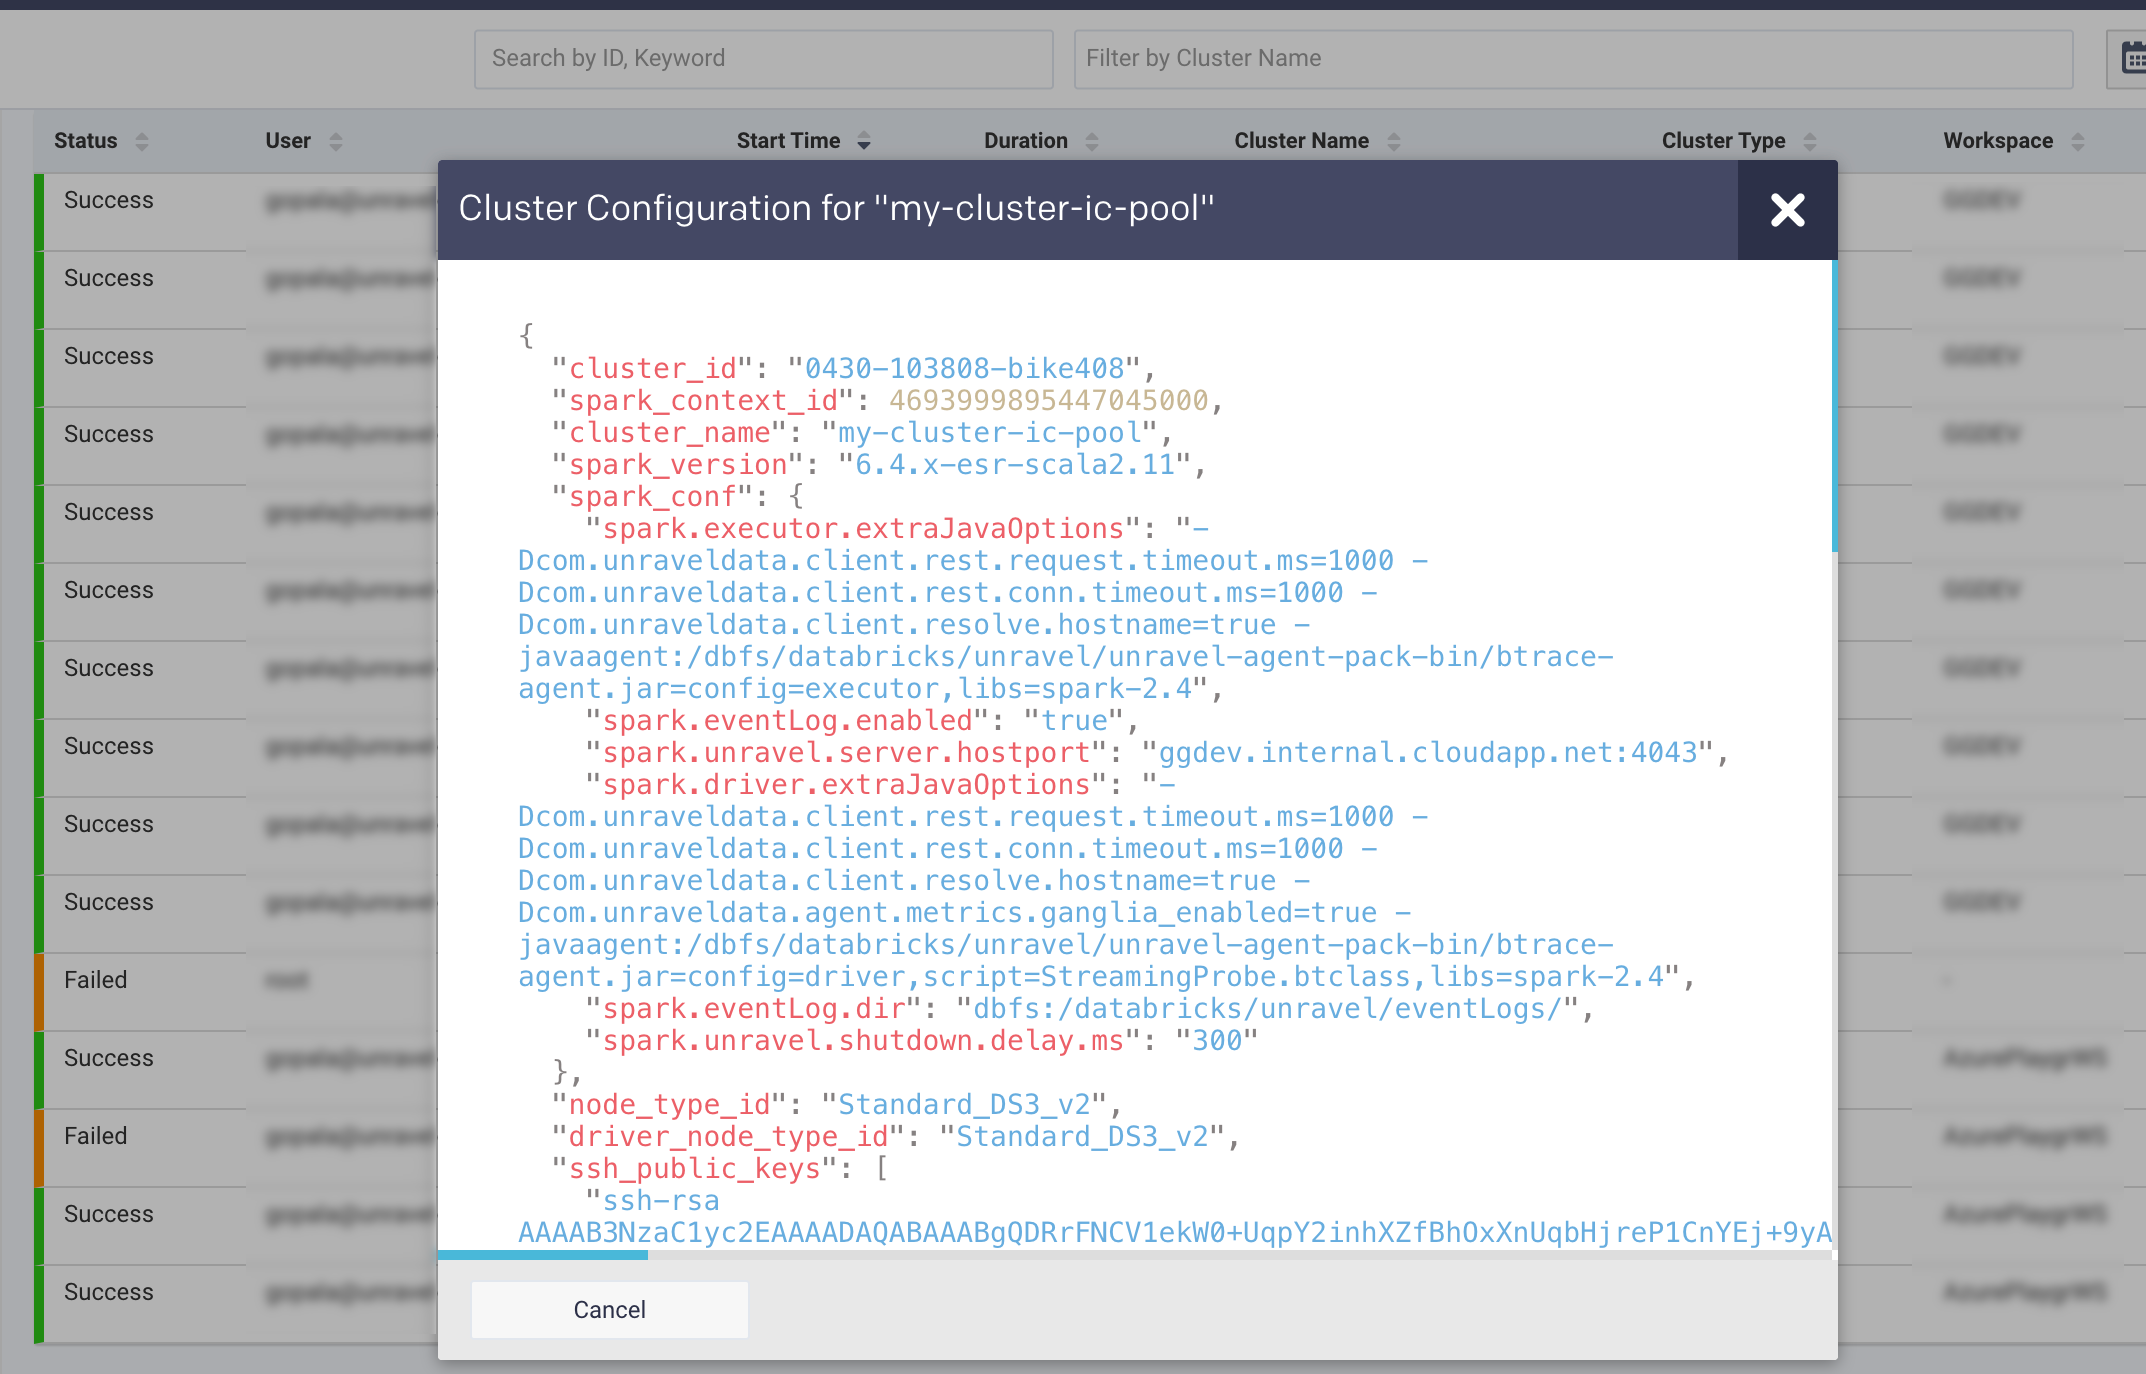
Viewing cluster configuration
You can click anywhere within a specific row in the cluster list to bring up the details of the cluster configuration.