Usage trending (Databricks)
Note
This tab is visible only in Databricks clusters.
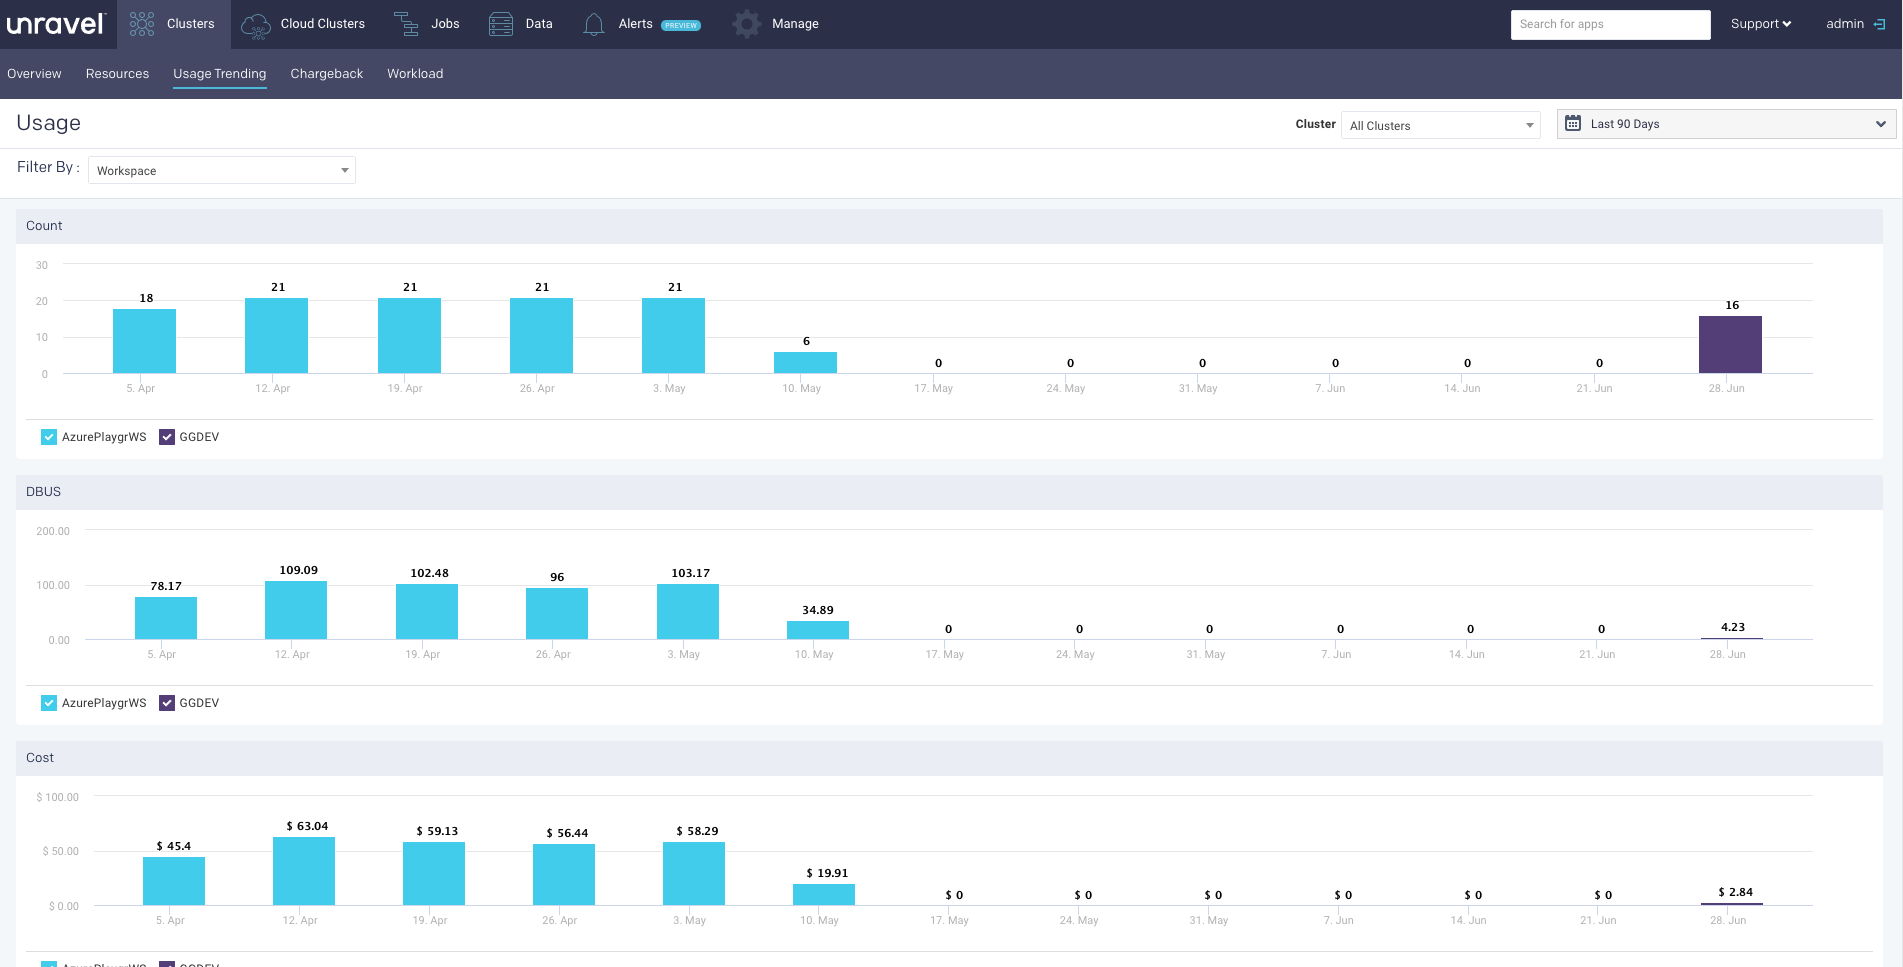
The Usage Trending tab provides a graphical representation of the trends Databricks instance usage. You can filter the trends for each of the active clusters based on the workspace as well as by the users for a specified time period.
Viewing the usage trending
To view the usage trending:
Go to Clusters > Usage Trending and select a cluster. You can select All Cluster to view the overall usage.
Click
 and select a time period to view the usage trends.
 From the Filter By drop-down on the left, select Workspace or User. The following details are shown graphically:
Count - The clusters that are actively running jobs in a specified time.
Jobs - Jobs run by users in a specified time.
Cost - Cost incurred by workspaces and users in a specified time. The cost shown is the total cost of the DBU and VM.
DBUs - DBU usage trend in a specified time.
Within each of the trend graphs, you can select checkboxes to view the usage details of a specific workspace or user. You can hover the mouse pointer over the bar to view more details.
Count
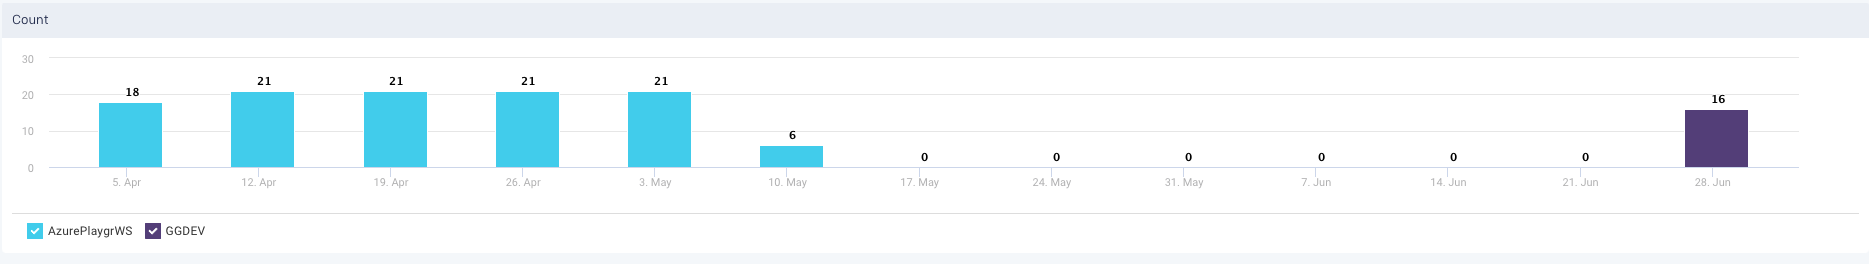
Workspaces: Usage trending graph by count.
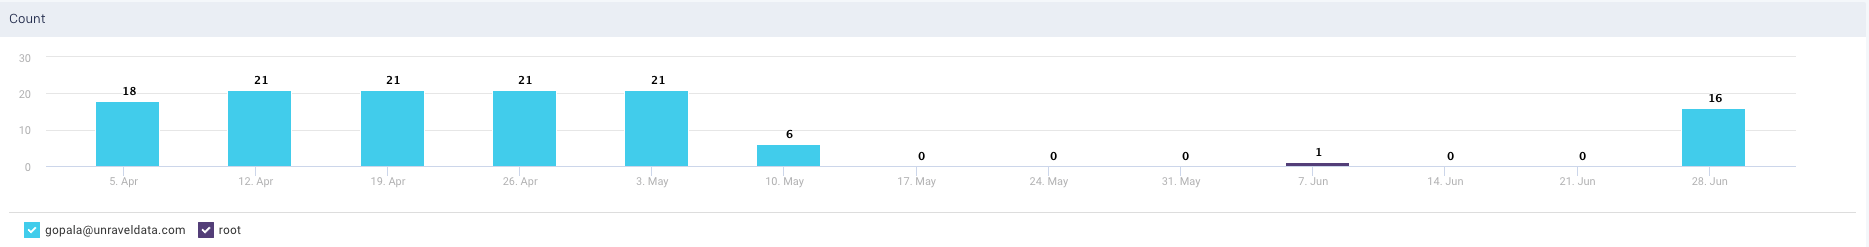
User: Usage trending graph by count.
DBUs
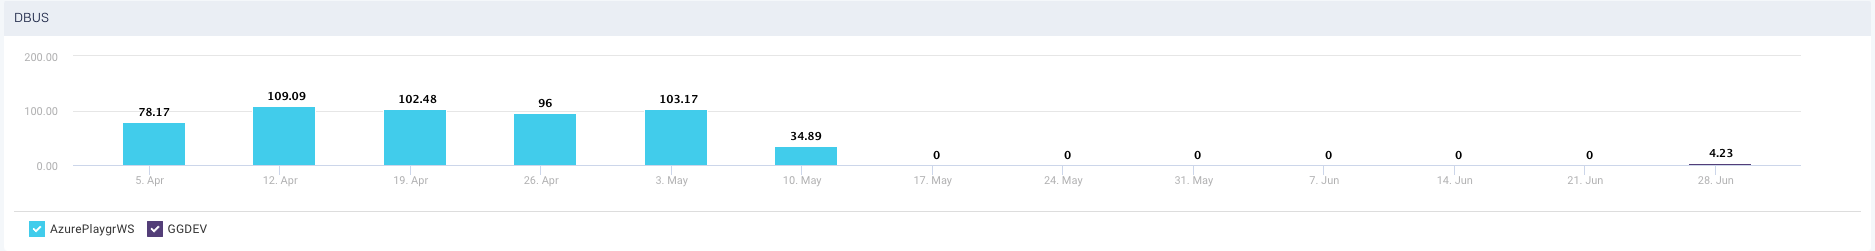
Workspaces: Usage trending graph by DBUs.
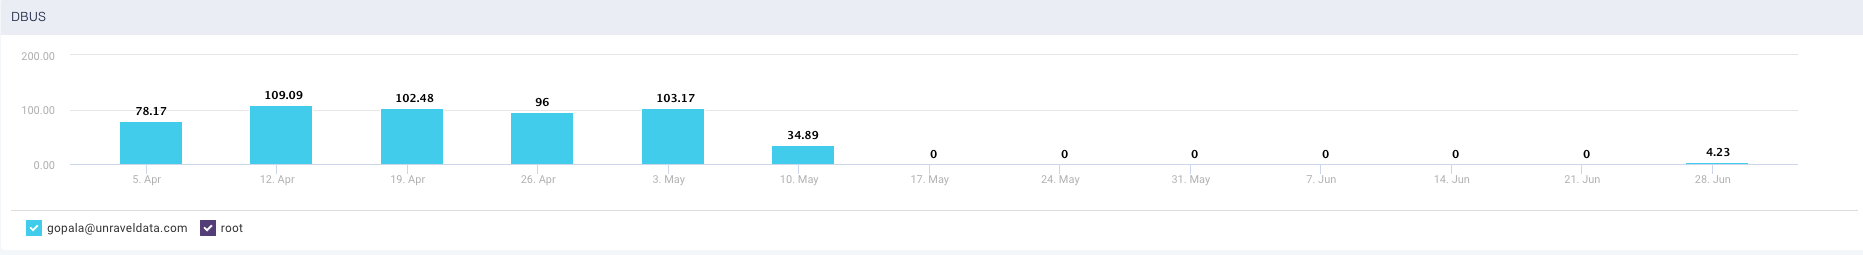
User: Usage trending graph by DBUs.
Cost
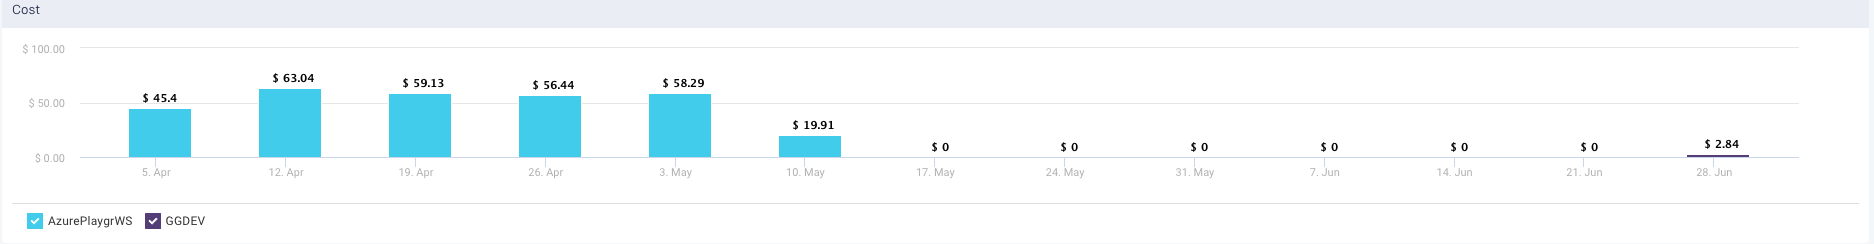
Workspaces: Usage trending graph by cost.
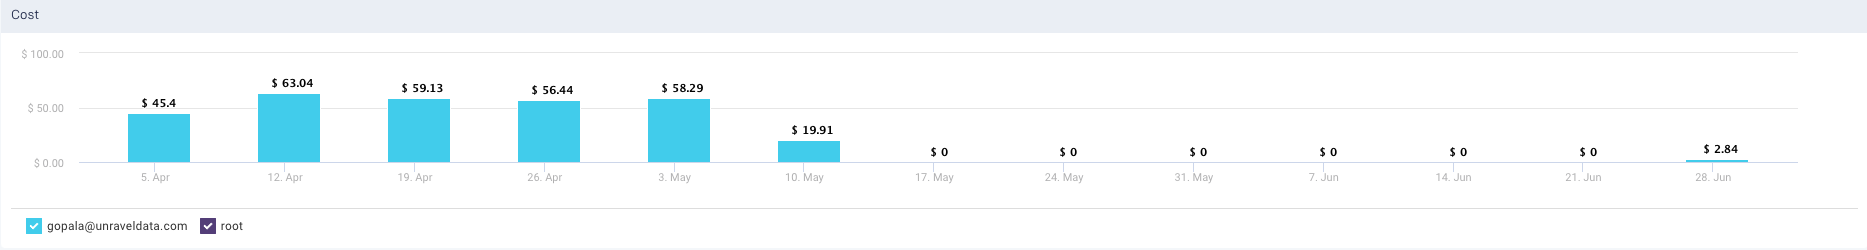
User: Usage trending graph by cost.