Generating reports with Unity-One app
You can generate the following reports:
Further, you can also do the following:
Creating a TopK report
The TopK report ranks the top queries involving IO, memory, CPU usage, and duration metrics. Run the following steps to create a TopK report:
Click Generate Reports > New button.
In the New Report dialog box, enter the following details.
TopK Items
Description
General
Name
Name of the report.
Report type
Type of report. Select TopK.
Schedule
Select the checkbox to schedule the report to run daily, hourly, weekly, or monthly. You can also set the schedule using a cron expression. You can expand the Example drop-down and select the corresponding options. The next four sample run times are displayed for reference.
Retention
The number of days to retain the report files. All the reports are stored in the
apps-insights-reports/src/jobsdirectory. After the completion of the retention period, the report files are automatically purged.Parameters
Application Kind
Type of application where you want to run the report. The options are Impala or Hive.
Look Back
Period range in days when you can select applications for report generation. A notification is displayed above this option informing about the duration when data is available for the report.
Users
Select the users whom you want to include in the report. You can select multiple users.
Queues
Select the queues that you want to include in the report. You can select multiple queues.
Clusters
Select the clusters that you want to include in the report. You can select multiple clusters.
Reports
Select the metrics that must be included in the report. The following metrics are available to choose from:
Duration
I/O
Memory seconds
CPU time
This is visible only for the TopK report type.
TopK
The threshold of the highest-ranking score, which must be shown for the metrics chosen for the applications.
Notifications
Email to
Email ID to send the notification when the report is generated. You can select the Attach Files to Email checkbox to receive the reports as an attachment.
Click OK. The generated reports will be listed under Reports on the App UI.
Creating an Impala Resource Pool Analysis report
Click Generate Reports > New button.
In the New Report dialog box, enter the following details.
Items
Description
General
Name
Name of the report.
Report type
Type of report. Select Impala Resource Pool Analysis.
Schedule
Select the checkbox to schedule the report to run daily, hourly, weekly, or monthly. You can also set the schedule can using a cron expression. You can expand the Example drop-down and select the corresponding options. The next four sample run times are displayed for reference.
Retention
The number of days to retain the report files. All the reports are stored in the
apps-insights-reports/src/jobsdirectory. After completion of the retention period, the report files are automatically purged.Parameters
Look Back
The period range in days when applications can be selected for report generation. There is a notification displayed above this option that informs about the duration when data is available for the report.
Interval
Time series interval.
Queue Config File Path
Path to queue.json file.
Users
Select the users who must be included in the report. You can select multiple users.
Pools
Clusters
Select the clusters that must be included in the report. You can select multiple clusters.
Notifications
Email to
Email ID to send the notification when the report is generated. You can select the Attach Files to Email checkbox to receive the reports as an attachment.
Click OK. The generated reports will be listed under Reports on the App UI.
Editing a report
Click Generate Reports and from the Reports list, select the checkbox corresponding to the report that you want to edit.
Click the Edit button.
In the Edit Report dialog box, edit the required options and click OK.
Scheduling a report
Click Generate Reports > Edit button if you are to schedule for an existing report. If you are creating a new report and want to schedule the report, click the New button.
Under the Schedule option, select the checkbox.
Expand the Example drop-down and choose any of the following options to run the report:
hourly
daily
12 hourly
weekly
monthly
The next four sample run times are displayed for reference.
You can also specify the schedule options using a cron expression. From the options under Example, you can select cron expression and enter the expression in the textbox.
Click OK. The reports will run as per the set schedule. If you have provided an email ID, you will be notified when the report run is completed.
Running a report
To run the reports, you can set a schedule , and the report will run as per the set schedule. However, if you want to run the reports ad-hoc, select a report from the list and click the Run Now button.
Deleting a report
You can delete a report and all the reports generated based on the report runs. All the reports generated by the report runs are located in app-insights-reports/src/jobs/<report name>/<report run name>/<report files>. When you delete a report, all the report files generated for that report get deleted.
Click Generate Reports and from the Reports list, select the report that you want to delete.
Click the Delete button.
Checking log file of reports
There are two types of log files:
The log files are in the
/src/logsdirectory, which you can open to debug app-related issues.Using a terminal, go to the
/src/logsdirectory.Open the log files using a vi editor.
The log files in the app UI, which report the issues that occurred while running the reports.
Click Generate Reports > Reports list and select the checkbox corresponding to the report for which you want to check the log file.
Under the Report Runs list, select the corresponding report run.
Click the Log file link from the Run <Report run> box on the right. The Log file is opened.
Terminating a report run
In case any of the reports are not completing the runs or if you find any issues with the run, you can terminate the report run.
Click Generate Reports > Reports list, select a report. The corresponding runs of that report are listed.
Select a report run with the Status column showing in progress and click the Terminate button.
Setting email notifications for the report
Click Generate Reports > Reports list, select the checkbox corresponding to the report for which you want to set notifications.
Click the Edit button.
In the Edit Report dialog box, under Notifications, provide the email ID to receive the notifications for the report completion. You can select the Attach Files to Email checkbox to receive the reports as an attachment.
Click OK.
Viewing a report run
All the reports are generated in an HTML format and If specified, these are sent as attachments in an email. The defined reports are listed with the following details under Reports. You can sort all the columns in the reports list.
Name: Name of the report.
Report Type: Type of the report; TopK report or Impala Resource Pool Analysis.
Enabled: Indicates if the report is set with a schedule.
Schedule: Indicates if the report is an ad-hoc run or a scheduled run.
Last Run Status: Specifies the status of the last run of the report, which can be a success, failed, killed.
Last Successful Run: Timestamp of the last successful run of the report.
# Runs: Number of runs of the report.
When you select any report in the Reports list, the corresponding runs of the report are displayed with the following details under the Runs of <Report> list.
Run: Unique ID of the run.
Scheduled Time: Timestamp of the scheduled time for the report run.
Status: Status of the run, which can be success, failed, or terminated.
Duration: Time that is taken to complete the report run.
To view the report of a run, do the following:
Click Generate Reports > Reports list and select a report. The corresponding runs of that report are listed below.
Select a job run of the selected report from this list. All the reports associated with the Job run are listed as links under the Run <Report run ID> list on the right. These reports are in HTML format.
Click a run report link and the report is displayed based on the parameters you have chosen while creating the report in an HTML format. There are two types of report runs; TopK and Impala Resource Pool Analysis.
Click the Input Parameters link for a quick view of the report parameters in JSON format.
Following are samples of the TopK report type and Impala Resource Pool Analysis report type.
TopK Report type sample
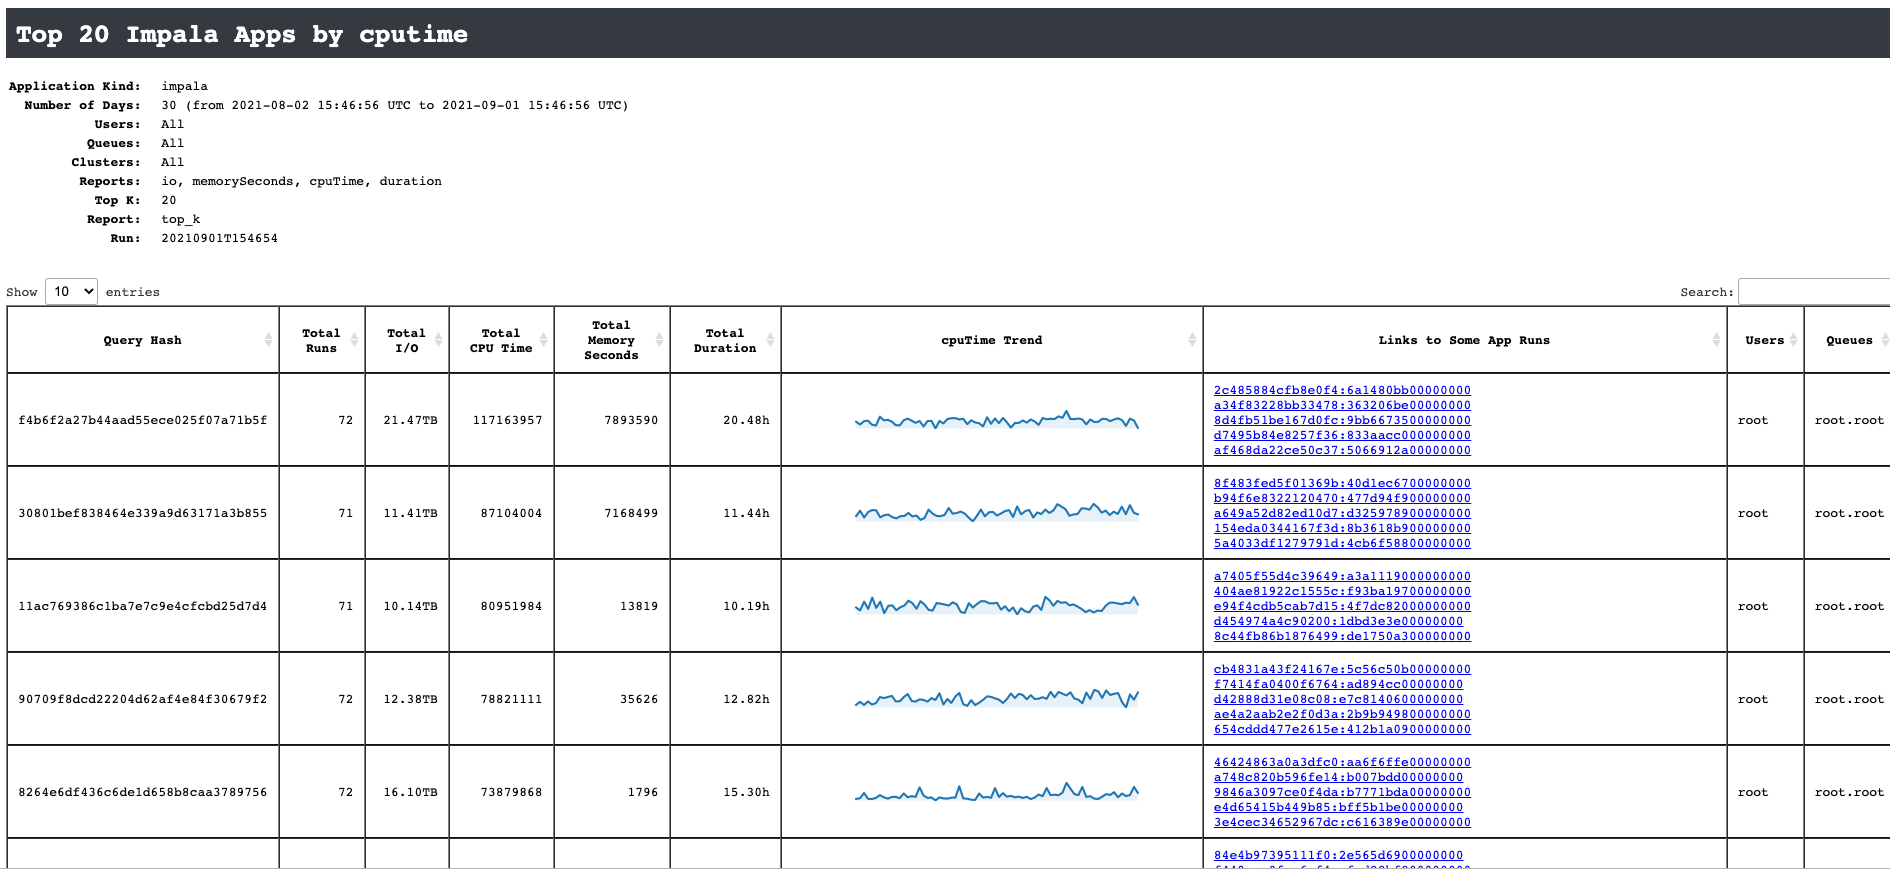
In this TopK report type sample, the Top 20 Impala apps based on the CPU Time parameter are listed. The report is identified by a unique Query Hash based on all the chosen parameters of the report schedule.
The total number of runs, I/O, CPU time, Memory seconds, and duration are listed in the columns.
A sparkline depicts the I/O trend.
A few examples of the report runs are listed in the Links to some App Runs column. When you click the link it leads to the Application details page in Unravel where there is comprehensive information about the app runs.
Users and Queues parameters selected while creating the report are listed.
Impala Resource Pool Analysis
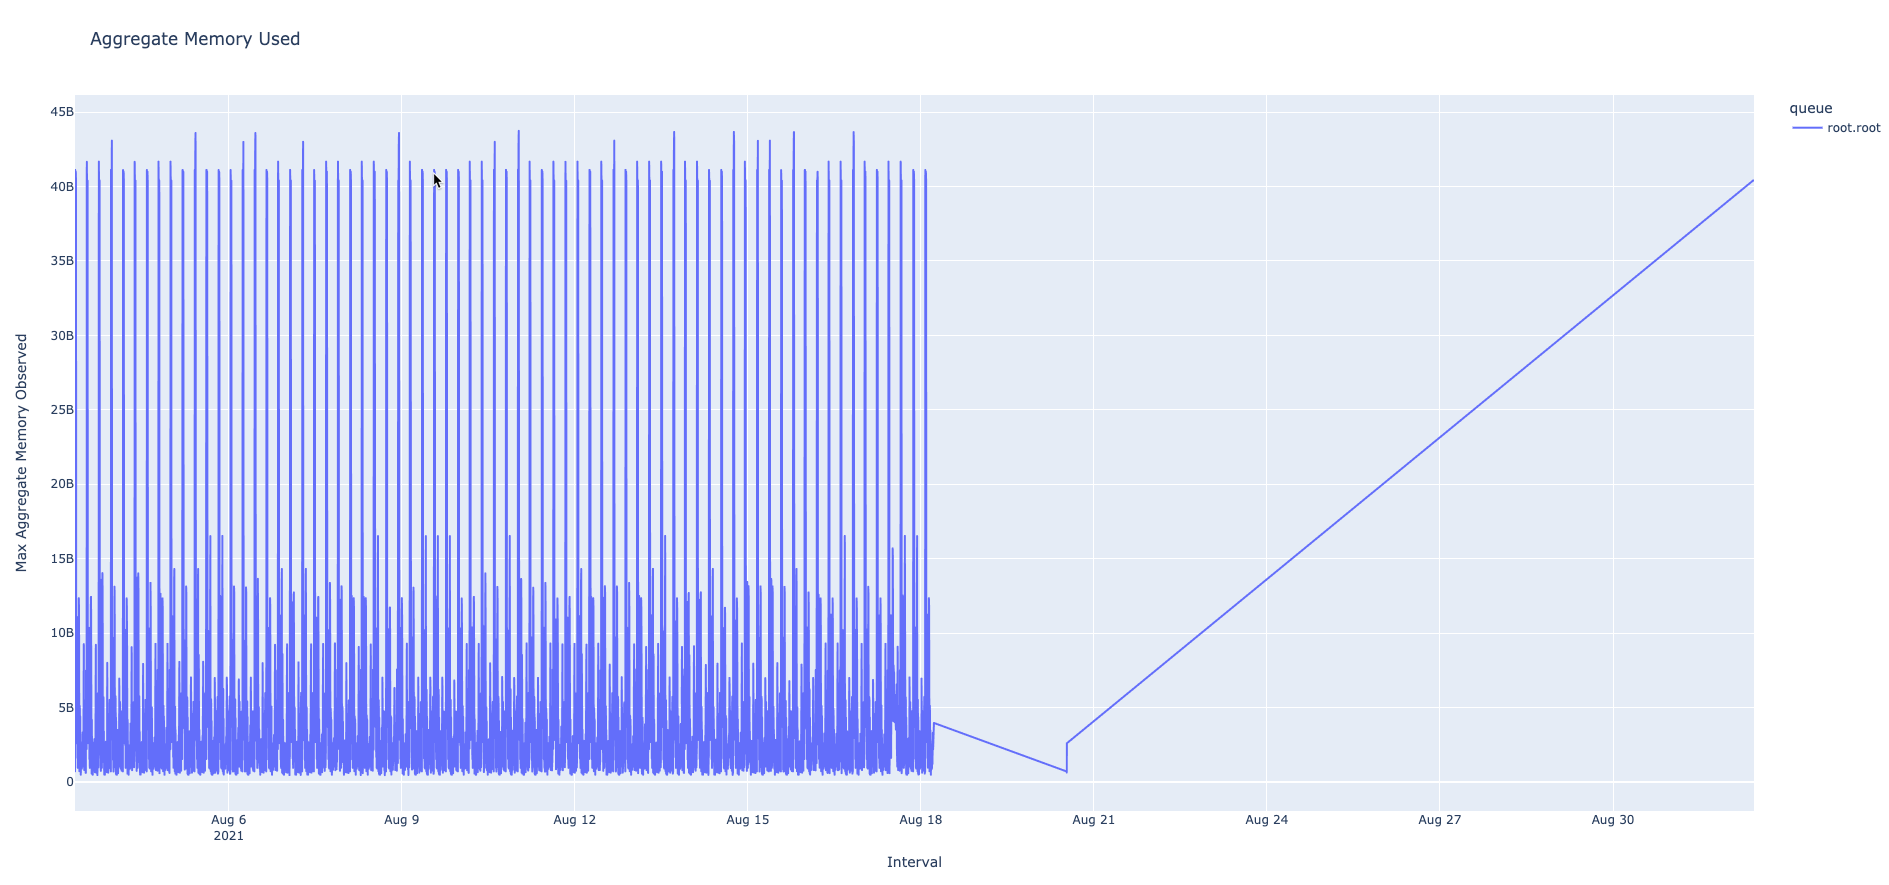
In this Impala Resource Pool Analysis report type sample, the Aggregate Memory Used is graphically represented in a line chart for the selected queue in the specified intervals.