Clusters (EMR)
Notice
The Clusters tab is shown on the Unravel UI only for the Amazon EMR platform.
From the Clusters tab, you can monitor the EMR clusters for cost, chargeback, resource utilization, and resource performance. All the clusters of EMR are listed with the cluster details; however, you can view the cost, chargeback, resource utilization, and resource performance only for the Unravel monitored clusters.
Monitor EMR clusters
After you sign in to Unravel for the Amazon EMR platform, click the Clusters tab. All the clusters that were started Today till the current time are displayed. You can further filter this list and view cluster data per your requirements.
Note
Data is NOT shown until you have added the AWS account details in Unravel. After you install Unravel, ensure to add the AWS account details. Refer to Add AWS account details in Unravel.
You can use the following filters to view the cluster data as per your requirements:
Filters
Description
ID
Specify the cluster-ID. You can specify any alpha-numeric characters in the ID, and the corresponding clusters bearing those characters are listed.
Note
This cluster-ID filter displays the searched clusters. You cannot combine this filter with other criteria, such as Date and time range.
Date and Time Range (UTC)
You can filter the clusters based on the time ranges (Today, 7 days, 14 days, 1 month, 3 months, 6 months, and 1 year). The details of all the clusters, during this time range, are displayed. This includes all the cluster states.
Events
Select an event to filter the clusters. The Events filter is available only from the Inefficient tab.
Name
Specify the name of the cluster. You can specify any character in the name of the cluster, and the corresponding clusters bearing those characters are listed.
Status
Specify any of the following statuses. The Status filter is only available in All and Inefficent tabs. All is the default filter.
Active: The active status of the clusters is indicated with
 The operational status of the groups is further classified into Waiting, Running, Bootstrapping, Provisioning, and Terminating.
 Terminated: The terminated status of the clusters is indicated with

Failed: The failed status of the clusters is indicated with
 . The failed status of the clusters is further classified into Terminated with errors.
Cluster tags
All possible tag keys are listed in categories. Select a tag with a category. Click
 next to a tag to deselect it. Also, see Tag clusters.
 Duration
Specify the duration of the cluster run to filter the clusters. You can move the slider to define the range of duration.
Cost
Specify the cost incurred to filter the clusters. You can move the sliders to define a cost range.
Installation
Specify if you want to view all the EMR clusters in your account or only those clusters that Unravel monitors.
Based on the selected filters, the clusters are listed in the following tabs:
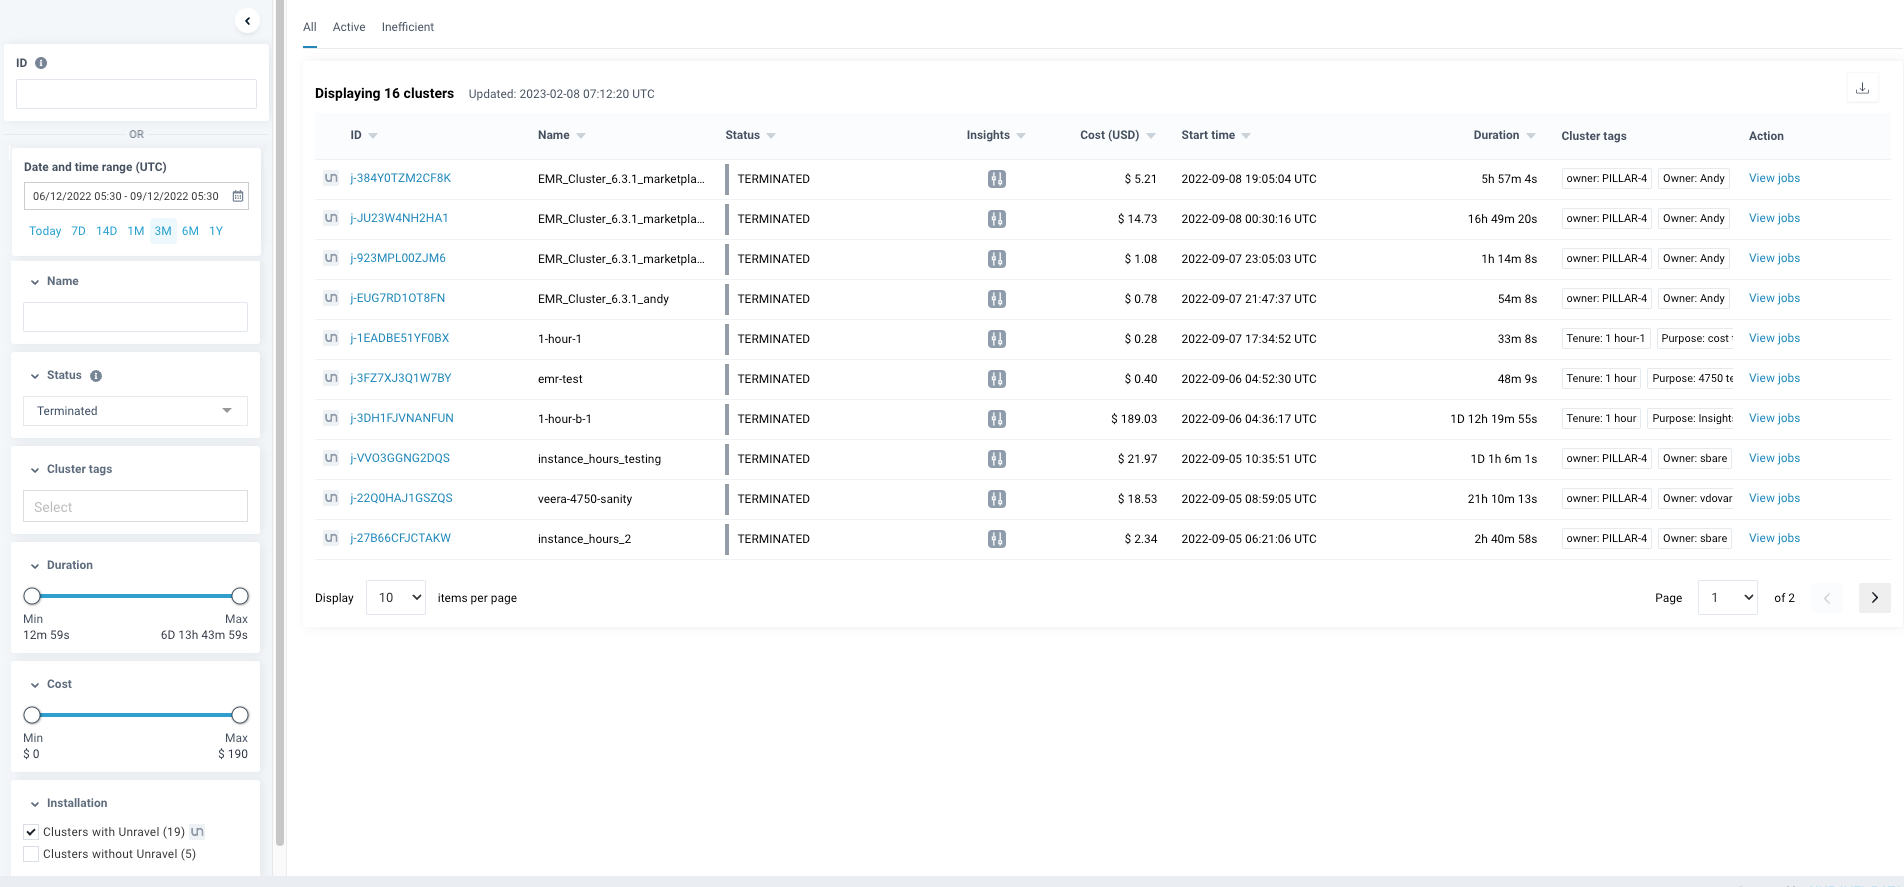
All
Shows all the clusters based on the applied filters.
Active
Shows all the active clusters based on the applied filters.
Inefficient
Shows all the clusters, based on the applied filters, for which Unravel has generated recommendations.
In the upper-right corner, click the
 Download CSV icon to download a list of clusters as a CSV file.
The following details of the clusters are shown in the cluster list:
 : The sign indicates if it is an Unravel monitored cluster.
 Cluster-ID of the cluster.
Name of the cluster.
Status of the clusters.
 : This sign against a cluster indicates an insight/recommendation available for that cluster. Select the Cluster-ID link to go to the corresponding cluster page.
 Cost incurred for running the cluster in that duration.
Start time of the cluster.
Duration for which the cluster was running.
Cluster tags used for filtering.
Action: Click the View Jobs link to the jobs page and view the jobs run on that specific cluster during that period.
Notice
Known Limitations
When you click the View Clusters link on the Cost-based pages and navigate to the Clusters page, the cluster numbers shown can vary. Sometimes fewer clusters are listed, and at times no clusters are shown. This is a known limitation due to differences in the definition of the time range selector for these pages.
Cost page
Shows all the clusters that have accrued cost in the selected period, which may be running or terminated in the selected period, irrespective of their start date.
Cluster page
Shows only those clusters that have started in the selected period.
Cluster details page
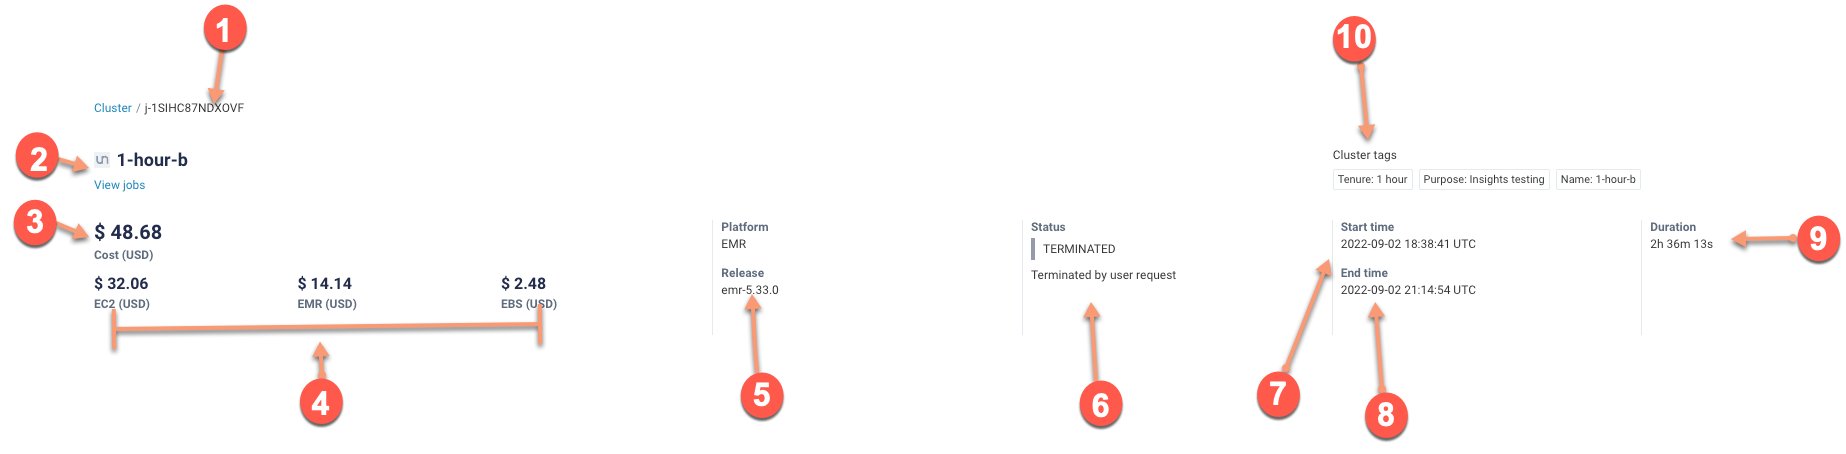
On the Cluster details page, you can view all the details of Unravel monitored as well as unmonitored EMR clusters for the selected time range. In addition, the Cluster details page displays the following information:
Sr. No | Description |
|---|---|
1 | The EMR cluster-ID. You can select the Cluster link to go back to the Clusters page. |
2 | Name of your EMR cluster. You can select the View Jobs link to check the jobs run on the cluster during the selected period. |
3 | The total cost incurred for the cluster is in USD. The total cost rounds off the individual cost of services (EMR, EC2, and EBS) and the sum of the individual cost. The cost is displayed in two decimal digits. Example: When rounding the following individual values and their sum value, the total cost may vary with a small number of cents.
In this scenario, the total cost may be rounded to $0.04 due to the nature of AWS calculating cost out to 5 decimal points. |
4 | Breakdown of the cost incurred for the cluster based on the services EC2, EMR, and EBS in USD. |
5 | Platform and the corresponding release build where the cluster is running. |
6 | Status of the cluster.
|
7 | Start time of the cluster. |
8 | End time of the cluster |
9 | Duration for which the cluster was running. |
10 | The tags that are associated with the cluster. |
The following tabs are included here:
Cost
From the Cost tab, you can view the cost insights and recommendations provided for a specific cluster. These insights can help you optimize the cluster costs and resources and thereby run the cluster more efficiently. Further, based on different node types (Master, Core, and Task), you can view the trends for cost, instances, CPU utilization, and memory utilization.
Performance
From the Performance tab, you can view the efficiency of the resources used to run the cluster. Further, you can view trend charts for the resource utilization and job counts based on each Application type, User, Queue, and State.
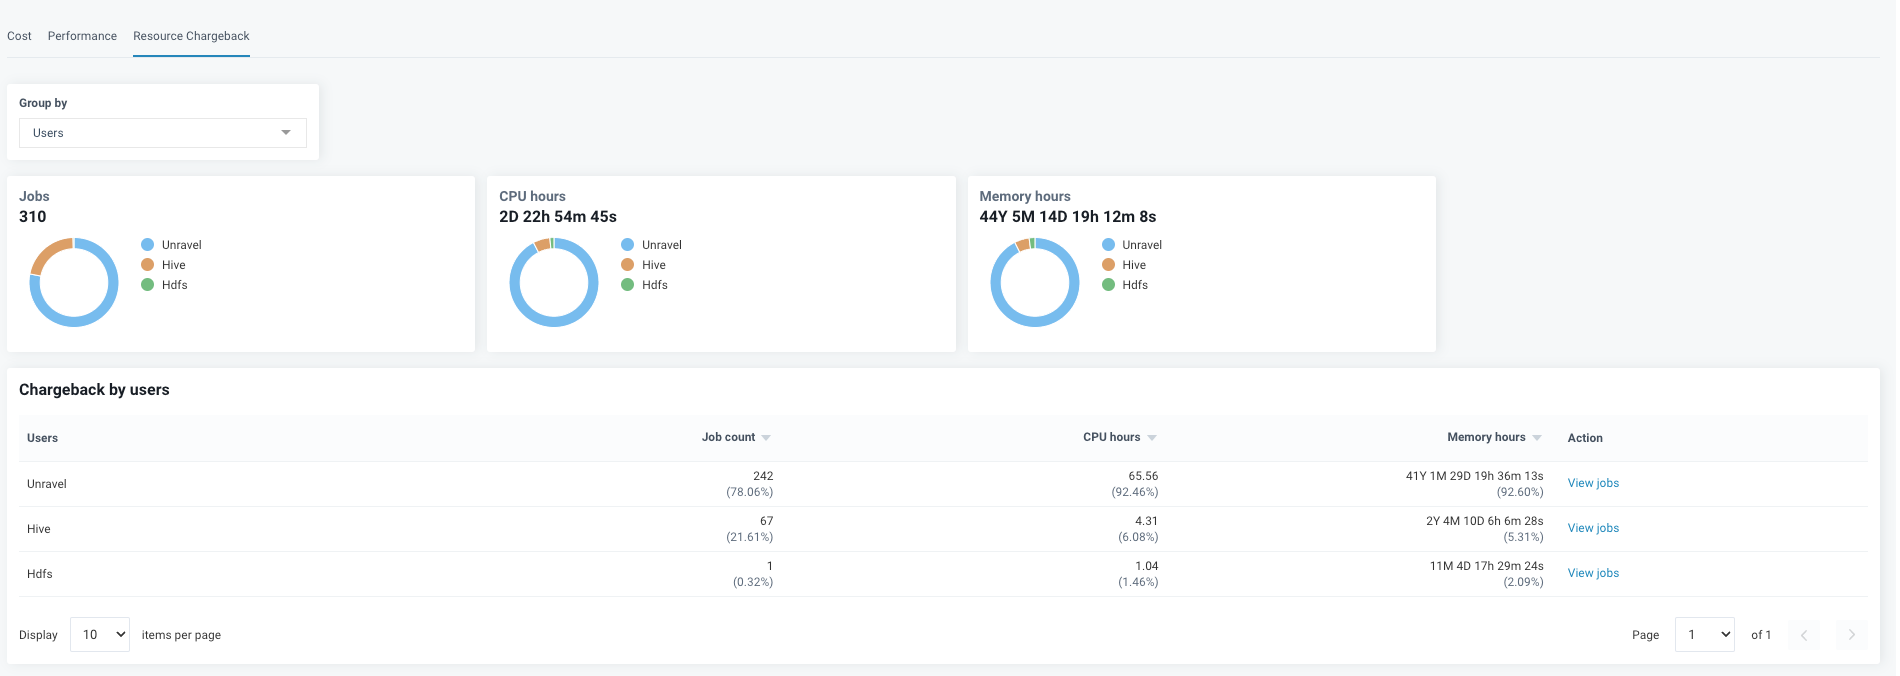
Resource chargeback
From the Resource Chargeback tab, you can view the chargeback details of the resources (Jobs, CPU hours, Memory hours) used in EMR clusters. Further, you can view trend charts of the resource chargeback based on App types, User, Queue, and State.
Monitoring EMR cluster cost and resource utilization
Run the following steps to get the complete details of your EMR cluster cost and resource utilization:
Sign in to Unravel from the Amazon EMR platform and select the Clusters tab. All the clusters that were started Today are displayed. You can further filter this list and view cluster data per your requirements.
From the cluster list, select the cluster-ID link of the cluster that you want to monitor. Then, the corresponding cluster details page is displayed.
Select the Cost tab and select one of the following node type options.
Master
Core
Task
The following trends are displayed based on the selected node type:
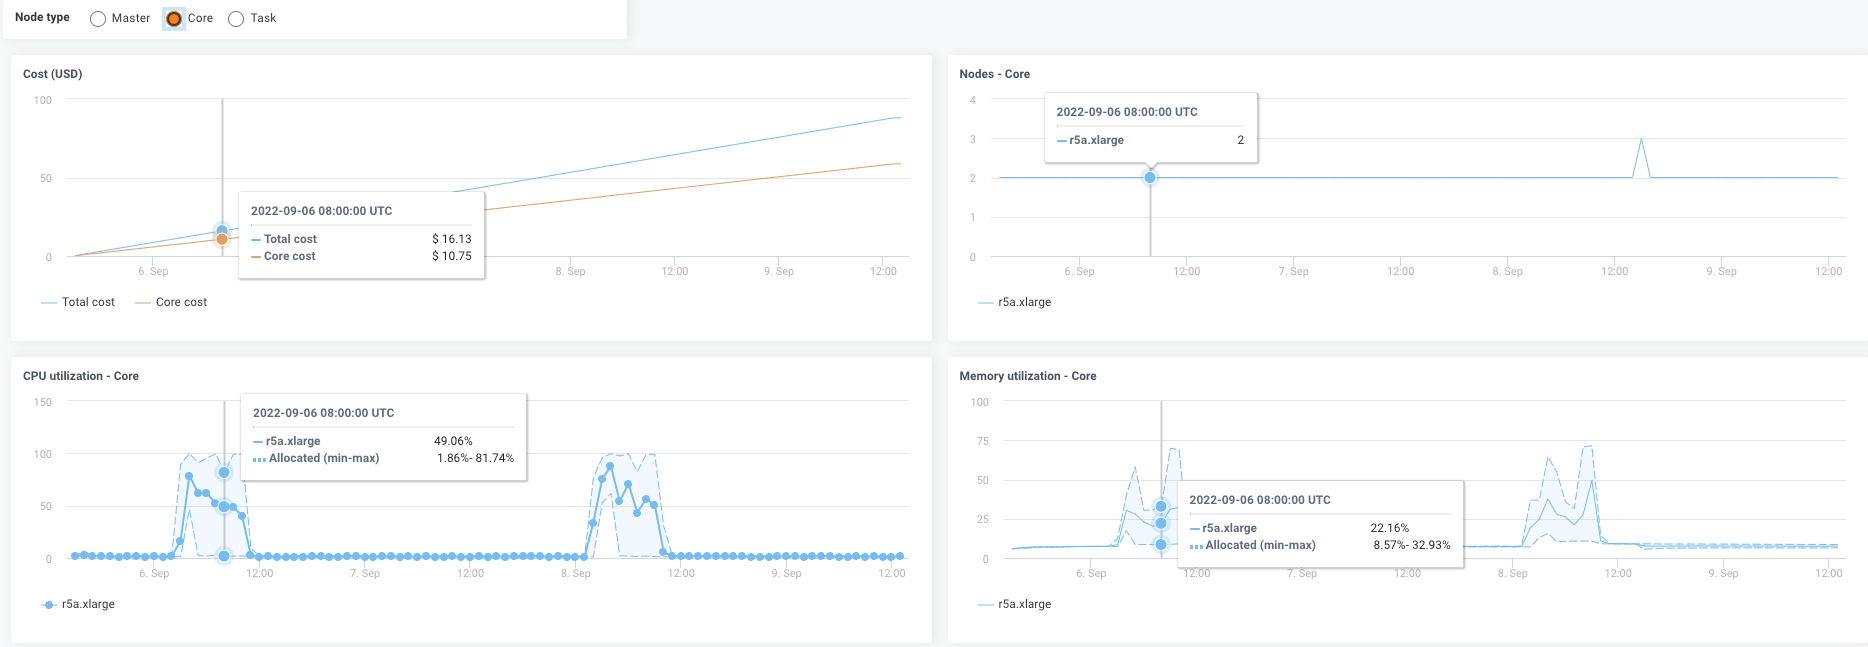
Cost
Shows the trendline of the cost incurred for the selected node throughout the cluster run. The total cost is shown beside the cost incurred for the selected node.
Interval is the DateTime delta between two data points. If the interval is not provided in the request, the backend takes one of the default intervals. The default intervals are based on the
deltabetweenfromandtodates.delta <= 1 Day: 15-minute interval
1 Day< delta<= 7 days: 1-hour interval
7 Days<delta<=6 Months: 1-day interval
6 Months<delta<=1 Year: 2-day interval
delta> 1 year: 7-day interval
Nodes
Shows the trendline of the instances that were scaled for the workloads. In addition, the counts of each instance at various periods are jotted in the trendline.
CPU utilization
Shows the trendline of the CPU utilization based on the selected node in percentage. In addition, the average utilization is marked along with the maximum and minimum ranges.
Memory utilization
Shows the trendline of the memory utilization based on the selected node in percentage. In addition, the average utilization is marked along with the maximum and minimum ranges.
View cluster insights
The cluster insights provide recommendations for running your clusters efficiently with optimized costs and resources. Unravel estimates and presents the savings for each node type with the recommended instances over the inefficient ones. The estimation is for both cost optimization and resource optimization.
Notice
Known Limitation
Due to the known limitations, node downsizing recommendations are not suggested for the following scenarios.
When only cluster recommendations are applied without applying Application recommendations.
When the workloads require high IO and partitioning.
When the Spark configuration spark.dynamicAllocation.enabled is true.
When the AWS EMR autoscaling is enabled.
When the workload must need parallelism (multiple CPU cores).
Potential performance degradation (increase in cluster execution time and sometimes higher cost) and no cost benefits are achieved if recommendations are used in any of these scenarios.
On the Clusters page, the clusters marked with this icon indicate that cluster insights are given for that cluster.
Sign in to Unravel from the Amazon EMR platform and select the Clusters tab. All the clusters that were started Today are displayed. You can further filter this list and view cluster data per your requirements.
Check if this icon
is shown against any cluster. It indicates that the cluster is provided with cluster insights. Click the cluster-ID link. The Cluster details page is displayed along with the details of the Cost tab.
From the Cost > Insights section, select a data point to view the insight at that specific time.
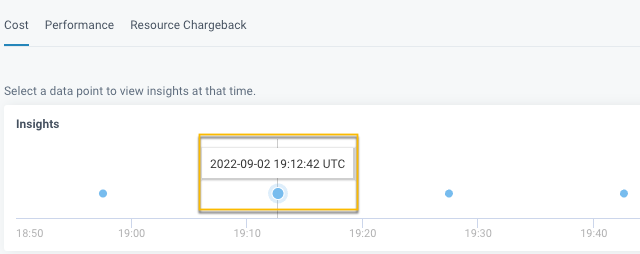
The Node Downsizing panel is displayed on the right.
The insights are displayed for each node type (Master, Core, and Task) in the Node Downsizing panel. The insights provide total estimated savings, for the recommended instance, based on the following optimization options:
Resource-optimized insight suggests an instance type that can lower cost and maintain sufficient resources for the workload.
Cost-optimized insight suggests an instance type that can lower cost but may result in a longer run time.
Tip
To achieve the best results, apply the first round of recommendations (both for Cluster and Application ones together). Reapplying any further rounds of recommendations may or may not give any cost reduction or resource efficiency benefits.
View the performance of resources in EMR clusters
Sign in to Unravel from the Amazon EMR platform and select the Clusters tab. All the clusters that were started Today are displayed. You can further filter this list and view cluster data per your requirements.
Select the cluster-ID link of the cluster for which you want to view the performance of resources. The Cluster details page is displayed.
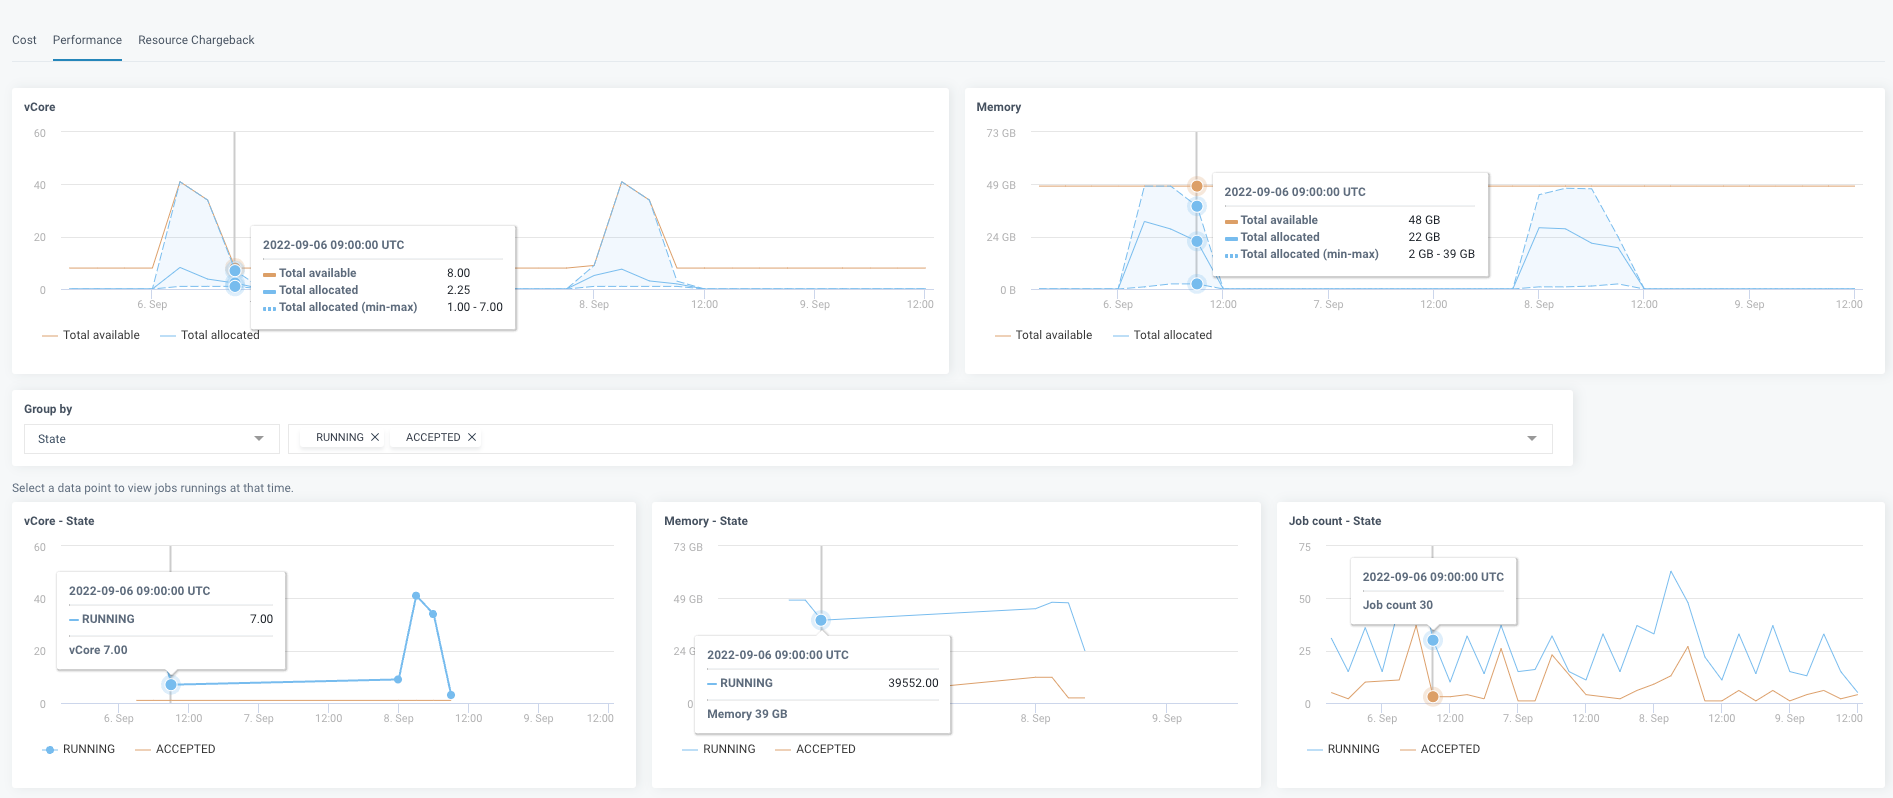
Select the Performance tab. The trend charts for vcores and memory are displayed. You can further group the performance details with the following parameters and view the trends for vcore, memory, and job counts. You can drill down to the following parameter values to view the trend charts. In the following image, the trend charts show the trends of the resource performance that is grouped by State and further drilled down to Running and Accepted values.
Application type
User
Queue
State
View the resource chargeback of EMR clusters
Sign in to Unravel from the Amazon EMR platform and select the Clusters tab. All the clusters that were started Today are displayed. You can further filter this list and view cluster data per your requirements.
Select the cluster-ID link of the cluster for which you want to view the resource chargeback details. The Cluster details page is displayed.
Select the Resource Chargeback tab.
Select one of the following Group by options.
App Types
Queues
Users
The Chargeback details are shown in donut charts and a tabular format, based on the Group by the option that you have selected for Jobs, CPU hours, and Memory hours. You can click the View jobs link in the table to check the jobs run on the cluster during the selected period.