Cost trends (EMR)
From the Cost > Trends page, you can view the trend data for EMR clusters. A cost trend chart is a graphical representation of how the cost of EMR clusters changes over time.
Note
Unravel users with admin and read-only admin permissions can access the Cost > Trends page.
The cost trend chart plots the cost and cluster count values on the vertical axis against the date values on the horizontal axis.
When you hover over a trend line in the Cost and Cluster Count sections, the selected trend details are displayed. For example, you can view the trends for the total cost and cluster count for a selected date range (the from date and to date, and an interval along with other filters to the backend). The backend returns a group of data points between the specified time range.
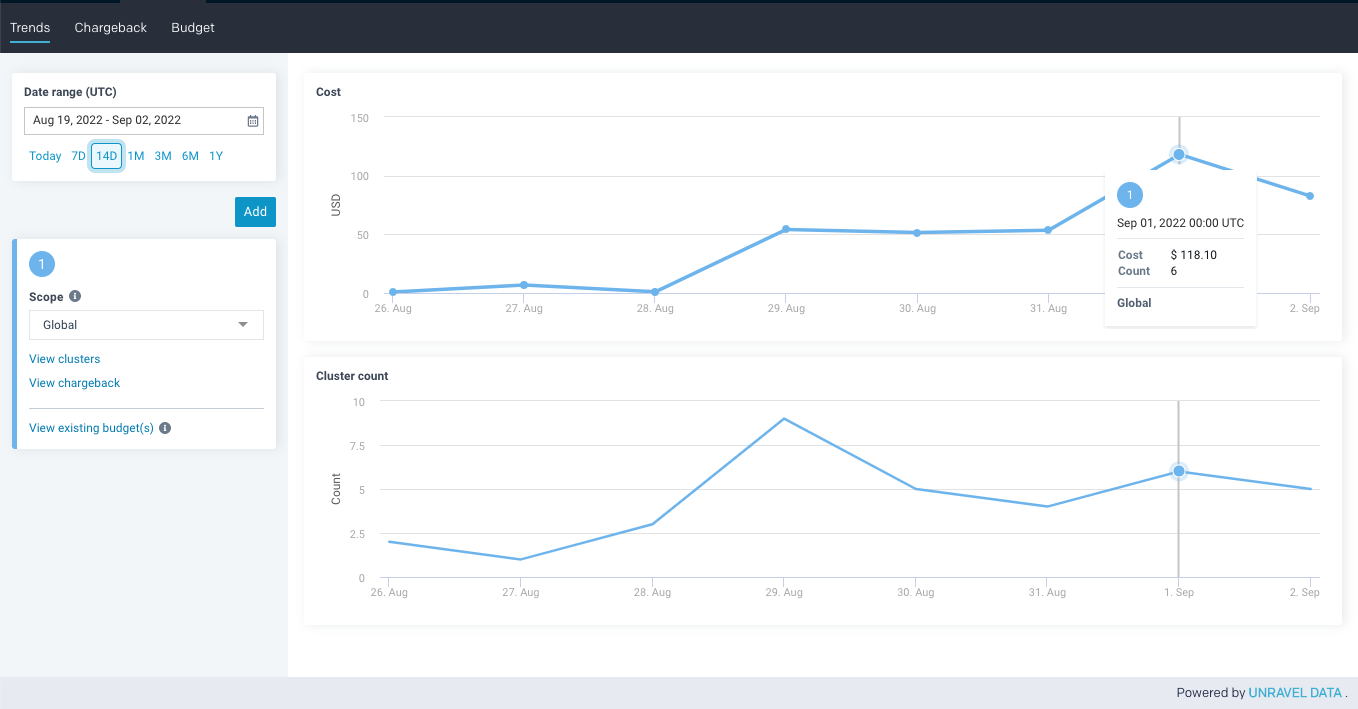
Each data point contains the following three fields and is separated by the time delta equal to the interval:
Date: Displays the start interval for the data point for which the cost and cluster count are calculated. The date time format is
yyyy-MM-dd'T'HH:mm:ss.SSS'Z'.Cost: Displays the cost of clusters in the
DateandDate+Intervaltime range. You can compare the total cost for a day, month, or year.Count: Displays the number of clusters in
DateandDate+Interval
Additionally, the trend number and the scope name are also displayed.
Interval is the DateTime delta between two data points. If the interval is not provided in the request, the backend takes one of the default intervals. The default intervals are based on the delta between from and to dates.
delta <= 1 Day: 15 minutes interval (RAW)
1 Day< delta<= 7 days: 1-hour interval
7 Days<delta<=6 Months: 1-day interval
6 Months<delta<=1 Year: 2-day interval
delta> 1 year: 7-day interval
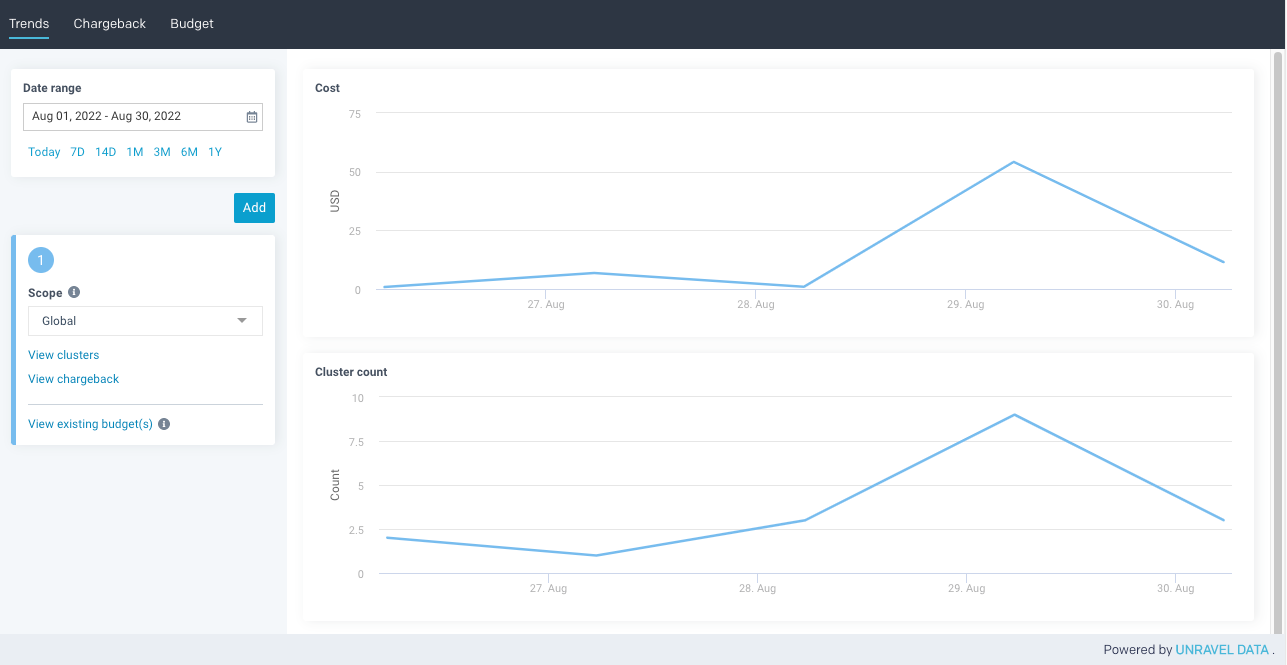
On the Unravel UI, navigate to Cost > Trends.
On the Trends page, select a date range from the Date Range field to view the trend graphs. The selection starts from the current day. You can select any preset date range or a custom date range between 1 day (minimum) and 1 year (maximum).
Only one trend is displayed in the selected state.
Click the Add button
 to add a new trend.
 Note
You can add up to five trends.
From the Scope list, select one of the following options to view the trend graphs:
Scope
Description
Global
(Default)
The Global scope is selected by default. When the Global scope is selected, all clusters detected by Unravel are included.
Tags
Select key=value pair tags—for example, Purpose: Fraud Detection, Tenure: 1 month, and Purpose: Image Processing. You can add a maximum of up to five key=value pair tags.
Multiple tags are evaluated with the AND logic. Clusters that have all the specified tags are included.
When multiple tags are selected, the tags must have different tag keys.
Cluster
Select a cluster for a trend. You can select only one cluster for a trend. To compare clusters, you must add another trend and assign a cluster.
Note
After adding the first scope, the Remove link is displayed for subsequent scopes: the 2nd, 3rd, 4th, and 5th scopes. You can remove the selected scope.
Based on the scope selection, the following links are displayed:
Scope selection
Links displayed
Action
Global
View clusters:
View chargeback
View existing budget(s) (displayed if a budget exists)
Create budget (displayed if a budget does not exist)
Click View chargeback to view the chargeback importing scope from the selected trend. For information, see Viewing the cost chargeback of EMR.
Click View cluster to view the clusters importing scope from the selected trend. For information, see Clusters (EMR).
Click View existing budget(s) to view all budgets available in the selected scope (Global, Tags, and Cluster).
Click Create budget to create a new budget. The scope of the selected trend is imported into the new budget. For information, see Creating a budget.
Tags
View clusters
View chargeback
View existing budget(s) (displayed if a budget exists)
Create budget (displayed if a budget does not exist)
Cluster
View clusters
View existing budget(s) (displayed if a budget exists)
Create budget (displayed if a budget does not exist)
After selecting the scope, the trend line is added to the graphs. Then, the color and unique number are assigned to the trend. Using the trend's color, you can correspond with the chart line. Each trend graph is displayed in a different color.