Cost Chargeback (Databricks)
Note
This tab is visible only for Databricks clusters.
From this tab, you can create and view the Chargeback reports for the following:
Databricks Clusters (default)
Shows the chargeback cost attributed to cluster creators, for the specified time range and filters, which are organized based on the selected Group by option.
Job runs
Show the chargeback cost attributed to job run creators, for the specified period and filters, which are organized based on the selected Group by option.
Generate chargeback report for Databricks clusters
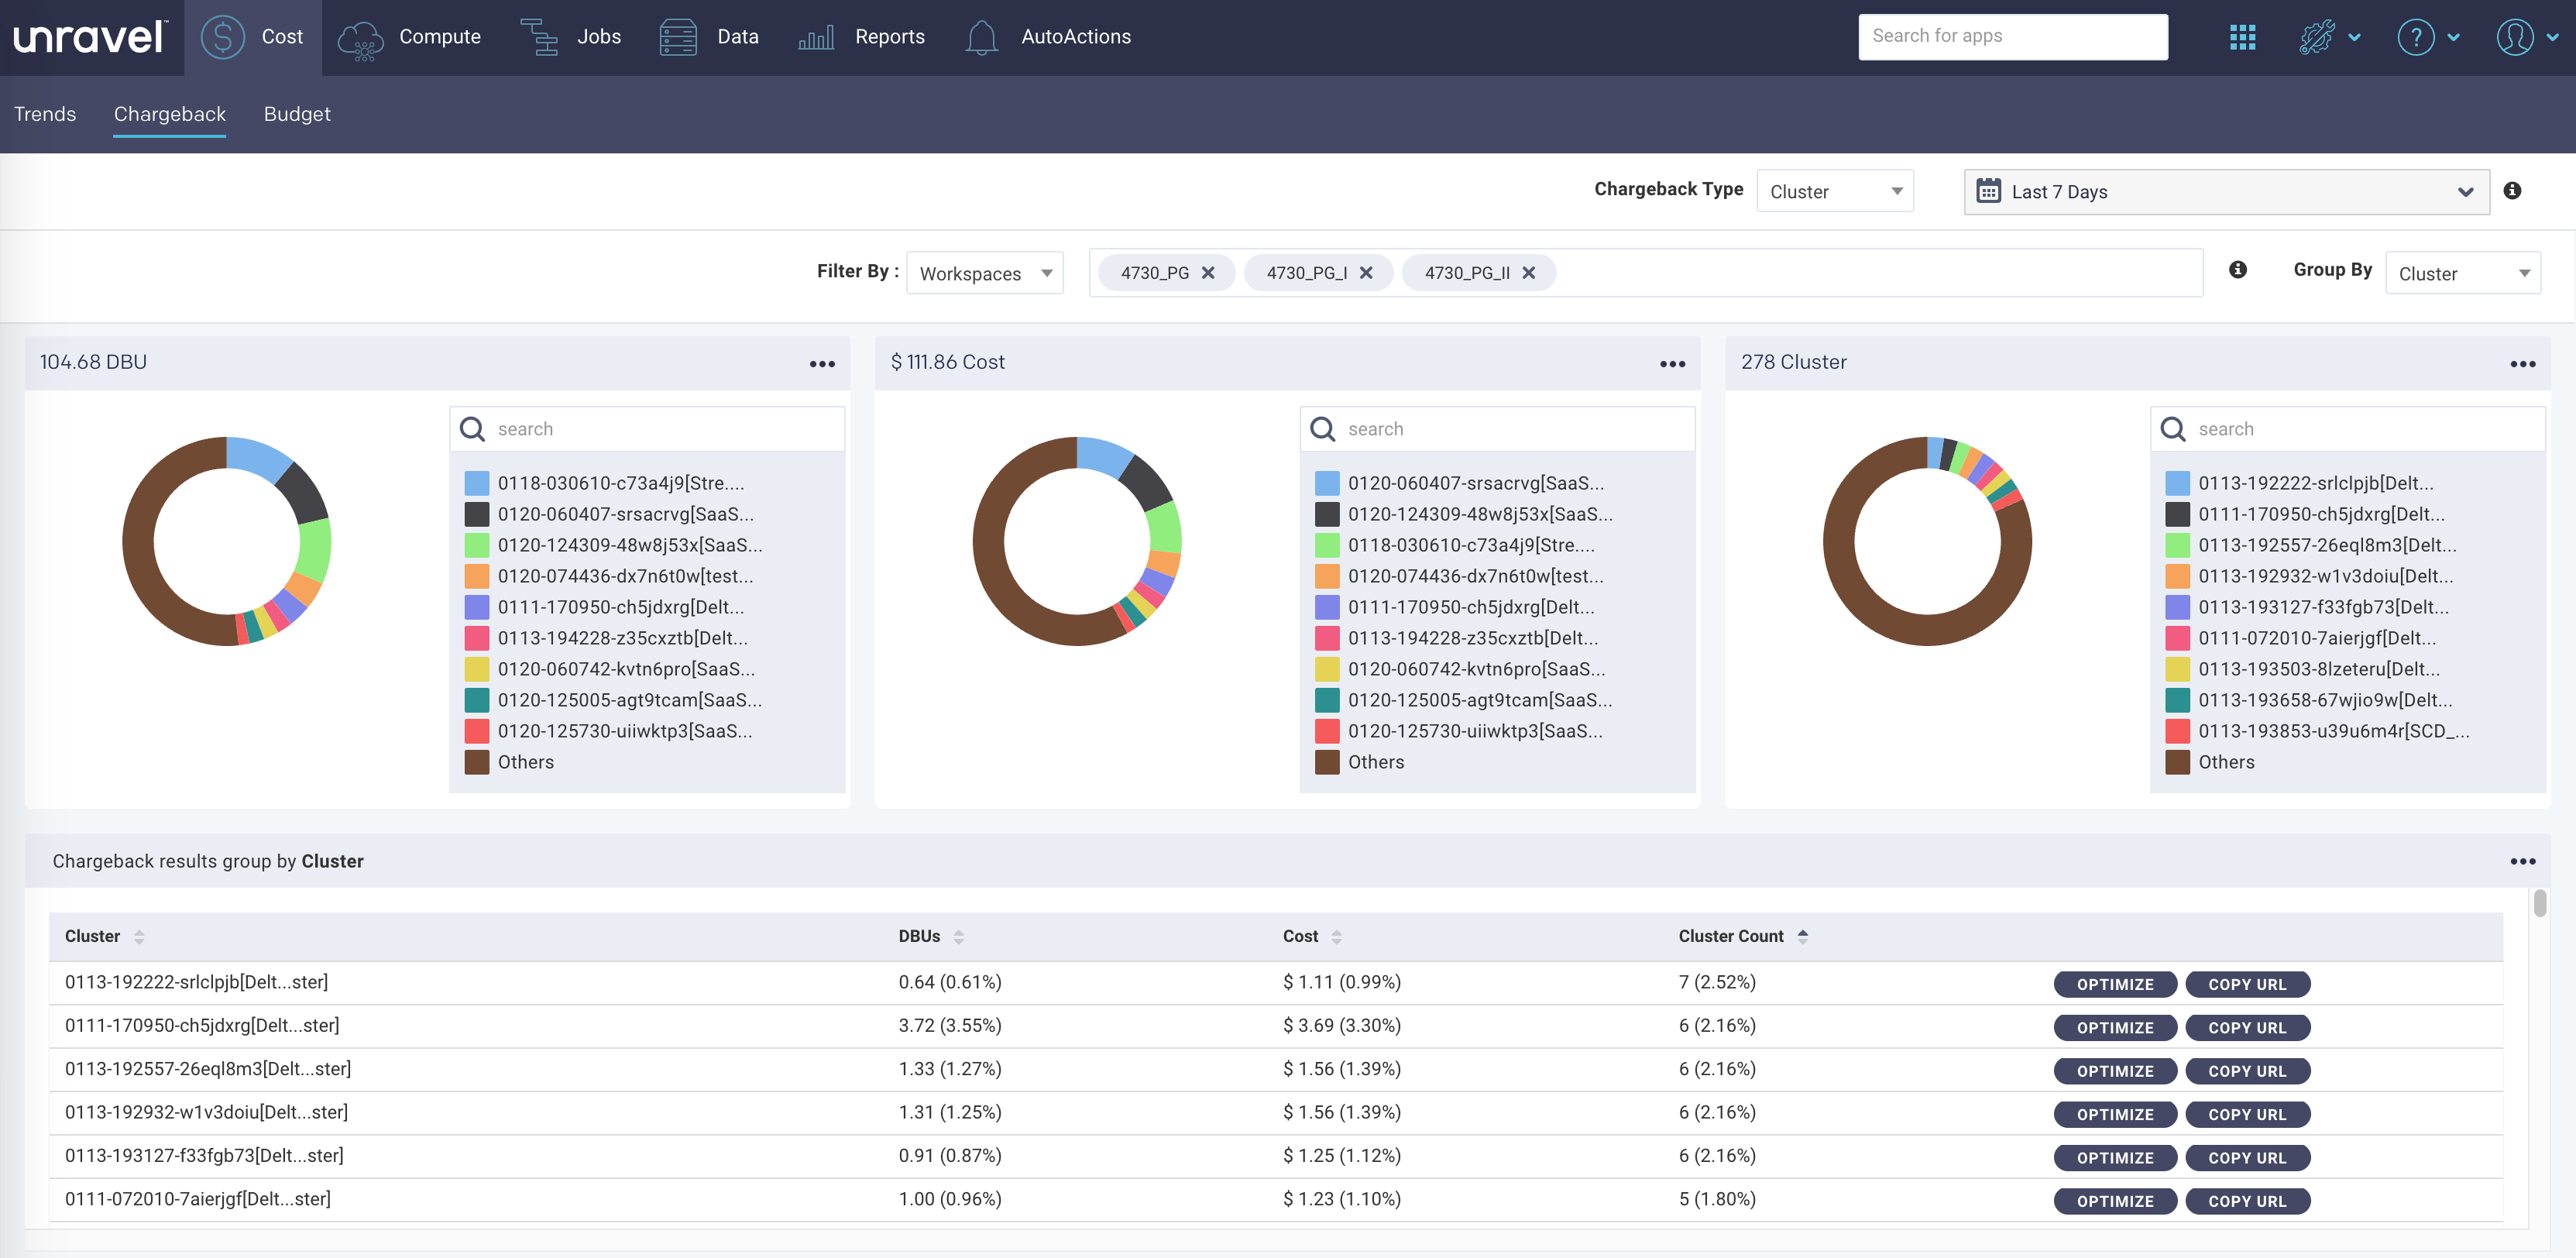
Chargeback report for clusters
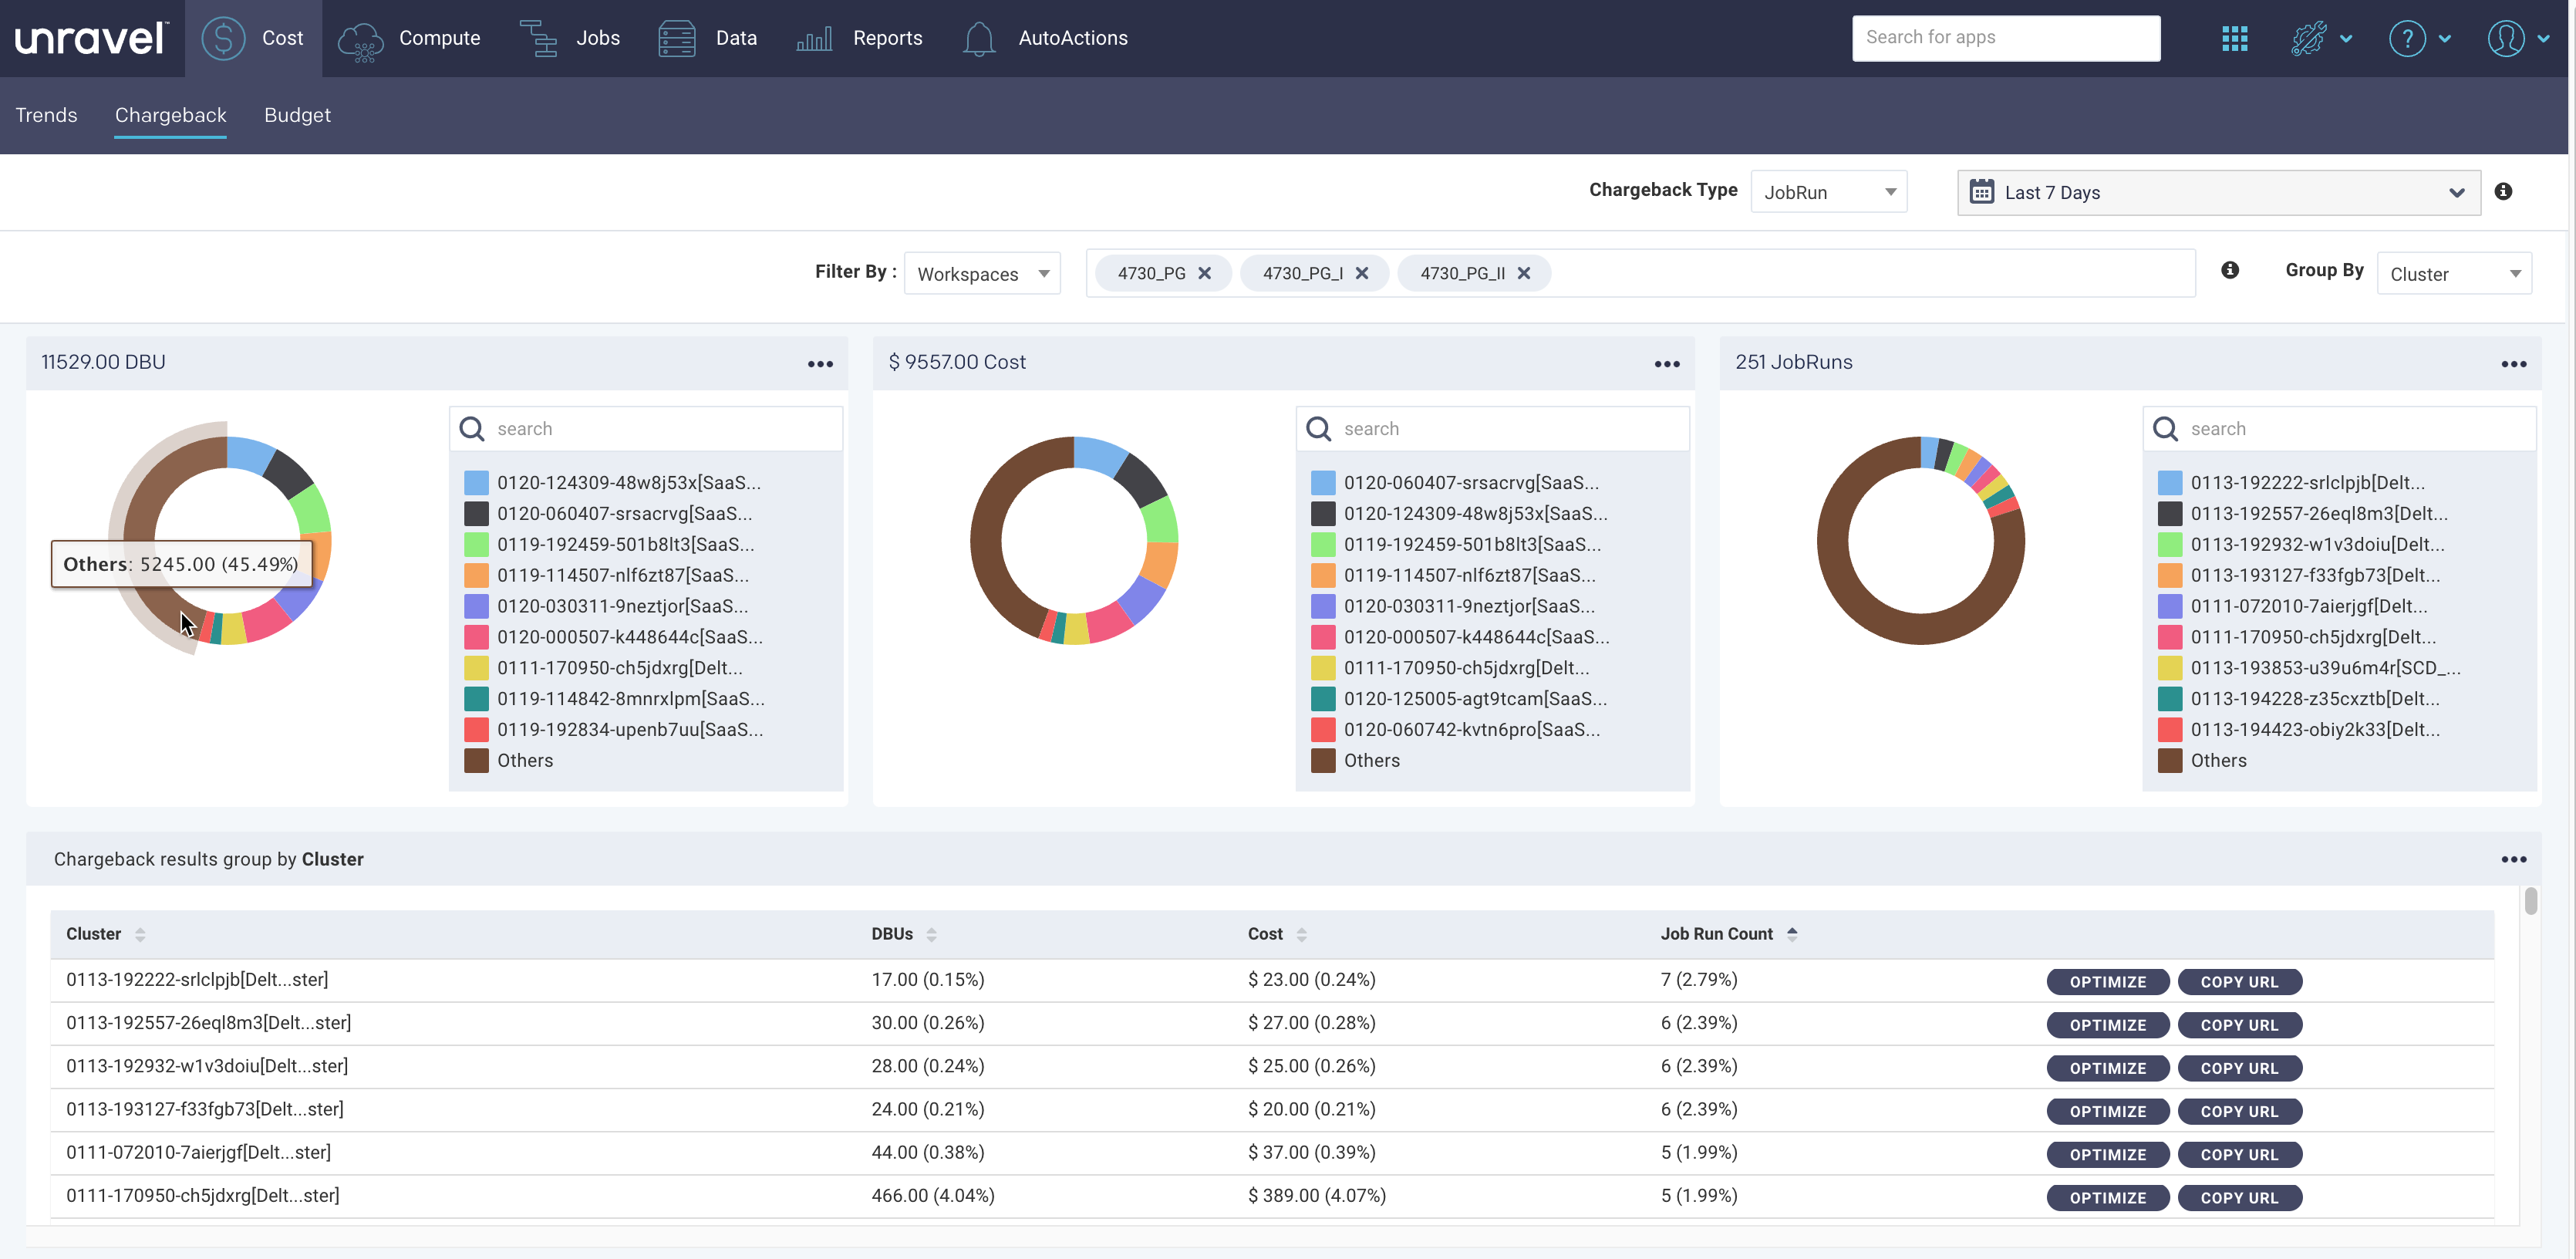
Chargeback report for job runs
From the Chargeback Type drop-down on the upper-right, select either Cluster or JobRun.
Click
 and select a time range to view the chargeback reports. You can select any of the preset time ranges (Last 7 days, Last 14 days, Last 30 days) or select a custom time range, which can be between 1 day (min) and 90 days (max)
From the Filter By drop-down, select any of the following options:
Workspace (default)
User
Clusters
Tags
A tag comprises a key and a value. You must specify both the key and the value for each tag.
From the adjacent dropdown, you can drill down to a specific filter item to view the trend graph. For example, if you have selected the User filter earlier, you can select user1, user2, user3, etc. You can choose a maximum of up to 5 such filter values.
Select any of the following Group By options. A Group by determines the category against which the total Chargeback cost of a selected Filter By option is calculated and organized.
User
Workspace
Cluster
Tag key
For example, when you select a Filter by option as Workspaces and the group by option as Users, then the chargeback is computed for only the selected workspaces and then grouped by users.
The details of the Cluster chargeback report are displayed in the following formats:
Donut charts: The donut charts show the chargeback results for the DBUs, Clusters/JobRuns, and Cost.
Hover over a donut section to see the slice name, the value, and the percentage in the whole.
Note
There are times when a cluster/job run cannot be grouped by the selected option. In such cases, they are listed as NULL.
Tables: The chargeback report details are displayed in a table based on the selected Group By option.
Columns
Description
User/Workspace/Cluster/Tag key
The selected Group by option.
DBUs
Total DBU consumed by the selected Group by option, in units and percentage, for the corresponding Filter by option.
Cost
Cost calculated based on the estimated run durations of the underlying instances, DBUs, and VM price components for the selected Group By option. Storage costs are not included. The actual cost may differ.
The cost units and percentage are shown.
Cluster count
The total active cluster count/job runs for the selected Group by option in units and percentage.
Click
 for the corresponding Group By option and you can view the details of all the jobs in the selected time period. You can also click
  to copy the link to the Jobs page and view the Jobs for the selected time period.