Pipeline Health & Observability
From the Pipeline Health and Observability (PHO) interface, you can monitor all the workflows. You can view details about all the pipelines and pipeline runs, which includes the successful, failed, or degraded runs for a selected period. All the workflow management platforms such as Airflow and Oozie are supported in PHO. You can integrate Unravel with the Airflow platform in your system. Refer to Integrating Airflow.
Viewing pipeline details in Pipeline Health & Observability
From the Pipeline Health & Observability, you can view all the details of the pipelines monitored by Unravel. After installing Pipeline Health & Observability, do the following:
Open the Pipeline Health & Observability app using any of the following methods:
Use a browser and open the following URL. In the URL, provide the Unravel host and the port number as 8080:
http://
<unravelhost>:8080Open the Unity One app with the following URL and click the Go button on Pipeline Health & Observability.
http://
<unravelhost>:8111
Select a time range from the date picker.
The details of the pipeline runs are displayed. The following details are shown:
Total pipelines: The total number of pipelines monitored by Unravel.
Total pipeline runs: The total number of runs made by each pipeline.
Total successful runs: The total number of successful runs by each pipeline.
Total failed runs: The total number of failed runs by each of the pipelines.
In the Summary tab, you can view the failed and degraded pipeline runs with their corresponding details for the selected period.
In the All Pipeline runs tab, you can view all the details of all the pipeline runs for the selected period.
For a deeper analysis of a run, click the Pipeline Run ID link. From the details page, you can do the following:
View the run details
Comparing a pipeline run with the baseline run in Pipeline Health & Observability
In cases of pipeline run failures, you can compare a specific run with the baseline run to examine the anomalies that led to the run failure.
Open the Pipeline Health & Observability app and select a time range from the date picker. The pipeline runs in that specific period are listed.
Click the Pipeline Run ID link that you want to analyze. The Pipeline Observer page is displayed with the run details.
In the BASELINE SELECTOR section, click From recent pipeline runs.
From SELECT A RUN, choose a pipeline run that you want to compare with the baseline run.
The details of the compared KPIs are displayed below in the BASELINE KPIS and PIPELINE RUN KPIS.
From the Gantt Chart tab, you can view the pipeline run details of the baseline run and the selected pipeline run. Each of the steps in the run is shown.
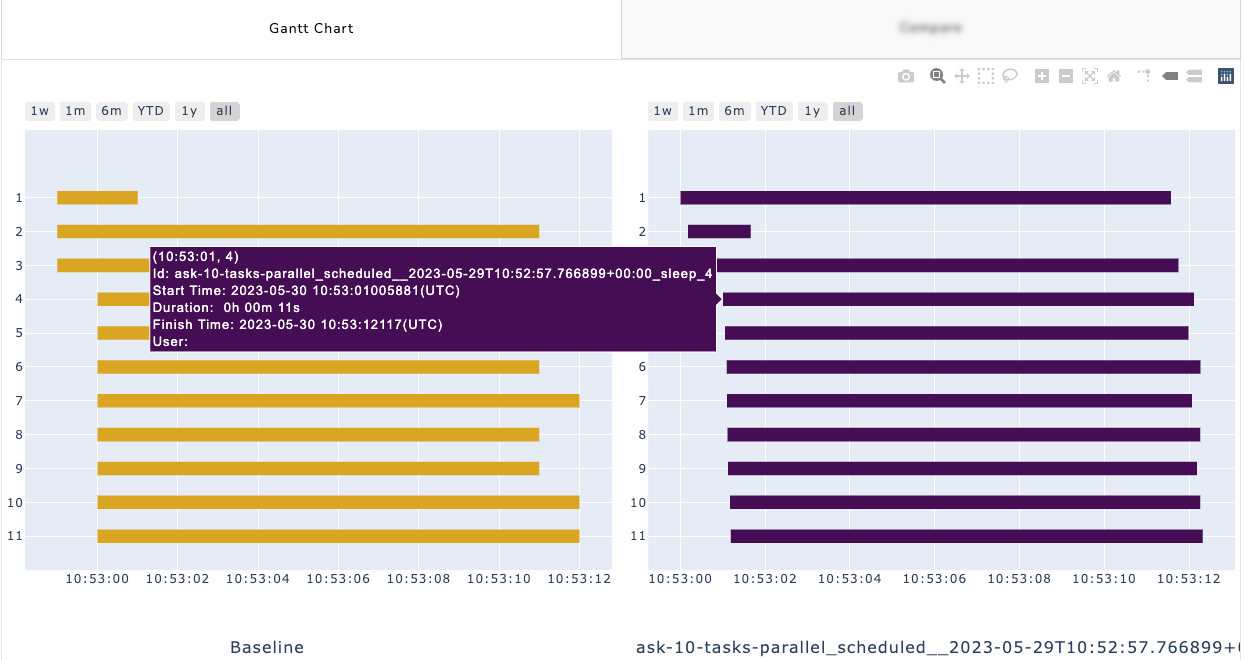
From the Compare tab, you can view the compared metrics.
Click Compare Apps. The COMPARE APPS page is displayed. You can select one of the following metrics for comparison.
Kind
Status
Duration
The value of the KPI can be compared in the Baseline and Pipeline run tables.
Viewing insights about failed pipelines in Pipeline Health & Observability
Open the Pipeline Health & Observability app and select a time range from the date picker. The pipeline runs in that specific period are listed.
Click the Pipeline Run ID link that you want to analyze. The PIPELINE OBSERVER page is displayed with the run details and the insights are shown in the Pipeline Insight box on the right.