Queries (Snowflake)
From the Queries page, you can access comprehensive information about all the queries linked to the Unravel-monitored warehouses. You can explore, filter, analyze your queries, and efficiently manage your queries from this page.
The Queries page helps you to :
Filter queries efficiently
Filter your queries using filters such as Query ID, time period, user, warehouse, status, insights, cost, duration. This allows you to pinpoint queries that match your criteria precisely.
Explore queries
Explore similarities among queries by selecting Same Signature Queries and compare different queries to understand their performance. This helps you identify areas for improvement and optimization.
Streamline the query management process
Filtering Snowflake Queries
On the Unravel UI, select Queries.
Select any of the following filters from the left panel. The Queries are listed on the right based on the filter selections.
Note
In the Unravel Snowflake UI, query reflection may exhibit delays, especially for data polling queries. To help mitigate these delays and improve query reflection, consider increasing compute capacity by adding more clusters when more unravel queries are in a running state or queued state. For example, if your warehouse is of size X_SMALL, raising the minimum cluster count to X based on warehouse load should enhance query visibility and response times.
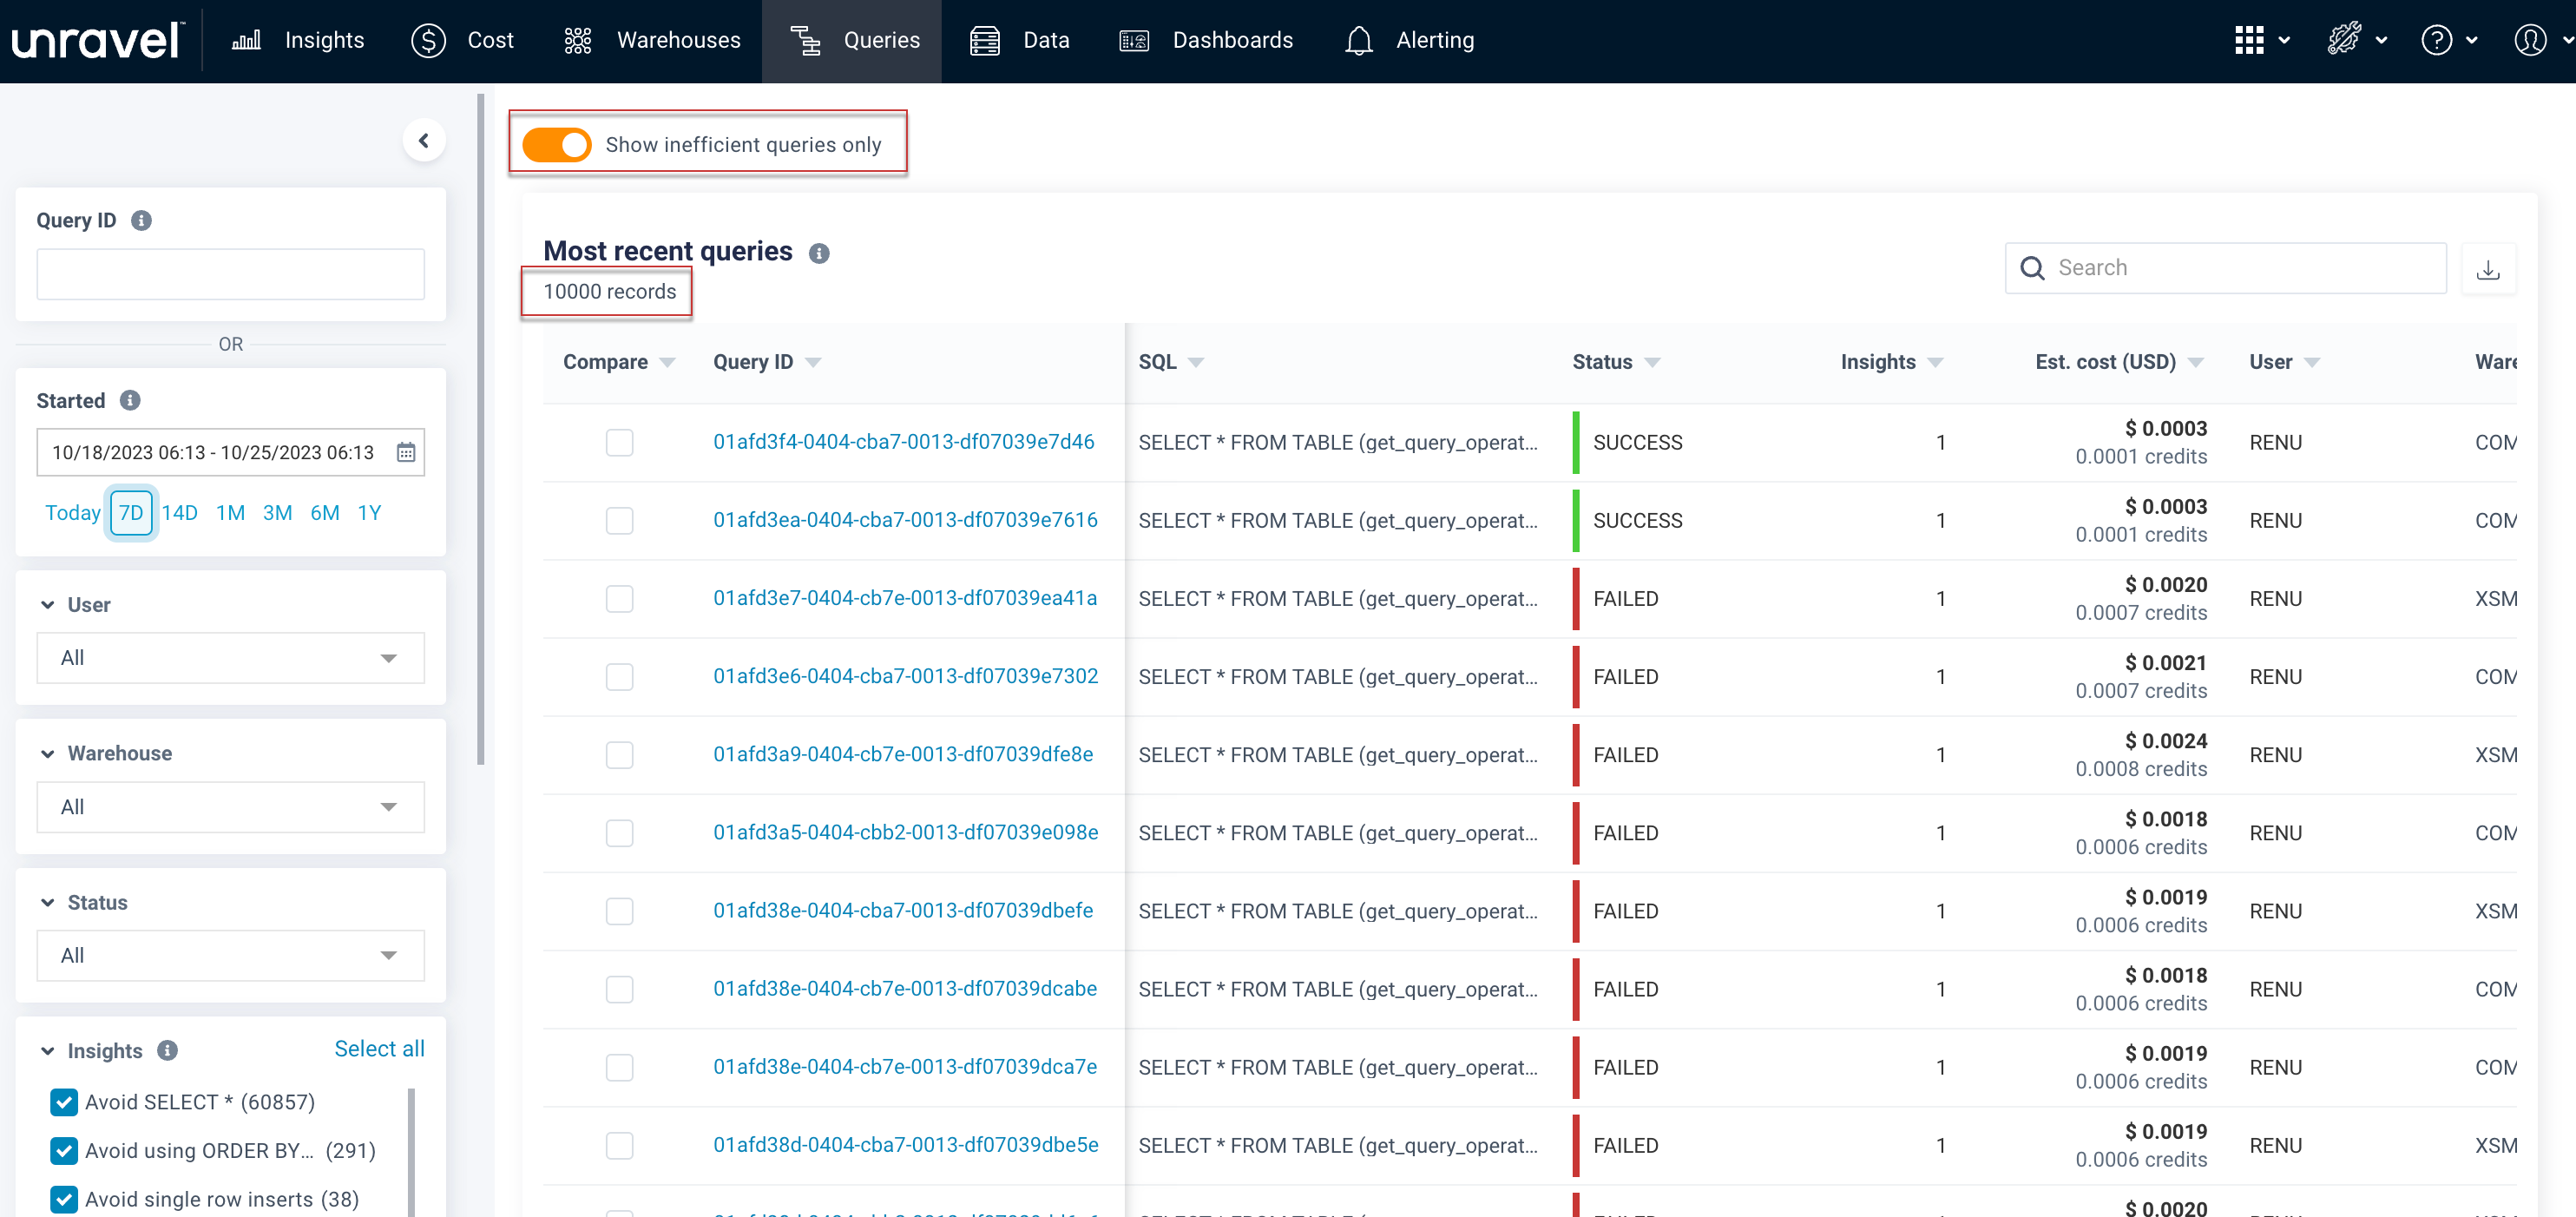
Use the toggle button at the top of the page to display the inefficient queries only. By default, the Show inefficient queries only filter is displayed.
The total number of queries that meet the filtered criteria is displayed at the top of the page.
Filter
Description
Query ID
Query ID to filter the queries with the required ID.
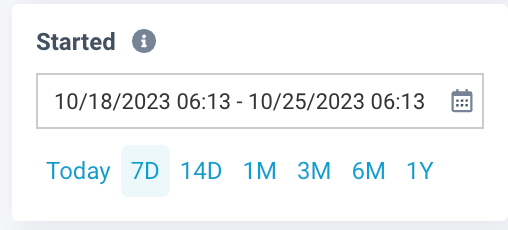
Started
Queries started in a specific period. These can be Today, seven days, 14 days, one month, three months, six months or one year. You can also select the required time period with the date picker.
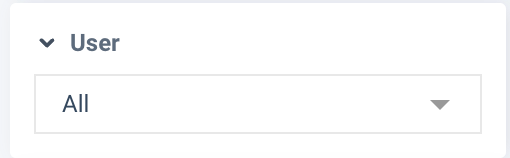
User
User to filter the queries with the required user.
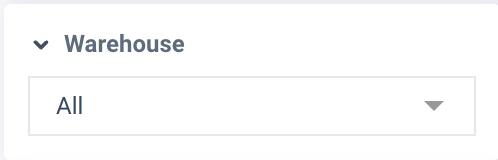
Warehouse
Warehouse to filter the queries that belong to the selected warehouse.
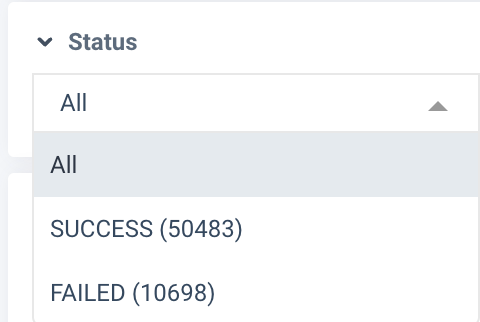
Status
Status of the query. The options are Success and Failed.
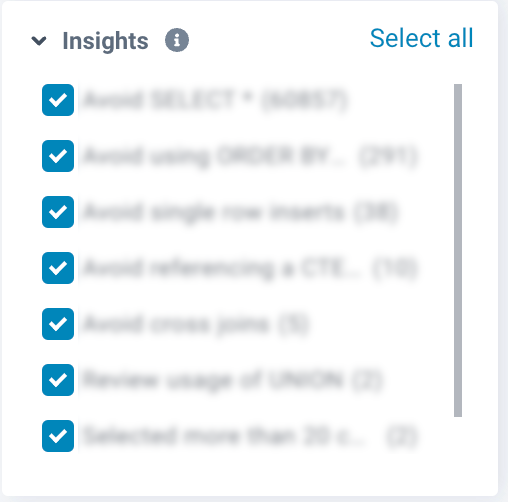
Insights
The queries attached to the selected insight are displayed.
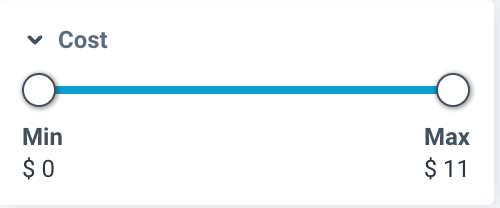
Cost
Use the sliders to set the minimum and maximum values for the cost. The queries that fall in that range are listed.
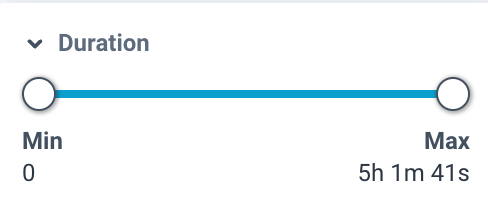
Duration
Select the duration of the queries run to filter the queries.
A table with the following columns shows the filtered list of queries.
Tip
All the columns in the queries list table can be sorted in ascending and descending order.
Specify a keyword in the
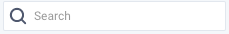 search box, and the queries matching the keyword are immediately listed.
 Click
 to download the job list in a CSV format.
 From
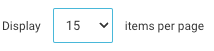 , you can select the number of query items that you want to be listed on a page. This can be 10, 15, 25, 50 and 100.
 Use the pagination
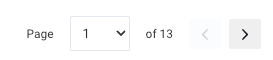 to move to any of the pages in the query list table.
Query list columns
Description
Compare
Checkboxes are provided in this column to choose two jobs for comparison. Refer to Comparing Snowflake Queries for more details.
Query ID
The query ID is listed. You can click the link of a query ID to view the job details page for that query.
SQL
The SQL text is listed.
Status
The status of the query is listed.
Insights
The number of insights for the specific query ID is displayed. Click the query ID .
Estimated Cost
The estimated cost for the specific query is listed along with the credits.
user
The users who run the query are listed.
Warehouse Name
The name of the warehouse which belongs to the specific query is listed.
Started
The start date and time of the query is listed.
End time
The query end time is listed.
Duration
The duration for which a query has run is listed.
Same signature queries
Click the Same signature query link to view a list of queries having the same signature as the selected query.
Comparing Snowflake Queries
Use the compare jobs feature within the queries section to ensure the smooth execution of your queries while meeting SLAs. For instance, if you get an alert informing you that one of your query is taking longer to complete, you can compare the query with another query to figure out the underlying issue and resolve it. In such cases, you can compare the current run with a previous one with a typical duration.
Note
At a time, you can compare only two jobs, the current one with another.
To compare Snowflake Queries, do the following:
On the Unravel UI, click Queries
Select any two queries from the queries table and click the Compare Queries > Compare button on the lower right.
Note
The Compare Queries page displays the differences because the Show differences toggle is turned on by default. You can turn off the Show differences toggle to check all the query details other than the differences.
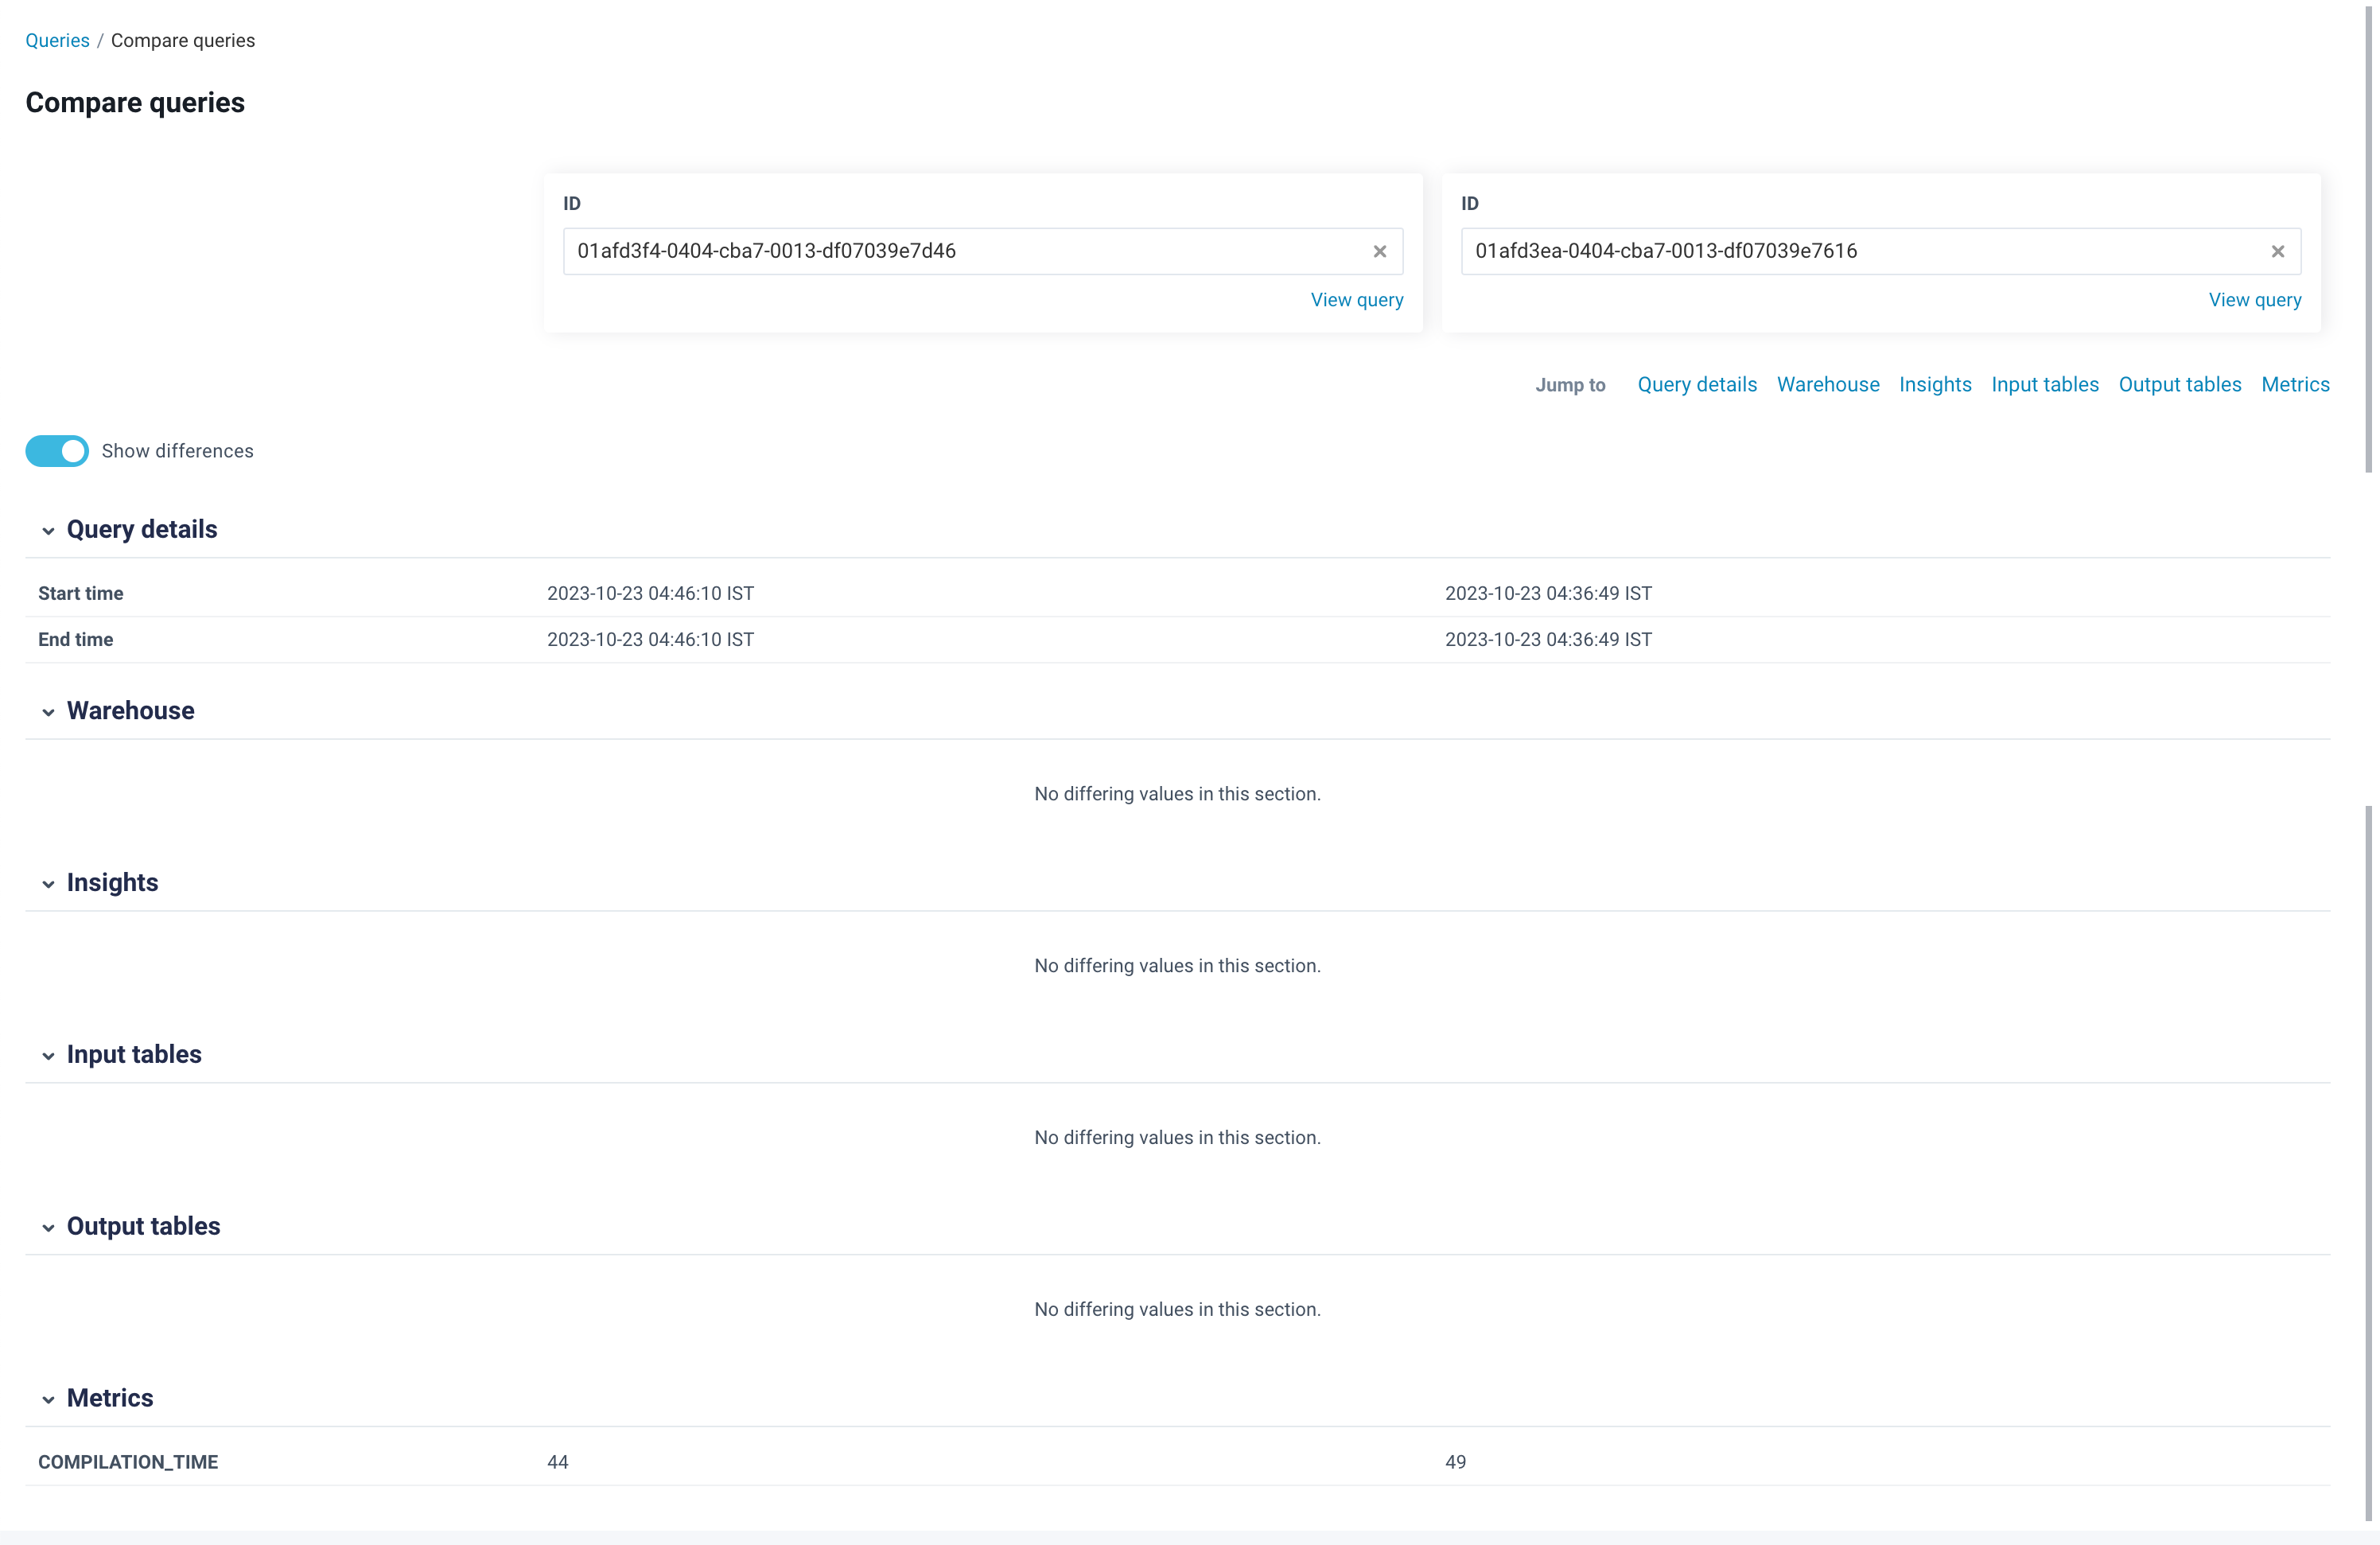
You can compare the following aspects of the jobs:
Query details
Warehouse
Insights
Input tables
Output tables
Metrics
Tip
Click the View Query link to view the query details page of that specific query.
Click any links in the upper right section to jump to that specific section and view the comparison details.
Use the Show differences toggle to showcase only the differences between the two jobs or to view all the details.