Queries Detail Page
From the Snowflake Queries details page, you can get the processing details of all the queries running in your Snowflake Queries. Other than viewing the query details, you can:
Viewing the Query details page
When you open a Snowflake Queries details page, the following details are displayed in the upper section of the page:
Item | Description |
|---|---|
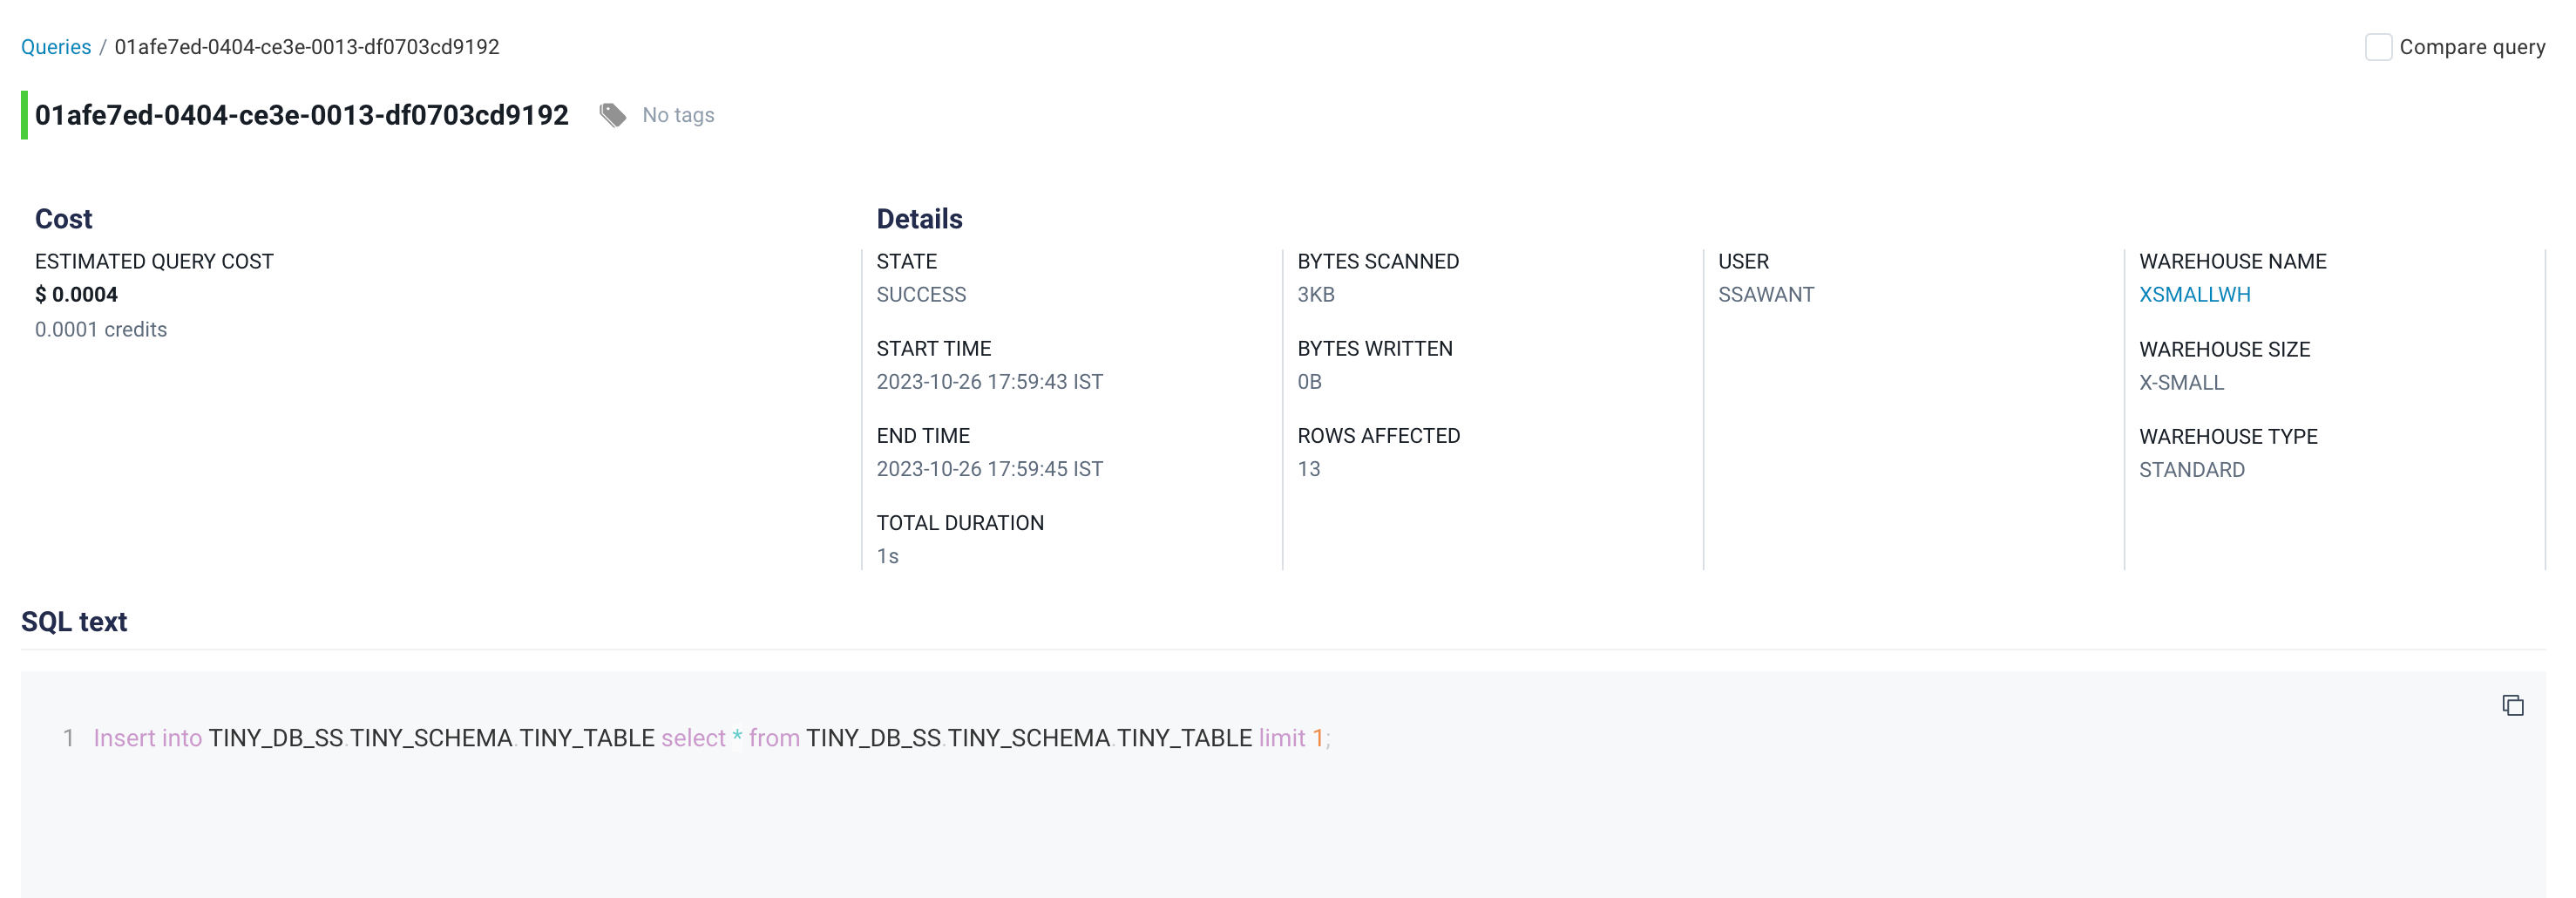
Query ID | The query ID of the query. |
Cost | Estimated cost is calculated by unravel based on duration of execution with percentage of resource used from warehouse. |
State | Displays the status (Success, Failed, or Running) of the job. |
Start Time | Start time of the query. |
End Time | End time of the query. |
Total Duration | Total duration of the query. |
Bytes Scanned | Total volume of data scanned during the execution of the query. |
Bytes Written | Total volume of data written or transferred during the execution of the query. |
Rows Affected | The number of rows or records that were impacted or modified as a result of the query's execution. |
User | The user who initiated or executed the query. |
Warehouse Name | The specific Snowflake warehouse used for executing the query |
Warehouse Size | The size of the warehouse (for example, large, small, medium, etc). |
Warehouse Type | The type of Warehouses (for example, standard, multi-cluster, etc). |
Do the following to compare jobs from the job details page:
From the Unravel UI > Queries page, click the link of a job from the list and go to the query details page.
Select the Compare Queries check box located on the upper right corner of the queries details page and then click Compare. The Compare jobs page is displayed.
Specify the query ID of the query with which you want to compare in the ID box. You can copy the query ID from the query list. The details of both queries are displayed side by side for comparison.
Viewing Snowflake Queries insights
The Unravel intelligence engine examines the queries and generates insights. This analysis highlights areas where your query's efficiency can be enhanced.
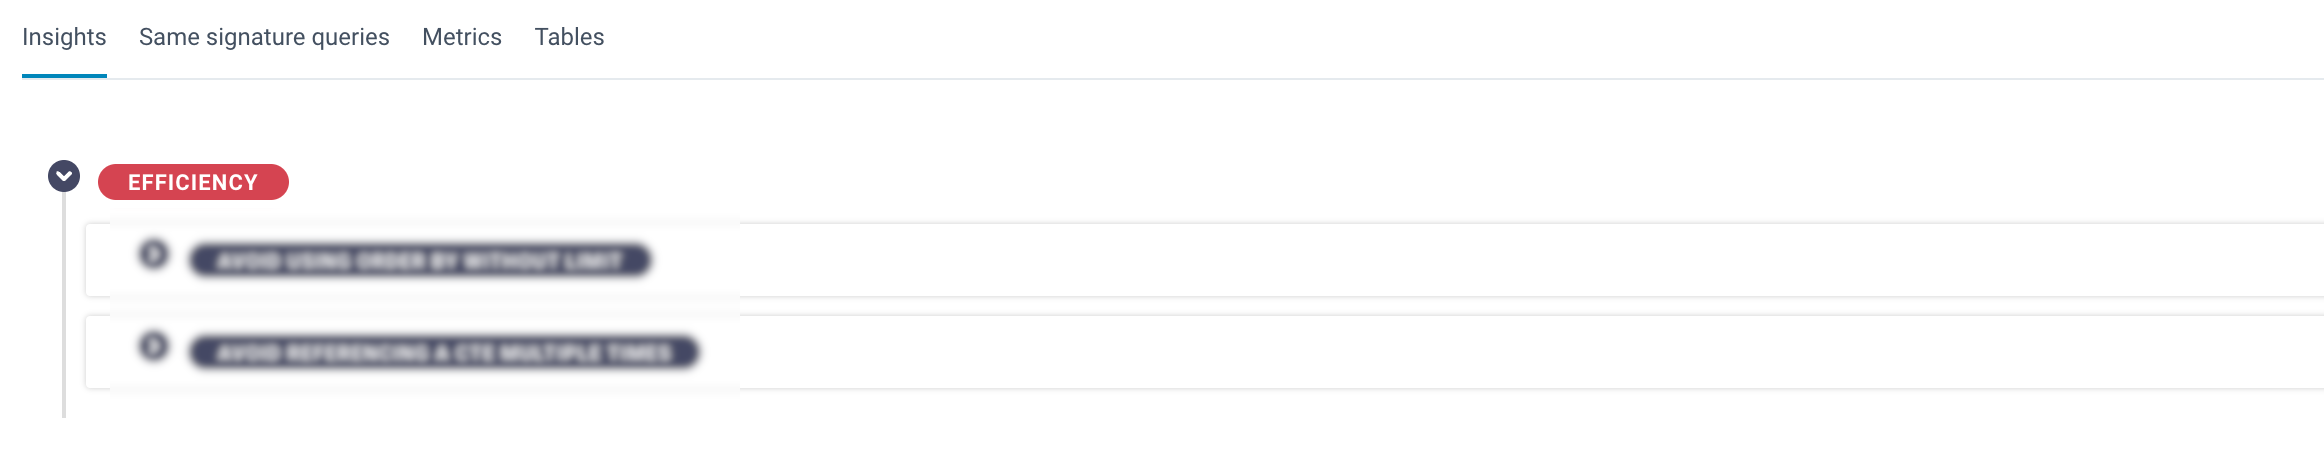
Efficiency insights provided for Snowflake Queries can fall into the following categories:
Anti-patterns to pinpoint problematic pattern in the query .
Performance to optimize query performance.
Join inefficiency to indicate issues in the performance of query joins.
Projection inefficiency to enhance query execution efficiency.
These can be expanded for more specific recommendations, which you must address for improved resource utilization and efficient processing.
Examining and comparing the same signature queries
Queries that use the same signature queries as the current query are listed in the Same Signature Queries tab.
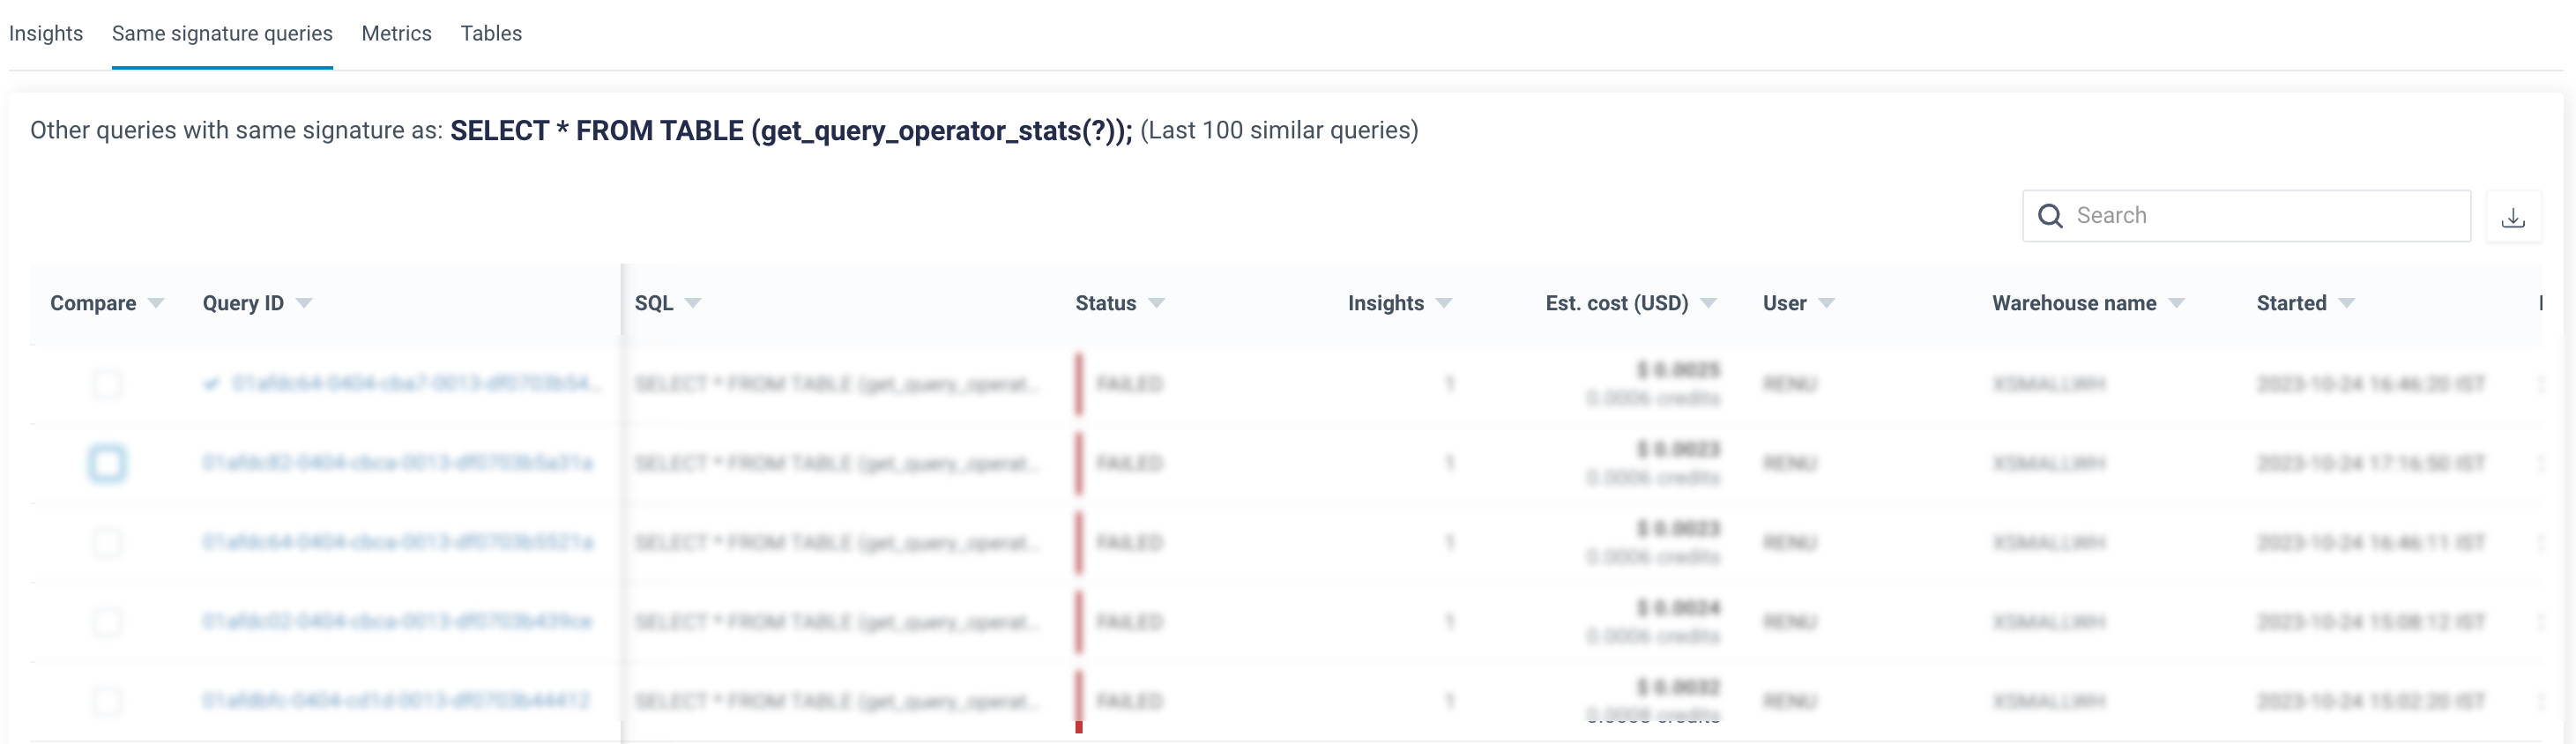
You can compare your current query with another query that shares the same signature to identify any differences that may have caused an inefficiency. To learn how to compare Snowflake queries, refer to Comparing Snowflake Queries.
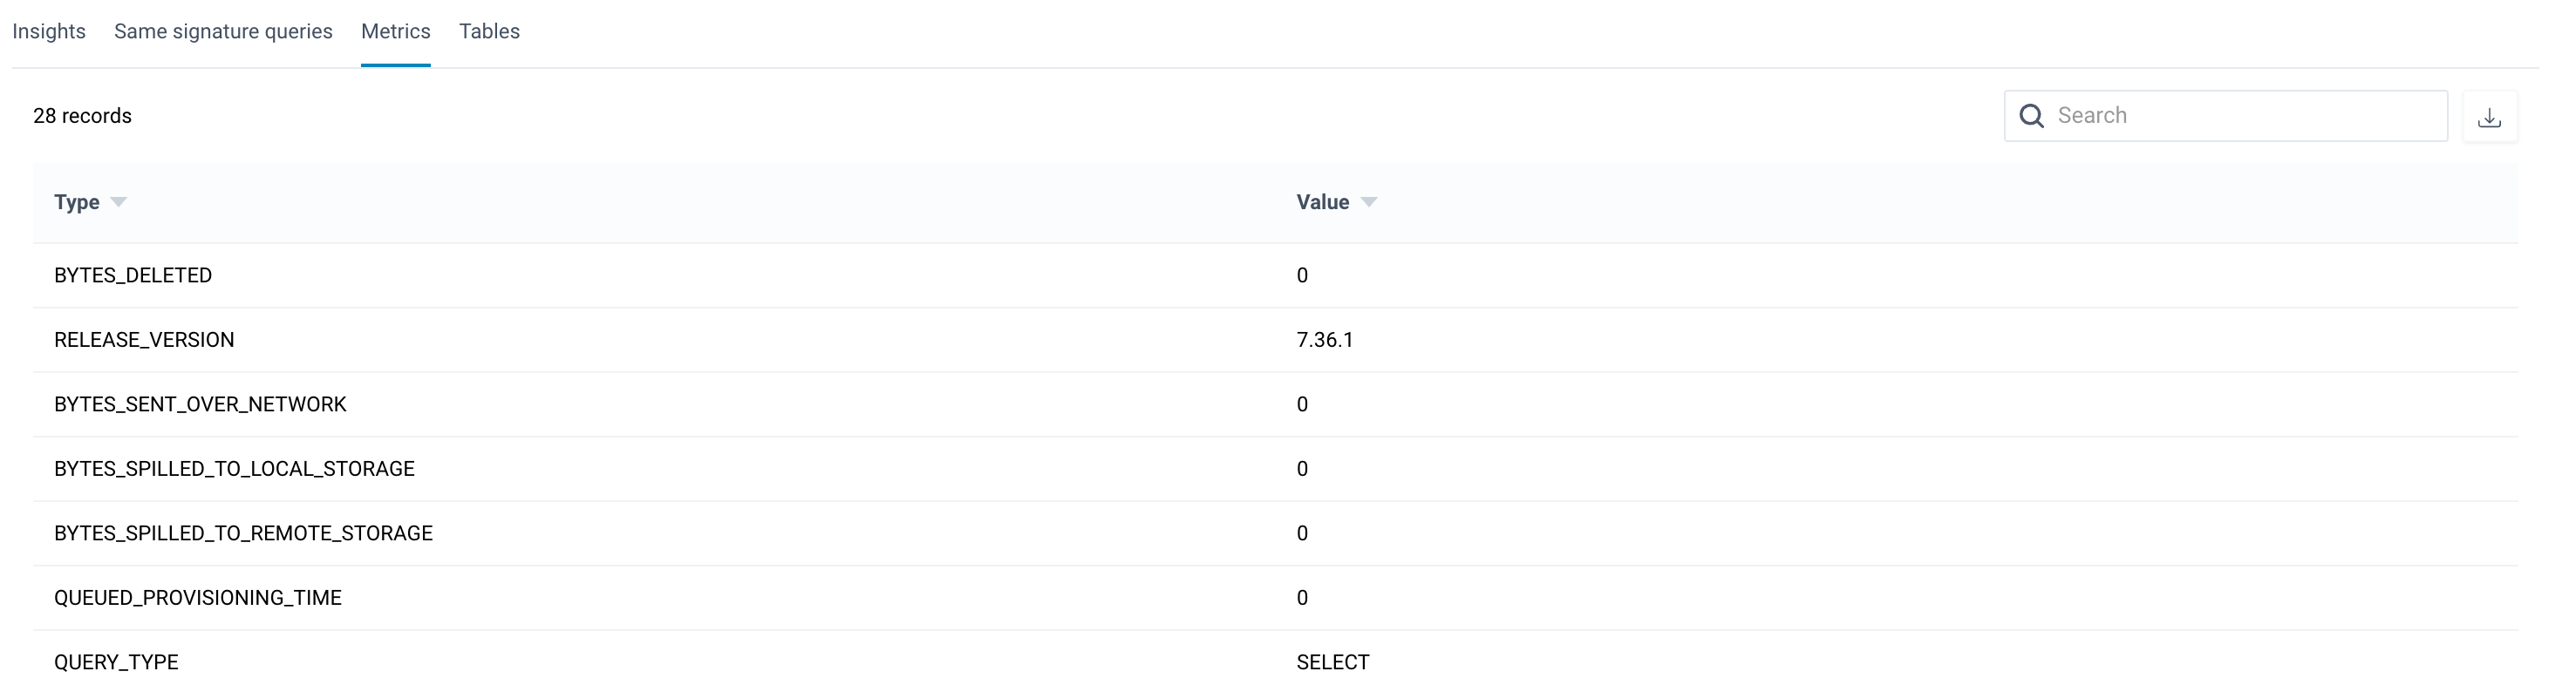
Checking metrics associated with a query
From the Metrics tab on the Query details page, you can view all the metrics associated with a query and their respective values.
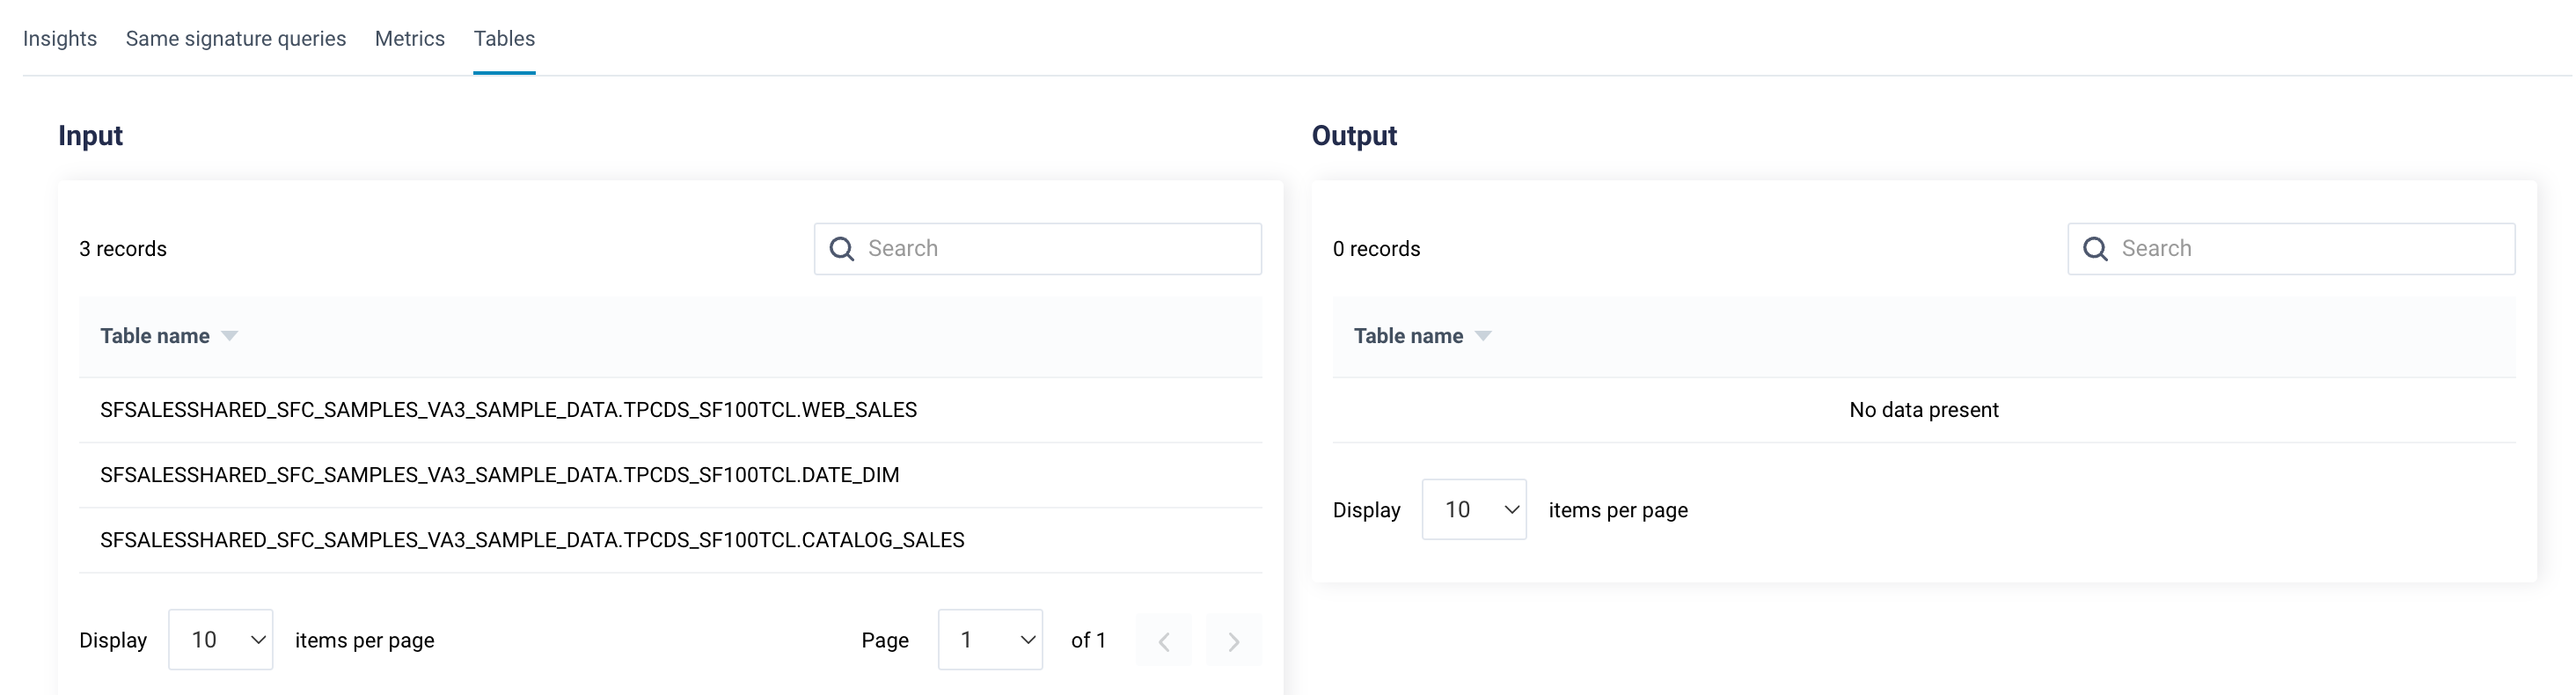
Viewing table sources of a Snowflake query
In the Table tab, you can access and examine the inputs and output tables that are part of the query.