Compute Costs (Snowflake)
The Compute Costs breakdown and trends clearly show where your compute expenses are allocated, providing insights into three key components: virtual warehouse compute, cloud services, and serverless features. By tracking and analyzing these compute costs, you can understand your resource utilization comprehensively, enabling you to make informed decisions and optimize your operations for efficiency and cost-effectiveness.
From the Unravel UI, click Cost > Cost 360.
Filter the data using the date range or fields.
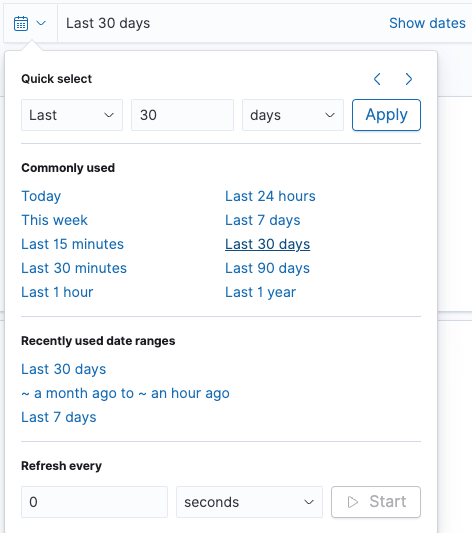
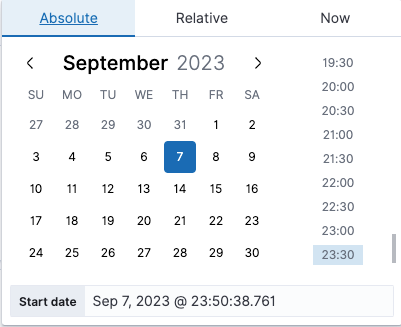
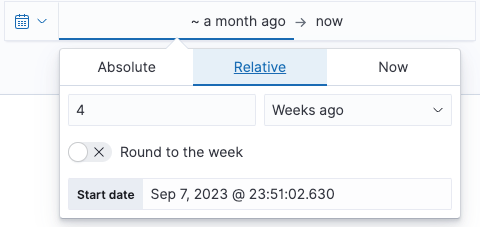
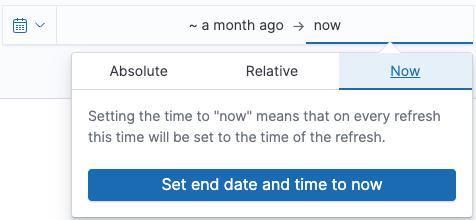
On the top right, you will find the date range filter. You can adjust the range to analyze data for specific periods.
On the top left, you can find a list of fields you can use for filtering. This is an optional step that helps you drill down to specific filters. These filters will be applied for the entire Cost 360 page.
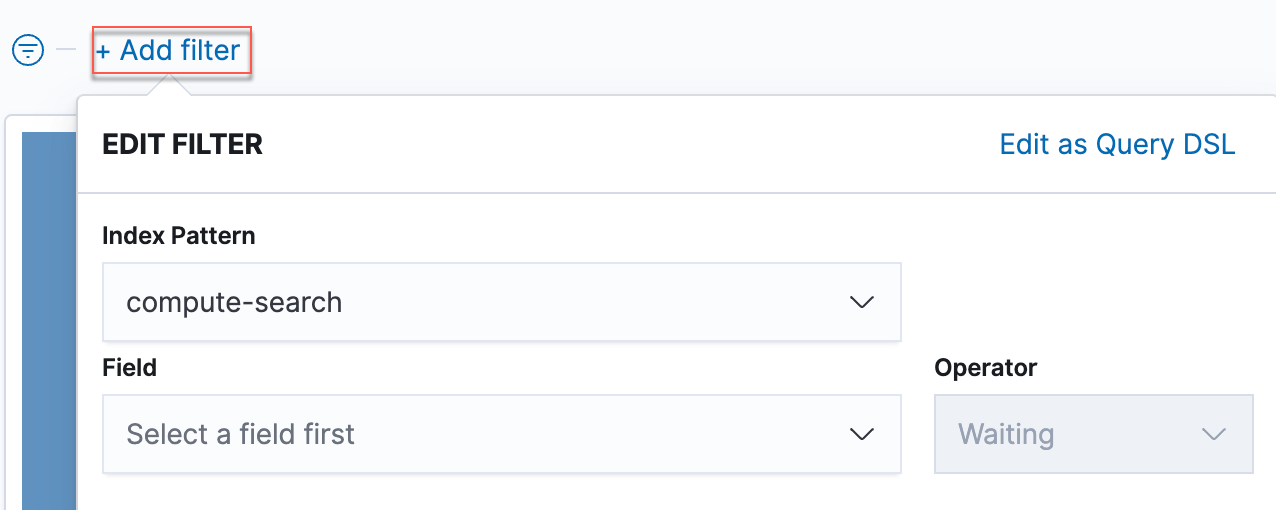
Click Add filter and choose an Index Pattern, Field, and Operator to filter for the required values. You can also create a Custom Label or search using Query DSL also.
To reset the filter, click the cross button next to the applied filter and remove the filter as shown here:

Scroll down to view a detailed breakdown of the Compute Cost trend for the selected time period. The default value is 30 days.
Compute Costs
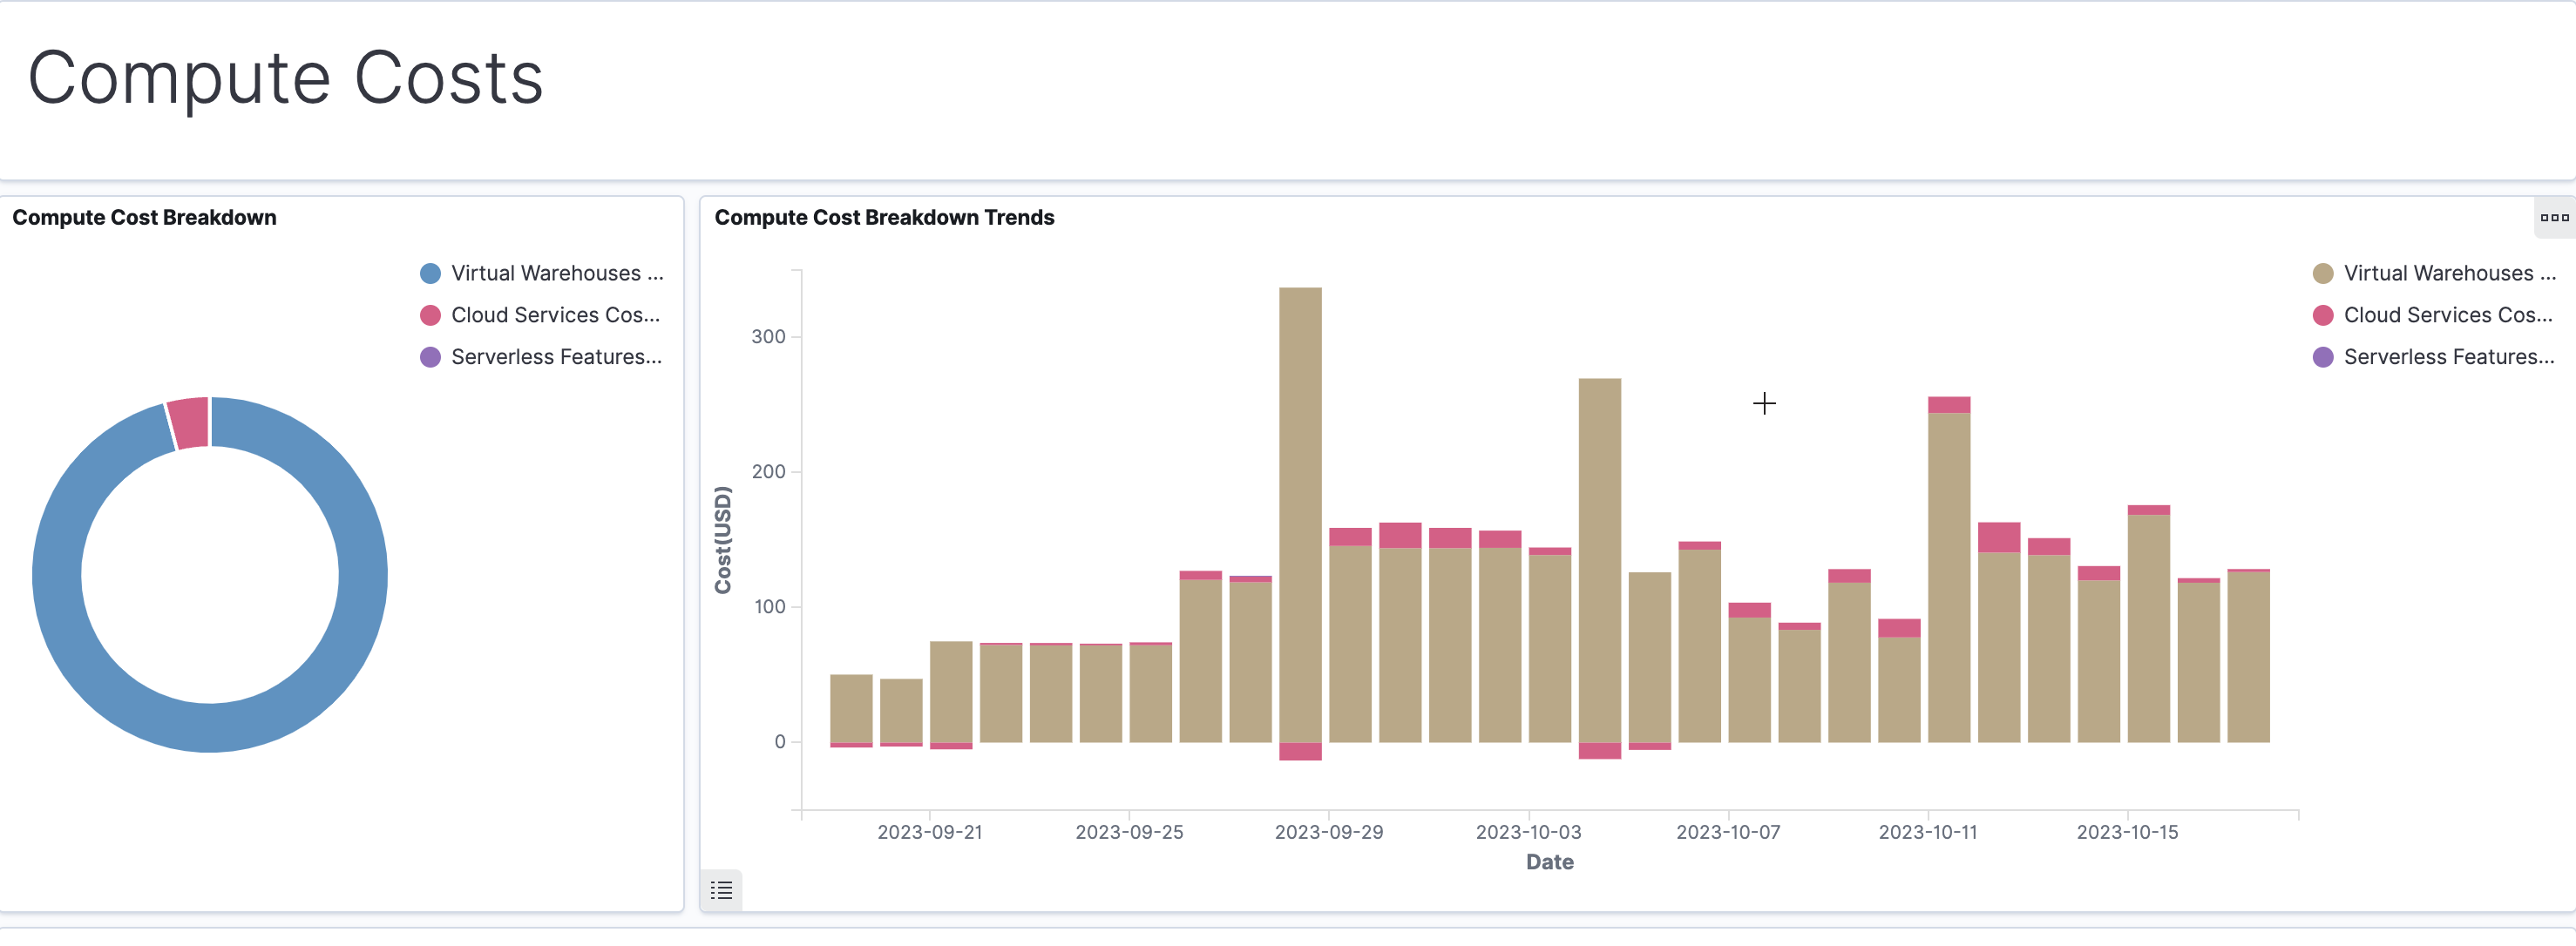
You can filter the Compute Costs section for three types of costs:
Virtual warehouse compute cost
Cloud services cost
Serverless cost