Cascading and Pig APM
The only difference between these two APM's is the job type name; otherwise they are the same. This example uses the Pig APM.
By default, the window opens displaying the Navigation and Task Attempts.
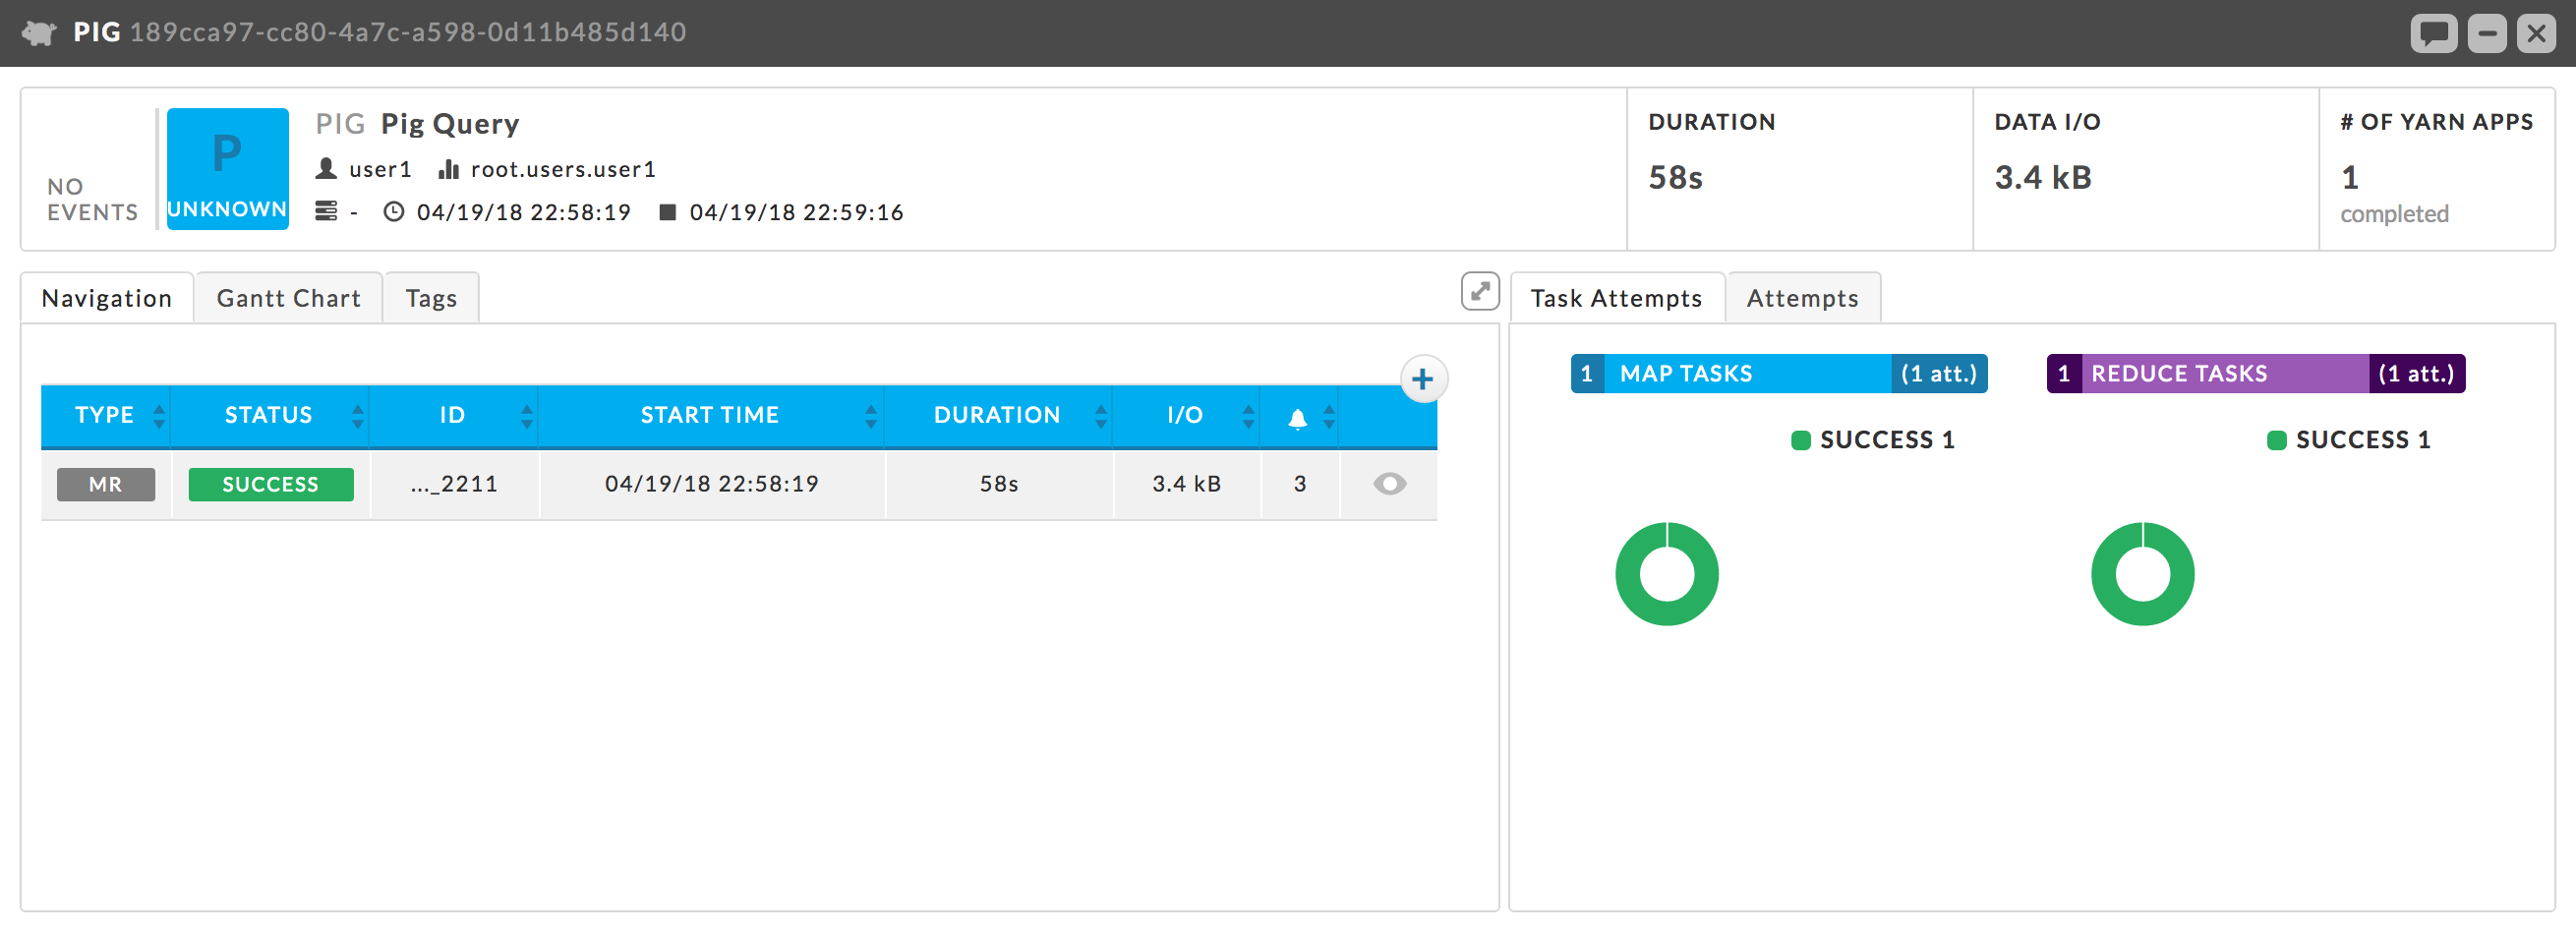
Key performance indicators
Events: The number, if any, of Unravel insights for this query.
Duration: Total time taken by the query.
Data I/O: Total data read and written by the query.
Number of YARN Apps: The number of apps that make up the workflow.
Left tabs
Gantt Chart: Exceptions, errors, and warnings associated with this app.
Reusing topic #UUID-30559ede-3b59-31c6-1b76-c72d6f36ecb2
Right tabs
Task Attempts: Displays map and reduce task attempts by success, failed, and killed status. The data displayed is for the entire Hive job. To see the details for a specific MapReduce task click the job in the Navigation tab. The Pig APM above shows the Task Attempts.
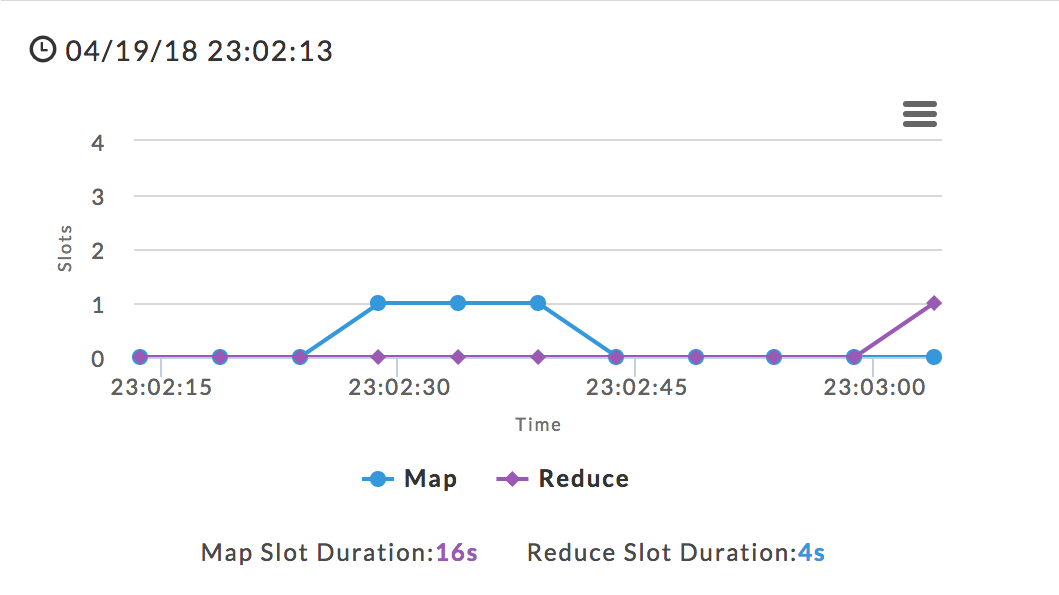
Attempts: Graphs the map and reduce task slot usage over the duration of the job. The wall clock time is noted in the upper left-hand corner. The computer slot usage is shown in this graph.