Kafka detecting lagging or stalled partitions
Overview
The Unravel Intelligence engine provides insights into a cluster's activities through the status of the Consumer Group's (CG). A CG's state is determined on a partition by partition basis, specifically by its commit offset relative to the producer's log commit offset for a particular partition. The states are:
OK: commit offset is in pace with the log end offset.
Lagging: the Consumer is lagging behind the Producer. Both the consumer's and log commit offsets are increasing, but the Producer’s is increasing faster. When graphed over time, the Producer's slope is increasing faster than the consumer's slope.
Stalled: the Consumer has essentially stopped while the Producer is still active. The consumer's offset isn't increasing while the log commit offset is increasing. Graphically, the slope of the consumer is essentially zero.
A Topic's status is set to the lowest status among its Consumer Groups and a Consumer Group's status is set to the lowest status among its partitions. You must drill down from the Cluster in order to determine where Topic/Consumer Group is lagging or stalled.
Use case example
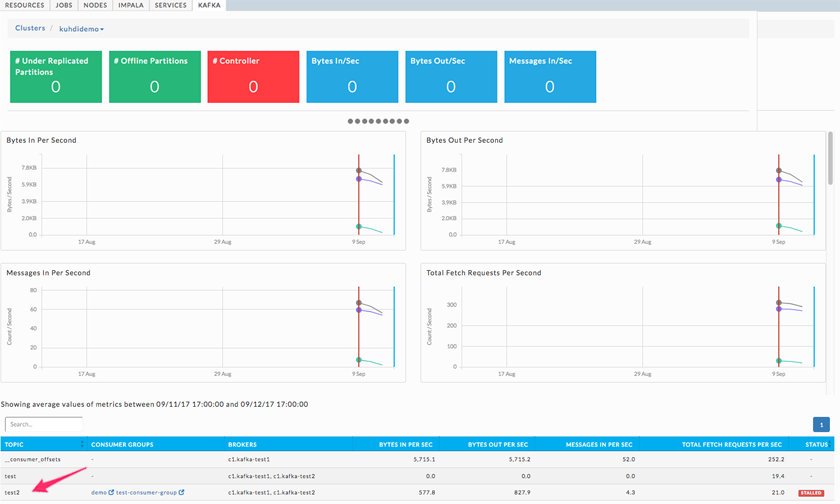
Go to Operations > Kafka to view your currently configured clusters. Click a cluster name to bring up the Cluster View.
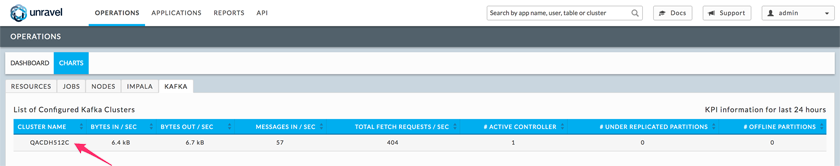
Use the graph scroll-bar to view graphs of the cluster metrics. The Topic table lists all topics with their consumers and the topic's status. Click within a graph to see what topics were available at that point in time. Click the topic name to examine it. In this case, topic test2 is stalled and has two consumers, demo and test-consumer-group.
Note
Consumers with the same name are grouped together into one consumer group.
Tip
Choosing all clusters from the pull down menu creates tabs for all your clusters so you can easily switch between them.
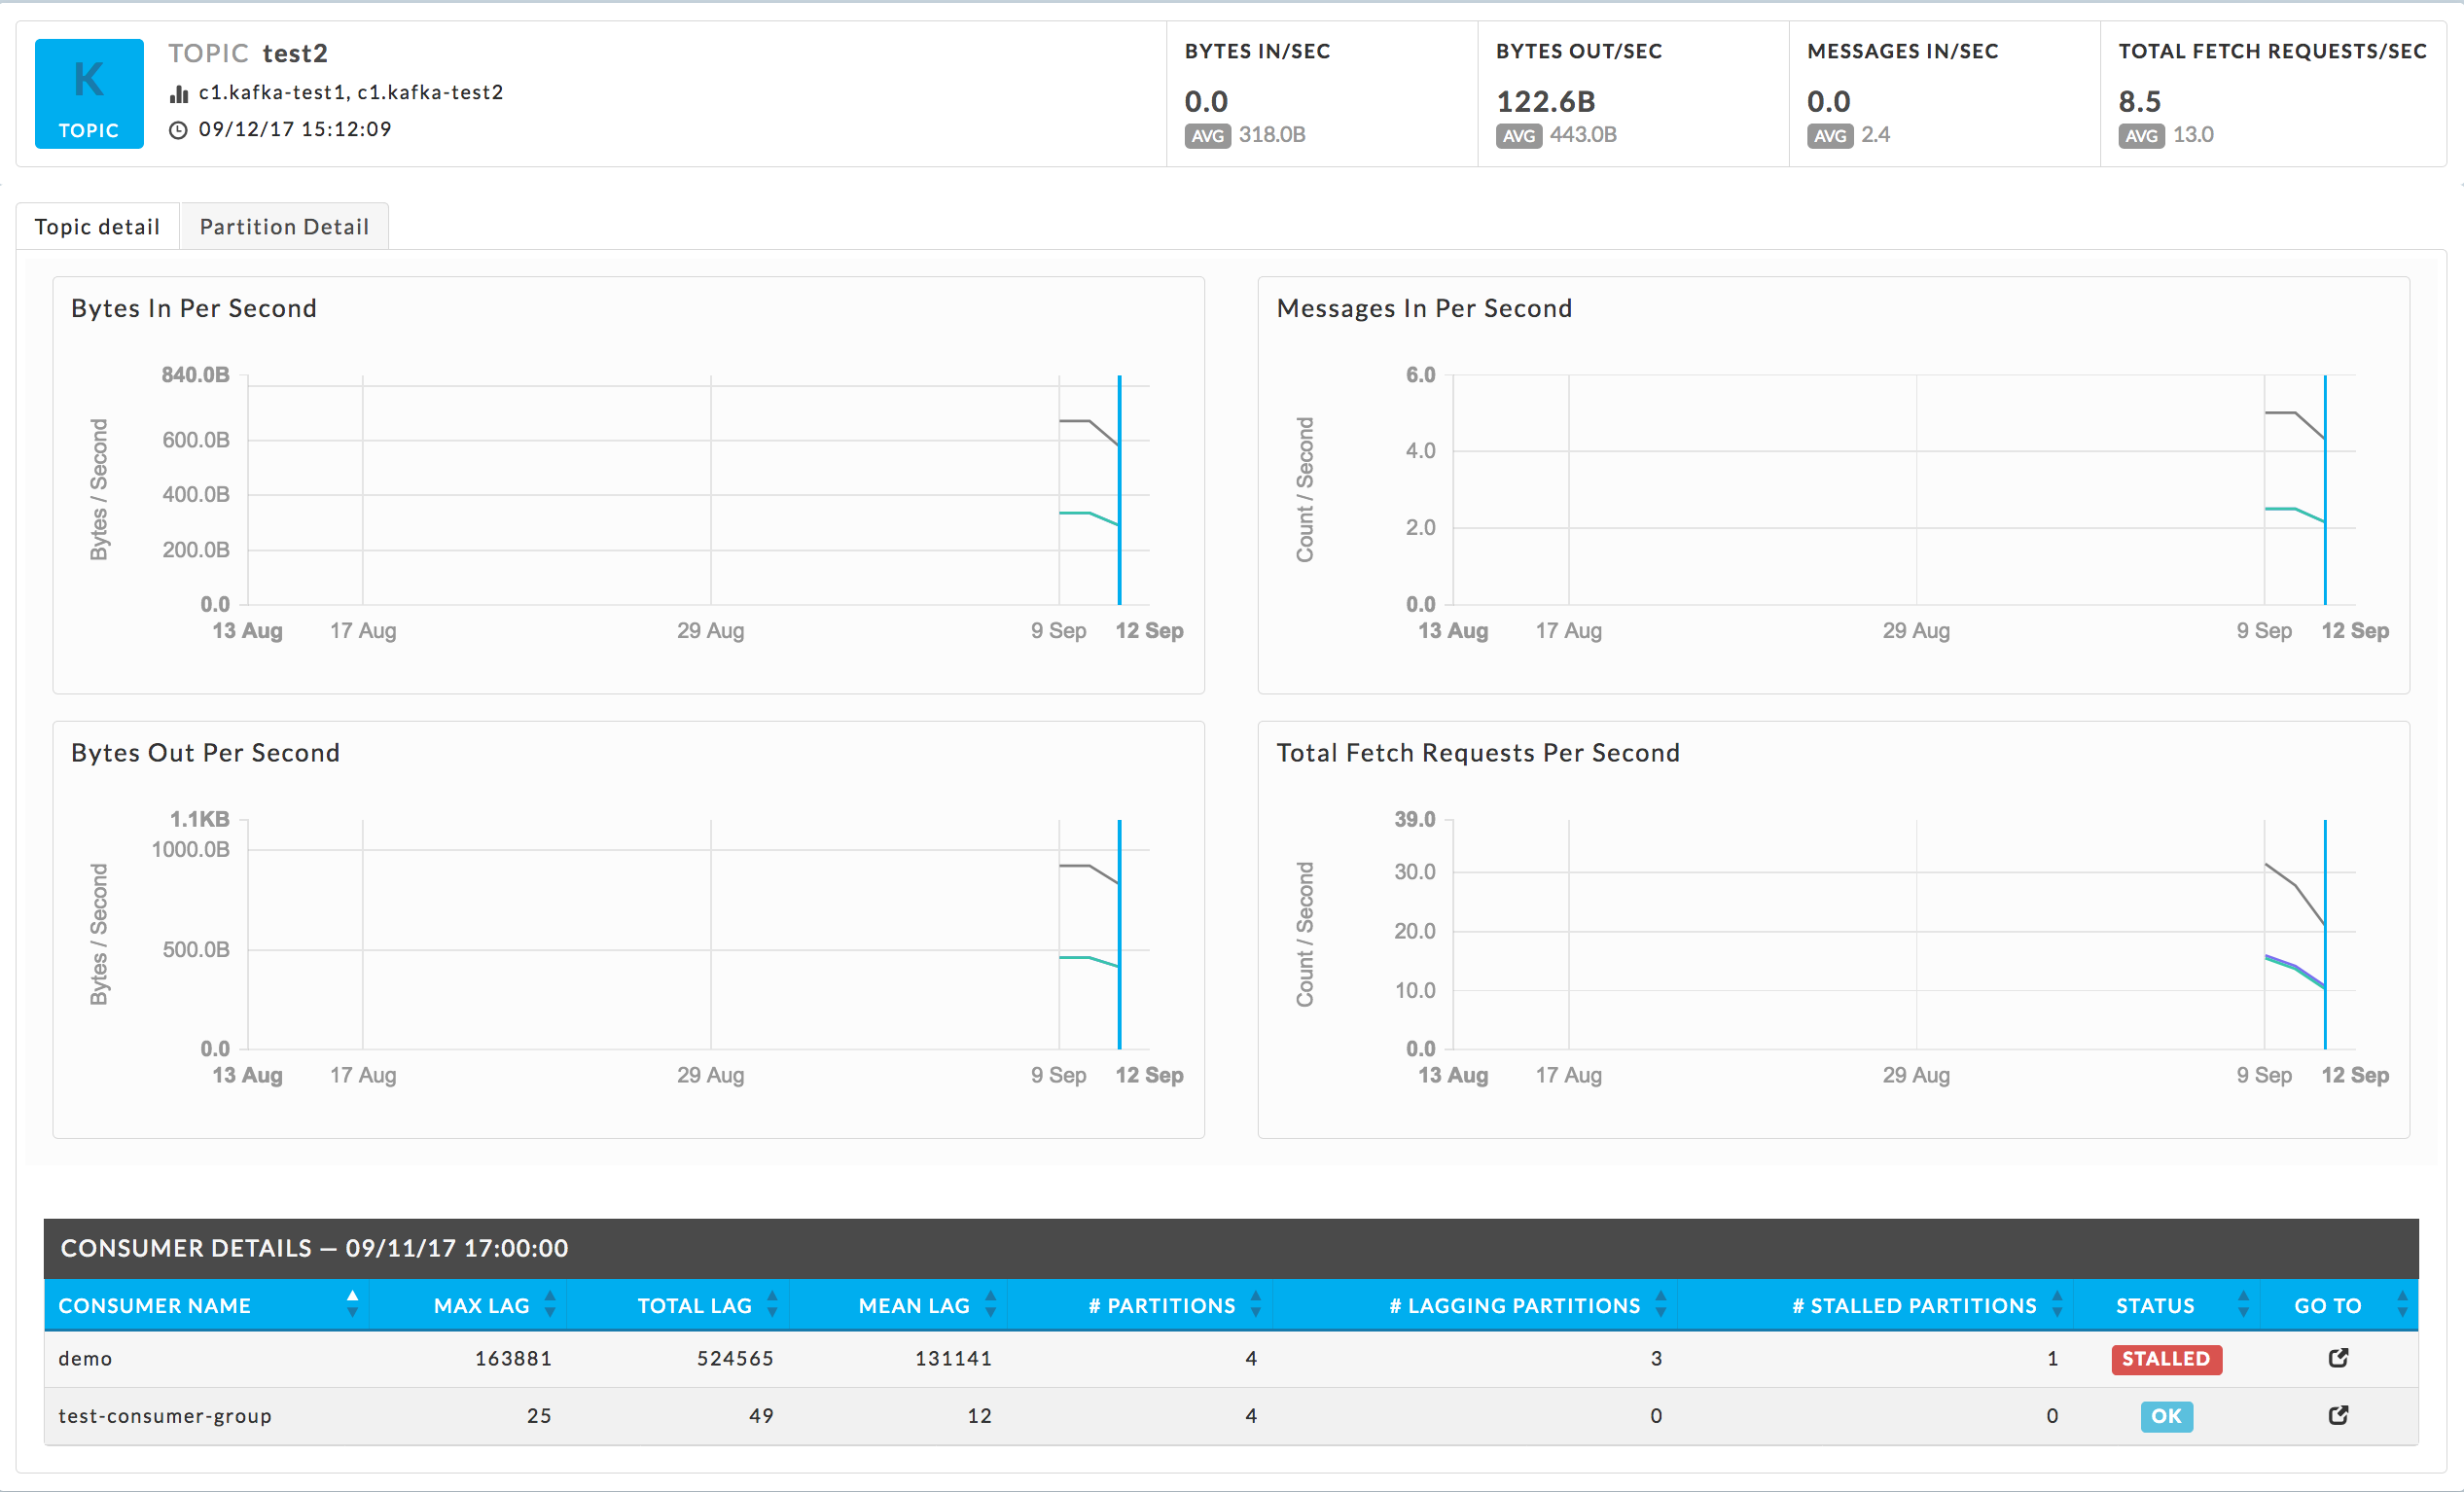
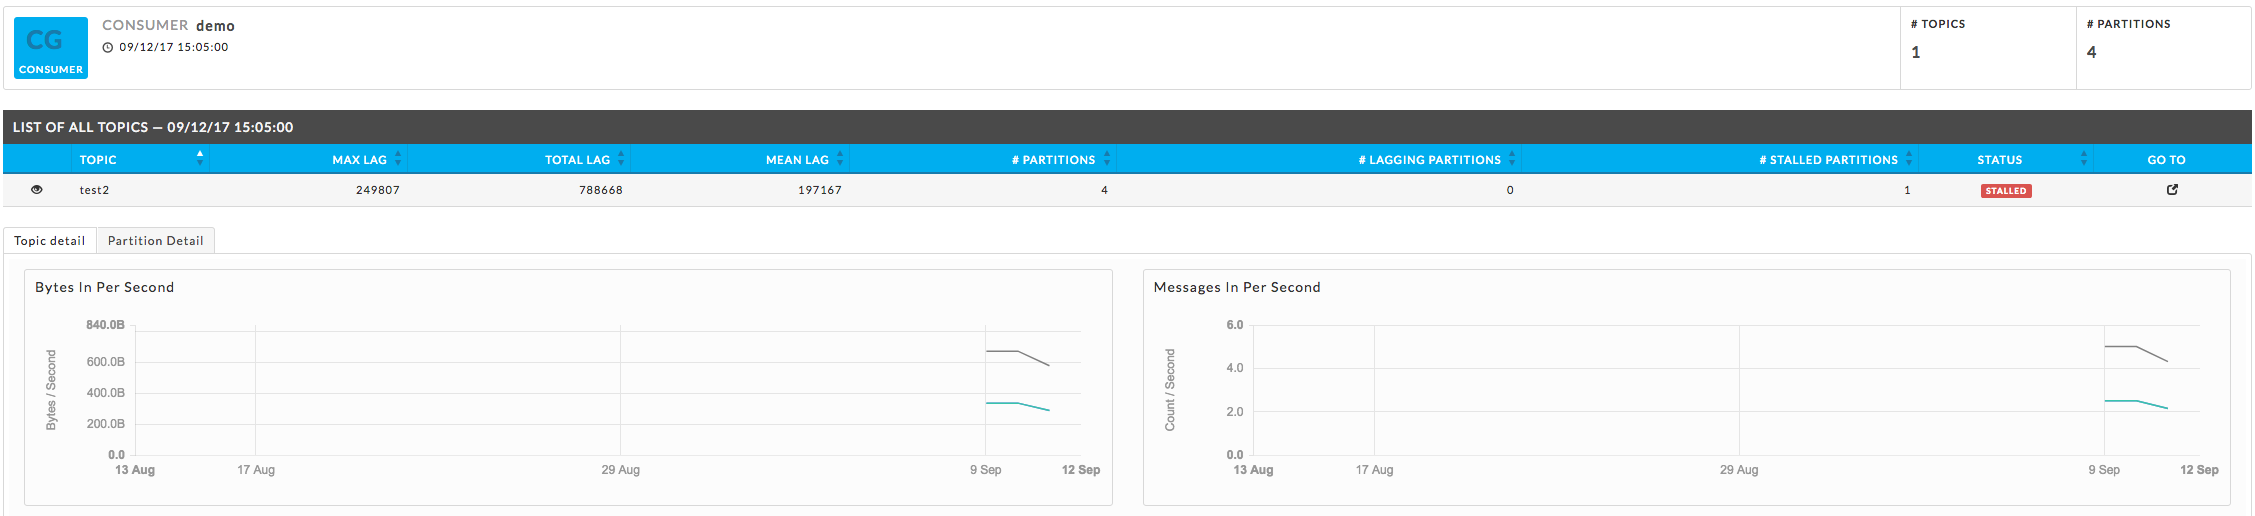
The Topic view opens with Topic Detail tab displaying the brokers KPIs. The Consumer Details table lists active Consumers with its status for that point in time. Its KPIs are across all partitions. Click the graph to see what Consumers were running at that point in time. Here test2 only has one stalled consumer demo; in turn, demo has one stalled and three lagging partitions.
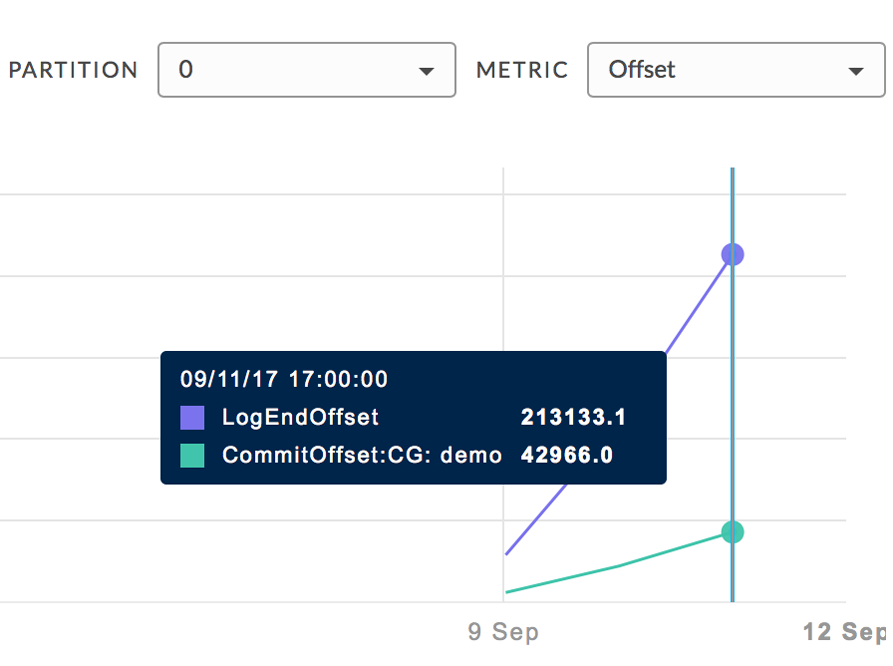
Click the Partition Detail tab to view the Consumer's information per partition. The Consumer Details table now lists the KPIs and status for all consumer groups on the partition displayed. Click within the graph to see what Consumers were running at that point in time on that partition. Partition 0 is initially displayed using the metric offset. As expected from the preceding graph the test-consumer-group is OK on this partition, while demo is lagging.
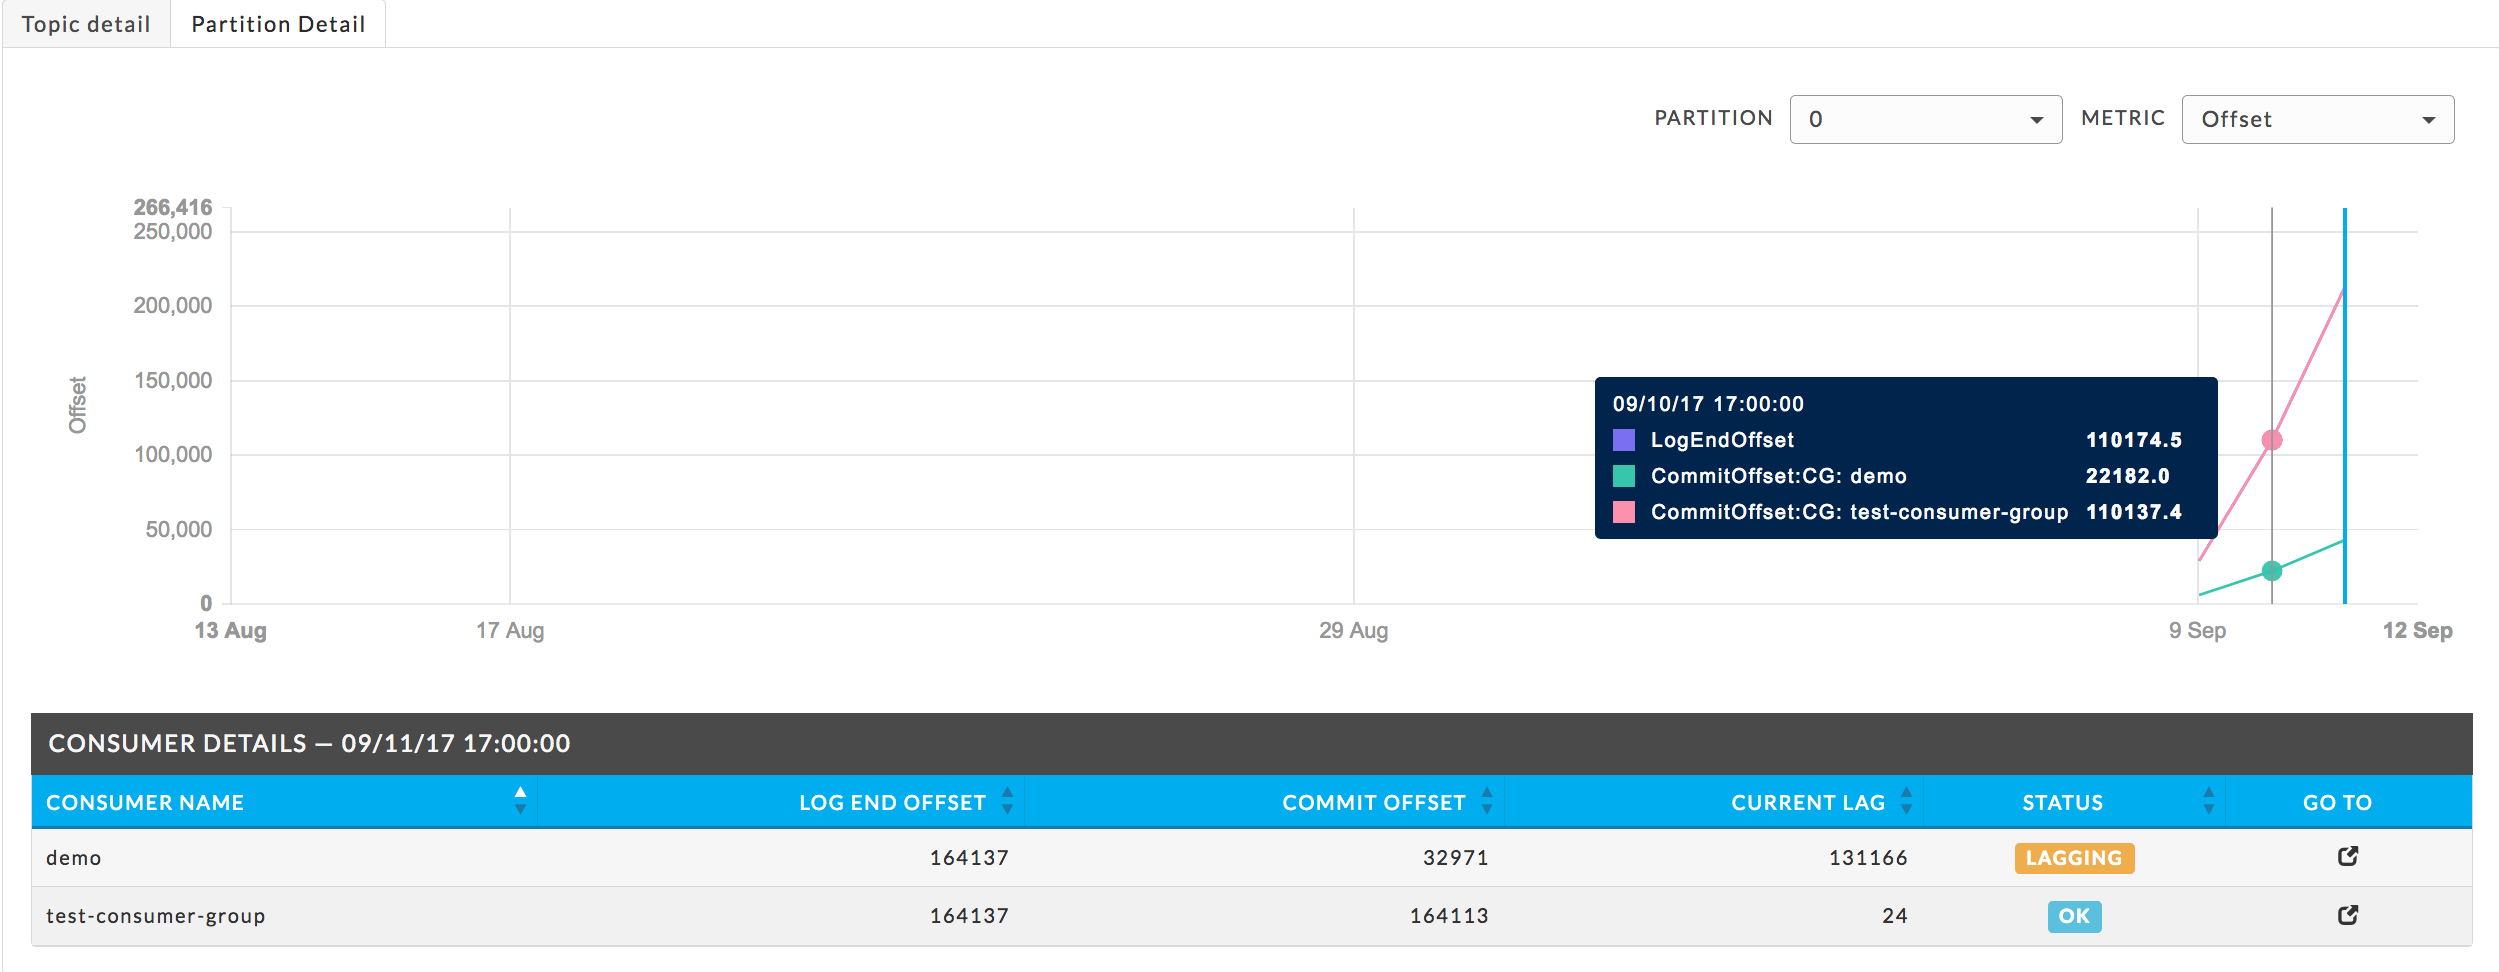
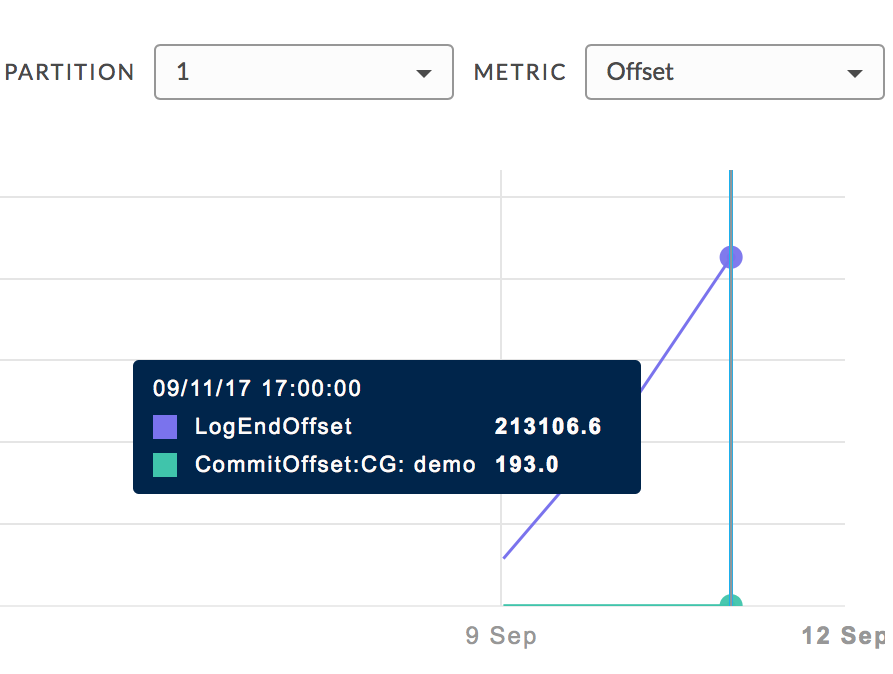
Use the Partition and Metric pull-down menu to change the partition to display and metric (Offset or Consumer Lag) to use. Click more info glyph (
 ) in the Go To column to bring up the Consumer Group View. Here Partition 1 idgraphed on the metric Consumer Lag. It's obvious this is a stalled partition both from the steep slope and the status icon. The test-consumer-group is basically a flat-line.
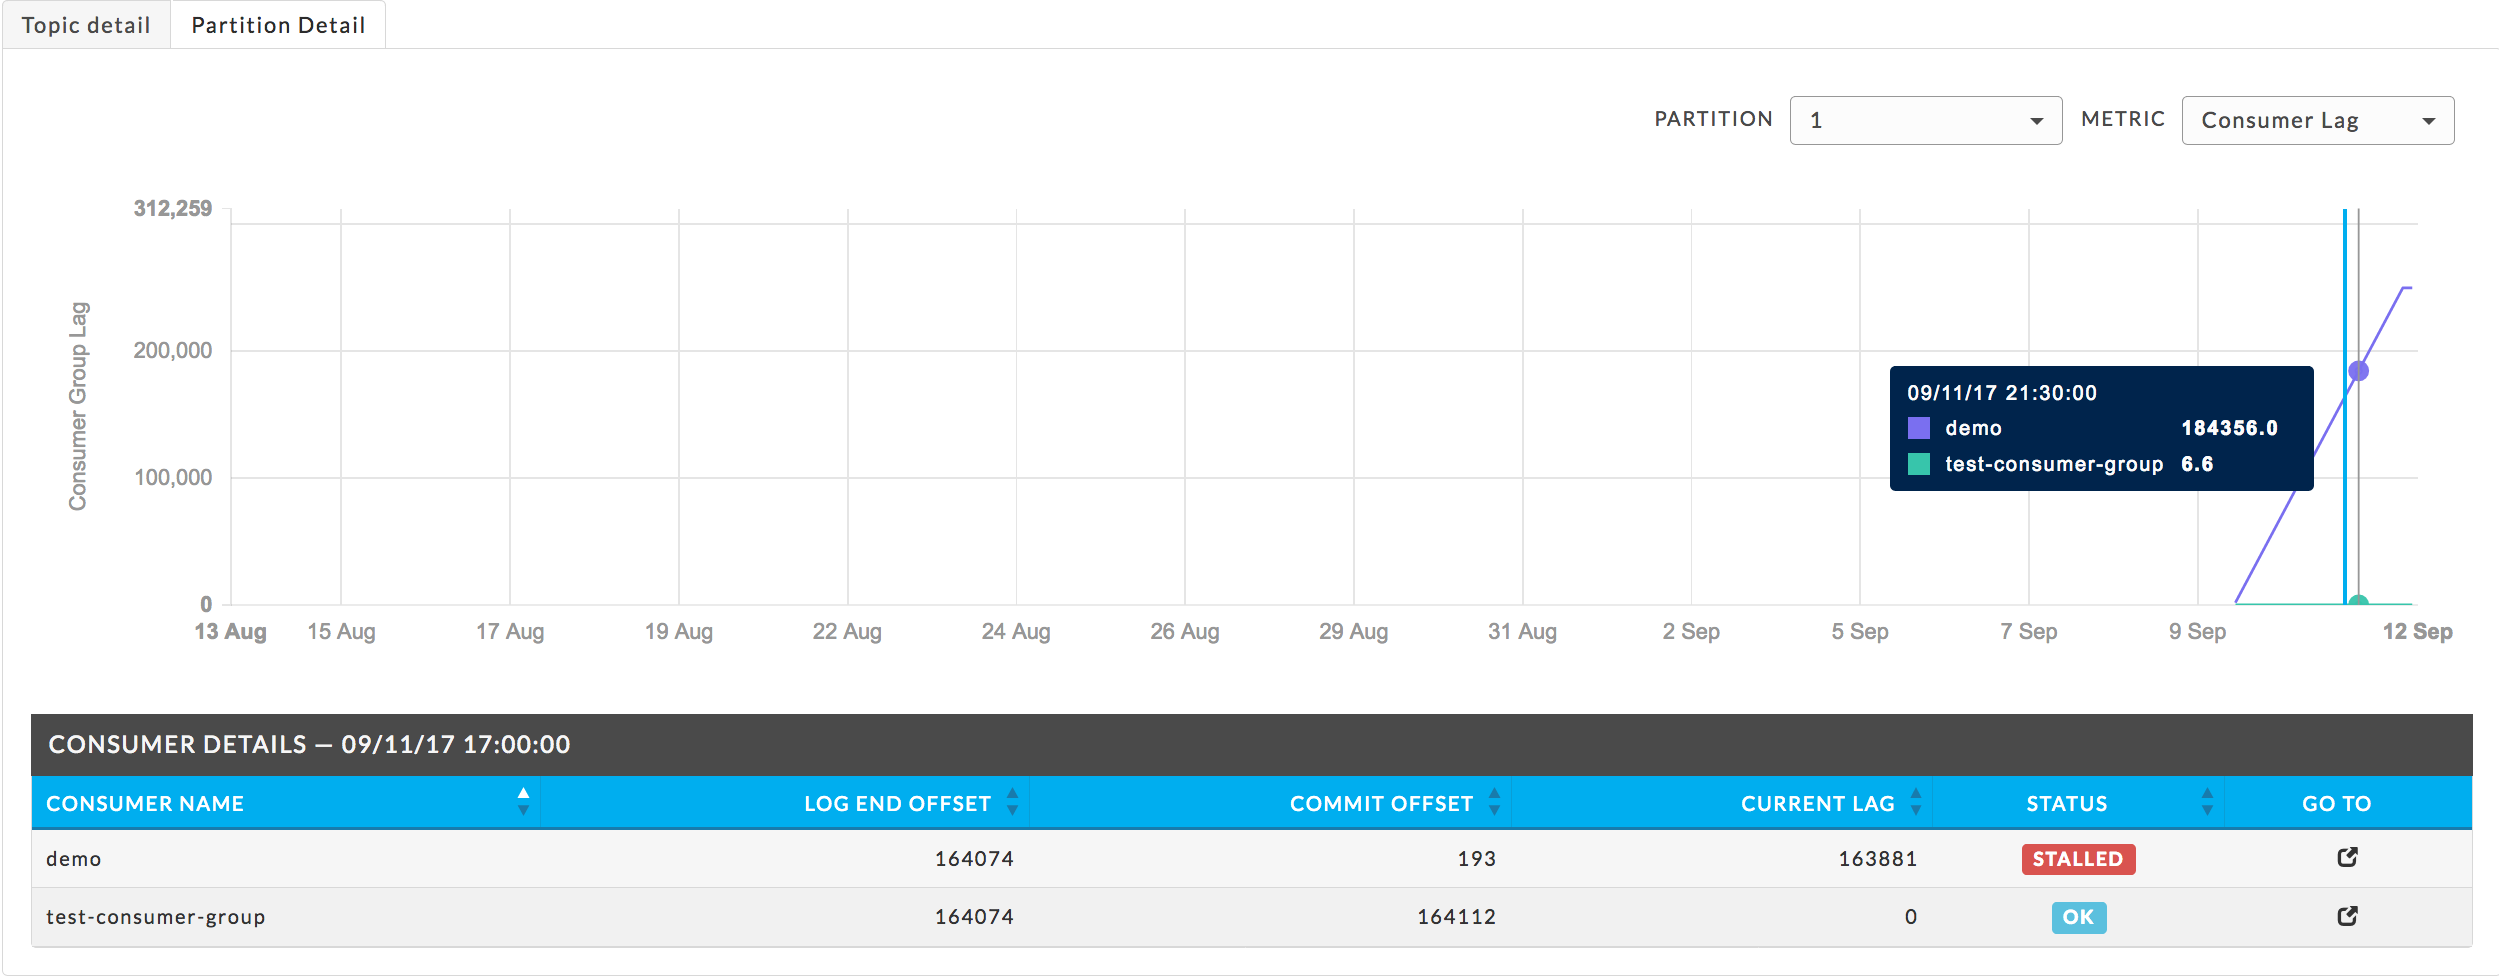
The CG view lists the Topics which it is consuming and opens with graphs of its broker KPIs. Just as a Topic can have multiple consumers with varying states, a Consumer Group can be consuming multiple topics with varying degrees of success. In this case, there is only one Topic being consumed and the CG is stalled.
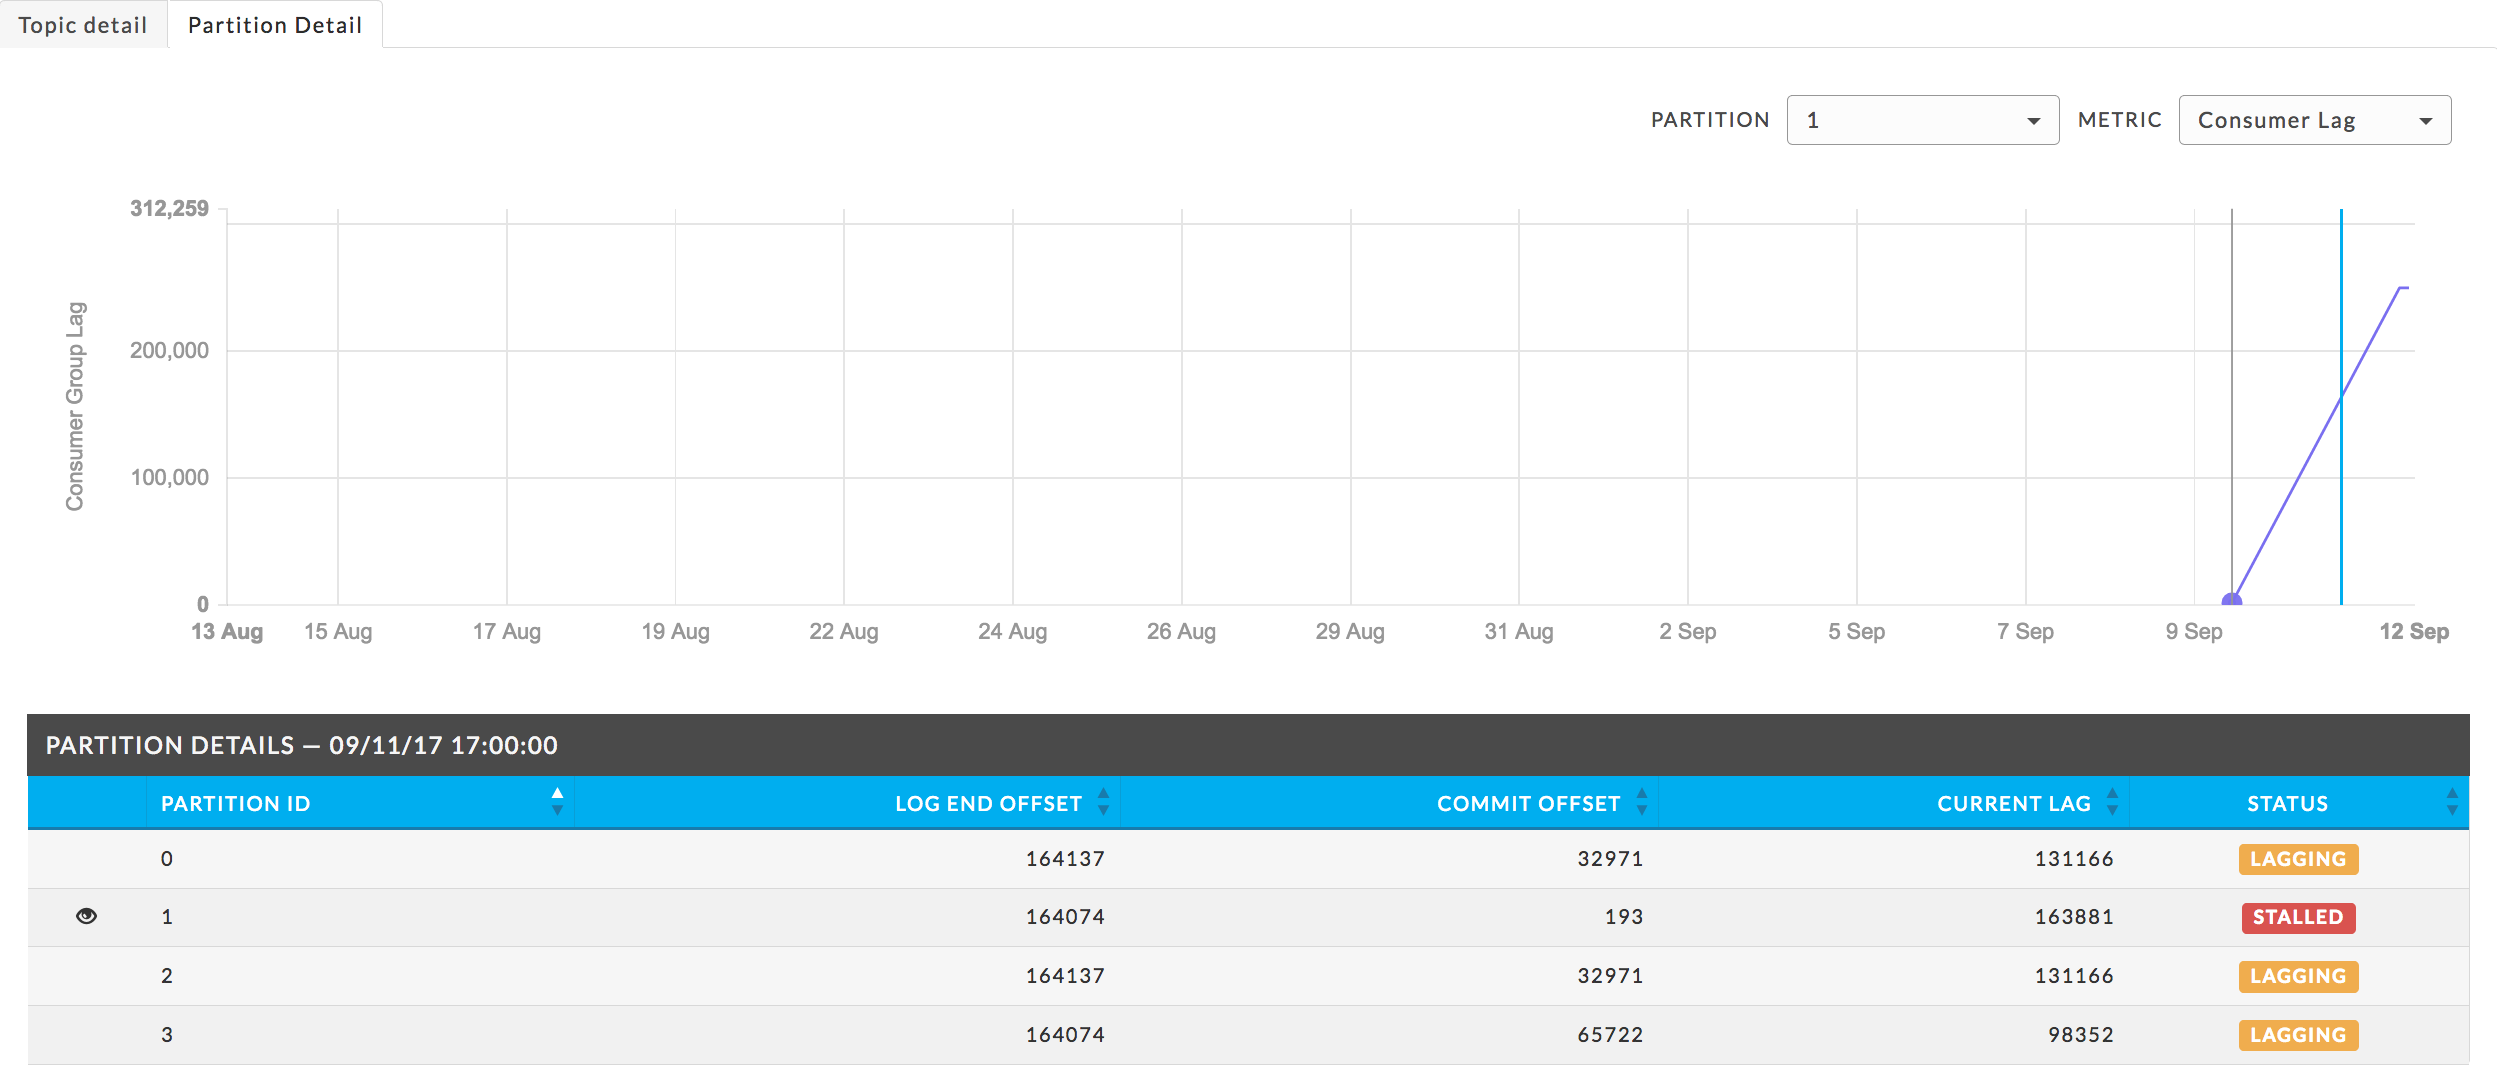
Click the Partition Detail tab to see partition. The Partition Details table lists the partitions with its KPIs and status. The window defaults to the graph of partition 0 using the offset metric. In the following image, we see partition 1 is stalled, while 0, 2, 3 are lagging.
Use the pull-down menus to change Metric or Partition used for the graph. The
 denotes the partition displayed. The graph shows partition 1 graphed using consumer lag.