How to intelligently monitor Kafka/Spark Streaming data pipeline
Identifying issues in distributed apps like a Spark streaming app isn't trivial. Unravel helps you connect the dots across streaming apps to identify bottlenecks.
Spark streaming is widely used in real-time data processing, especially with Apache Kafka. A typical scenario involves a Kafka producer app writing to a Kafka topic. The Spark app then subscribes to the topic and consumes records. The records might be further processed downstream using operations like map and foreachRDD ops or saved into a datastore.
The following two scenarios illustrate how you can use Unravel’s APMs to inspect, understand, correlate, and finally debug issues around a Spark streaming app consuming a Kafka topic. They demonstrate how Unravel's APMs can help you perform an end-to-end analysis of the data pipelines and its apps. In turn, this wealth of information helps you effectively and efficiently debug and resolve issues that otherwise would require more time and effort.
Producer failing scenario
Consider a running Spark app that hasn't processed any data for a significant amount of time. The app's previous iterations successfully processed data and you know for a certainty that current iteration should be processing data.
When you notice the Spark app has been running without processing any data, you want to check the app's I/O.
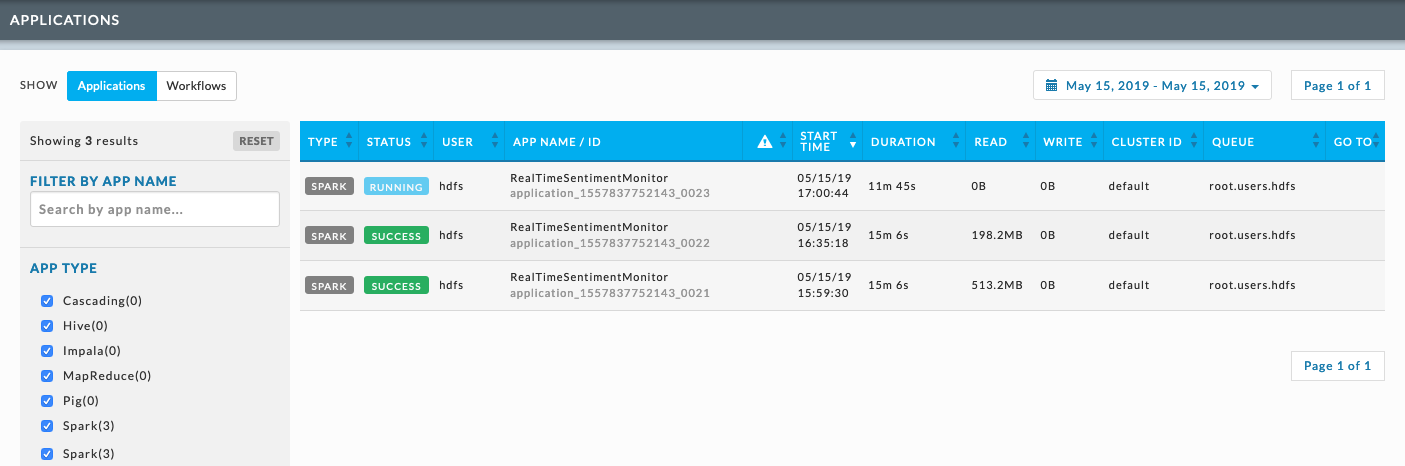
Click it to bring up the app and see its I/O KPI.
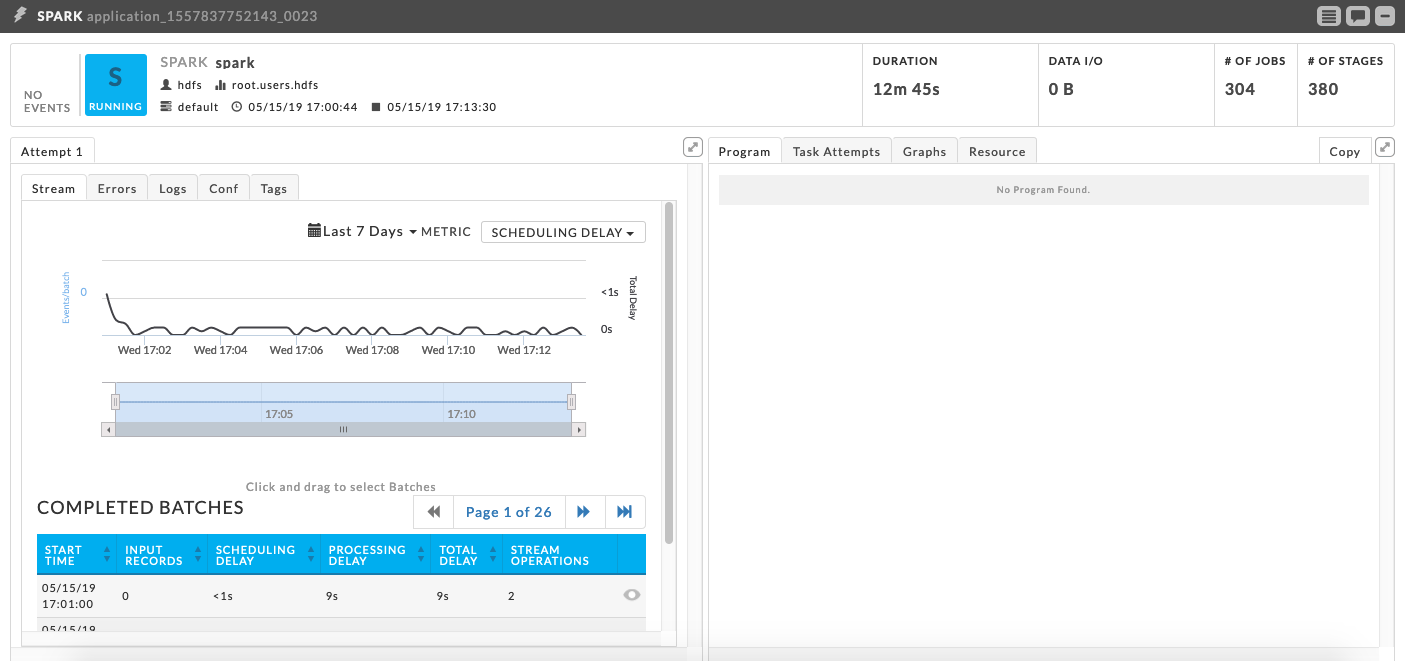
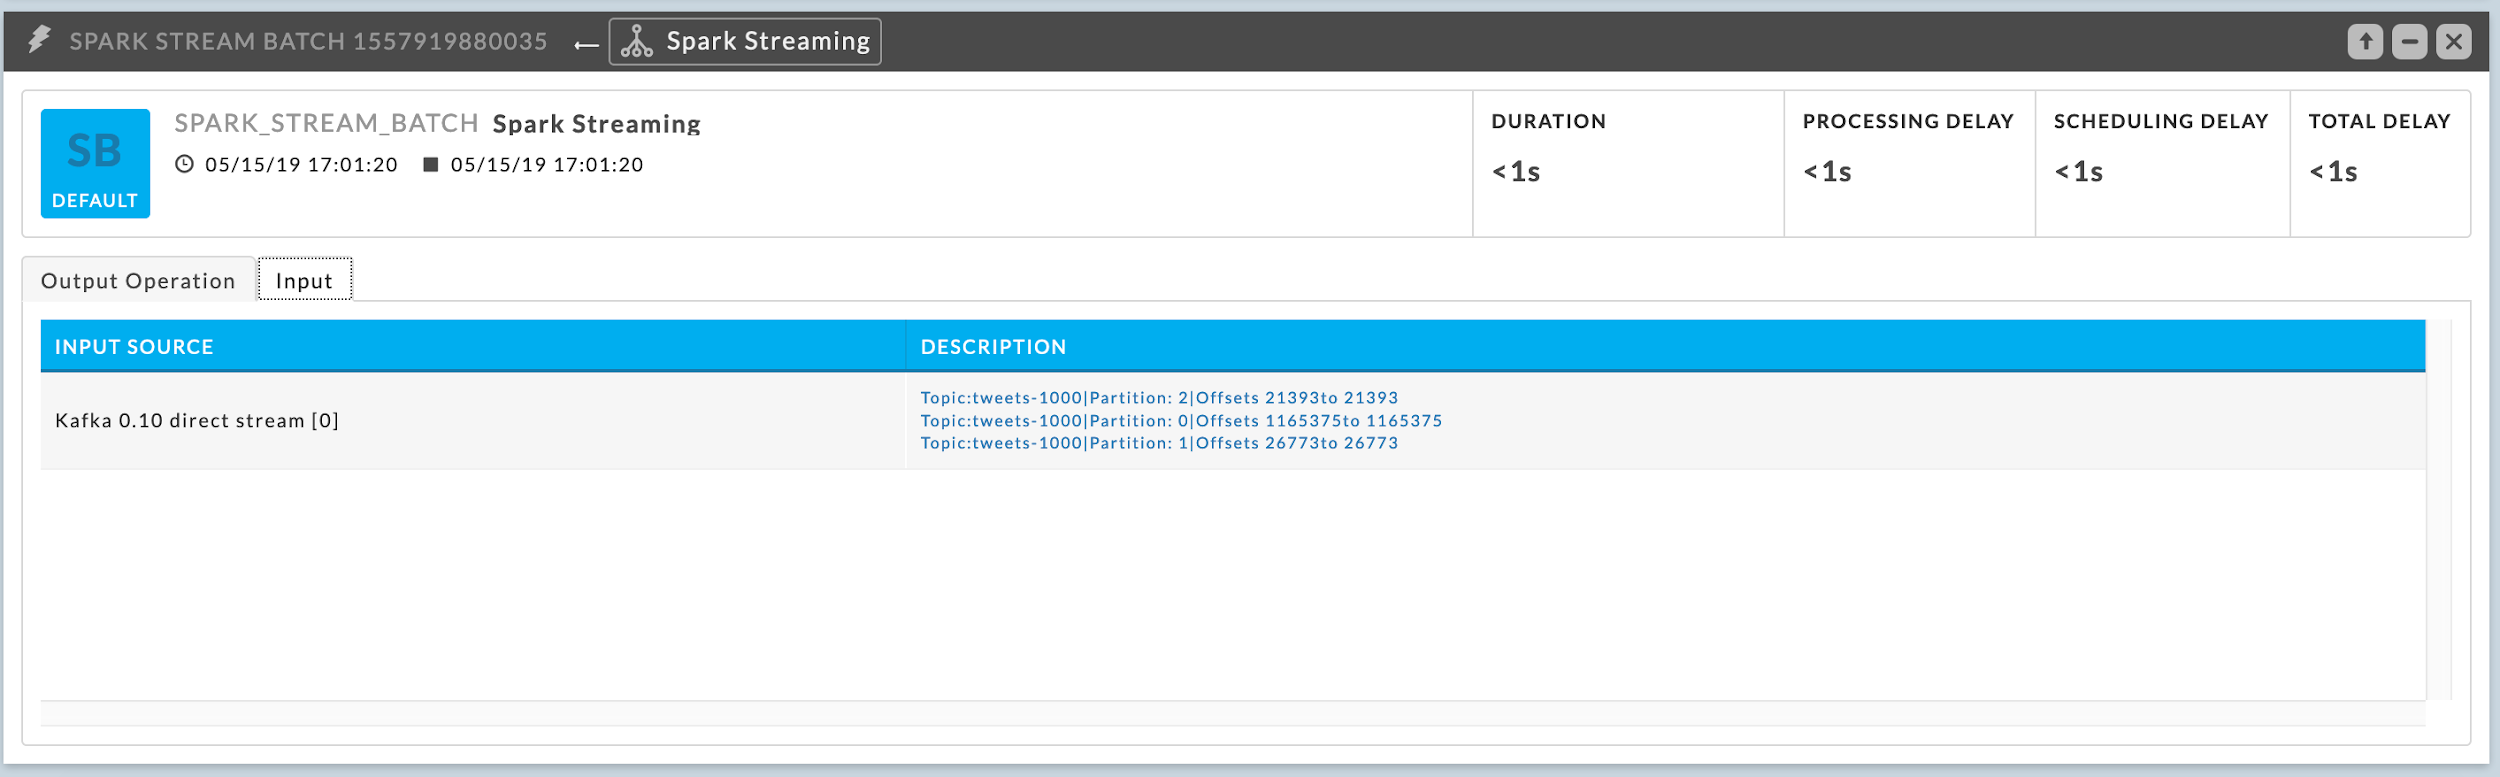
When you see the Spark app is consuming from Kafka, you need to examine Kafka side of the process to determine the issue. Click a batch to find the topic it is consuming.
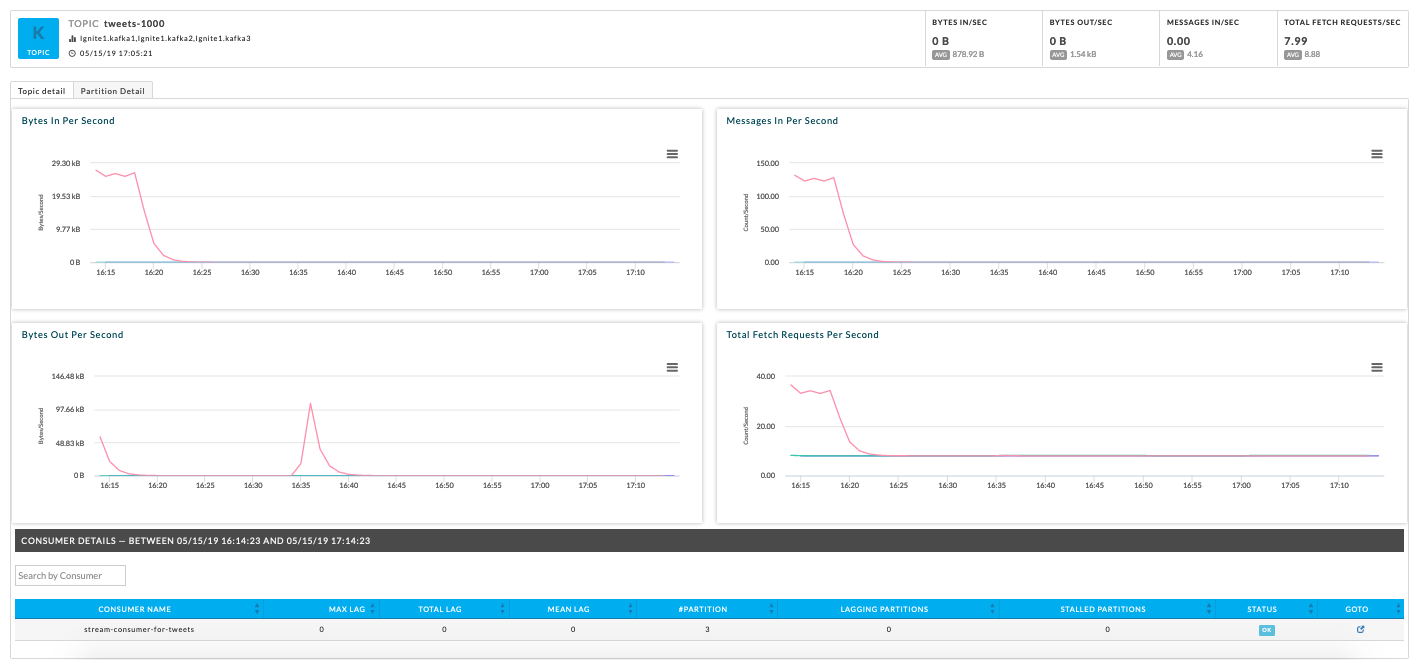
Bring up the Kafka Topic details which graphs the Bytes In Per Second, Bytes Out Per Second, Messages In Per Second, and Total Fetch Requests Per Second. In this case, you see Bytes In Per Second and Messages In Per Second graphs show a steep decline; this indicates the Kafka Topic is no longer producing any data.
The Spark app isn't consuming data because there is no data in the pipeline to consume.
You should notify the owner of the app that writes to this particular topic. Upon notification, they can drill down to determine and then resolve the underlying issues causing that writes to this topic to fail.
‘Slow’ Spark app and offline partitions in the Kafka cluster
In this scenario, an app's run has processed significantly less data when compared to what is the expected norm. In the above scenario, the analysis was fairly straightforward. In these types of cases, the underlying root cause might be far more subtle to identify. The Unravel APM can help you to quickly and efficiently root cause such issues.
When you see a considerable difference in the data processed by consecutive runs of a Spark App, bring up the APMs for each app.
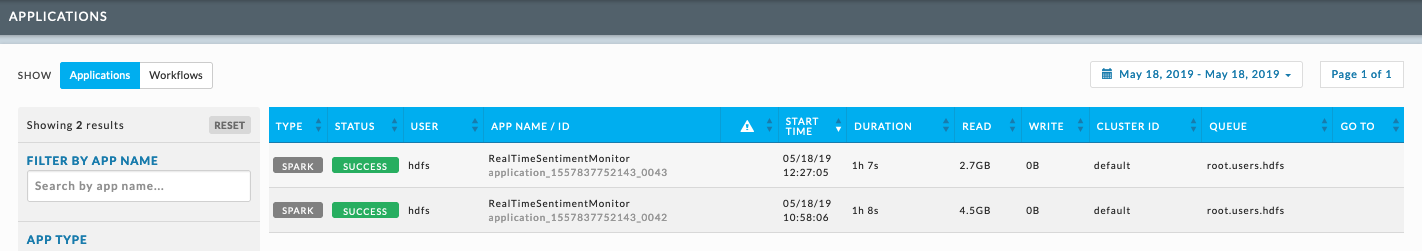
Examine the trend lines to identify a time window when there is a drop in input records for the slow app. The image, the slow app, shows a drop off in consumption.
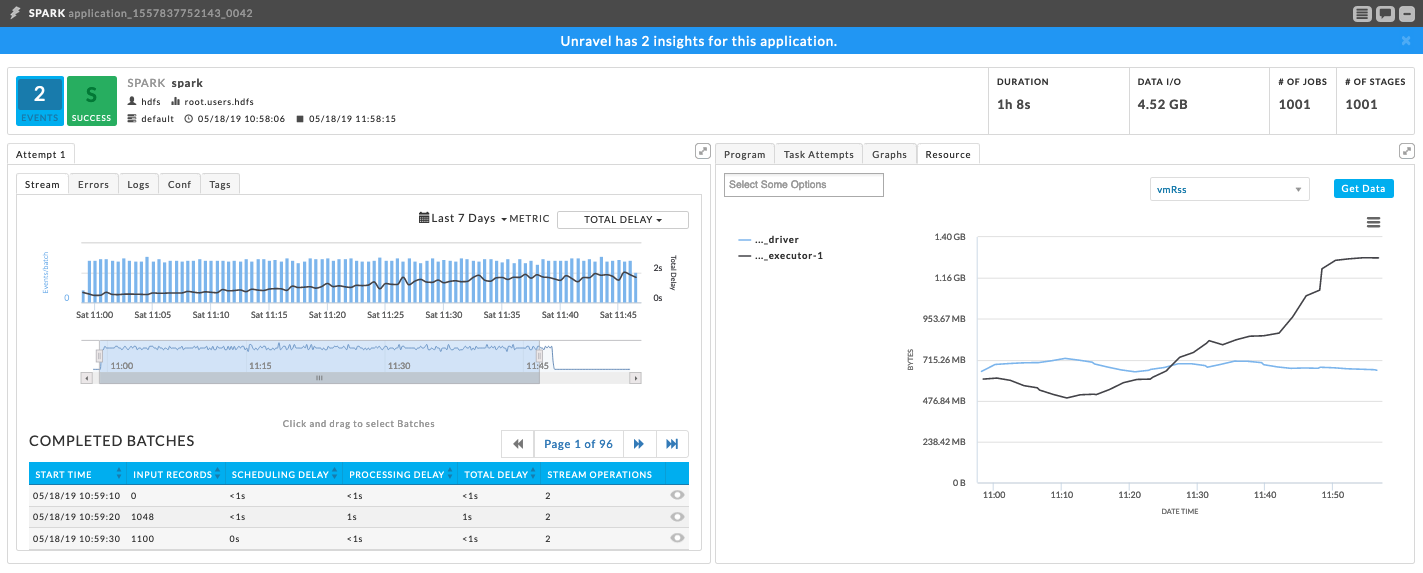
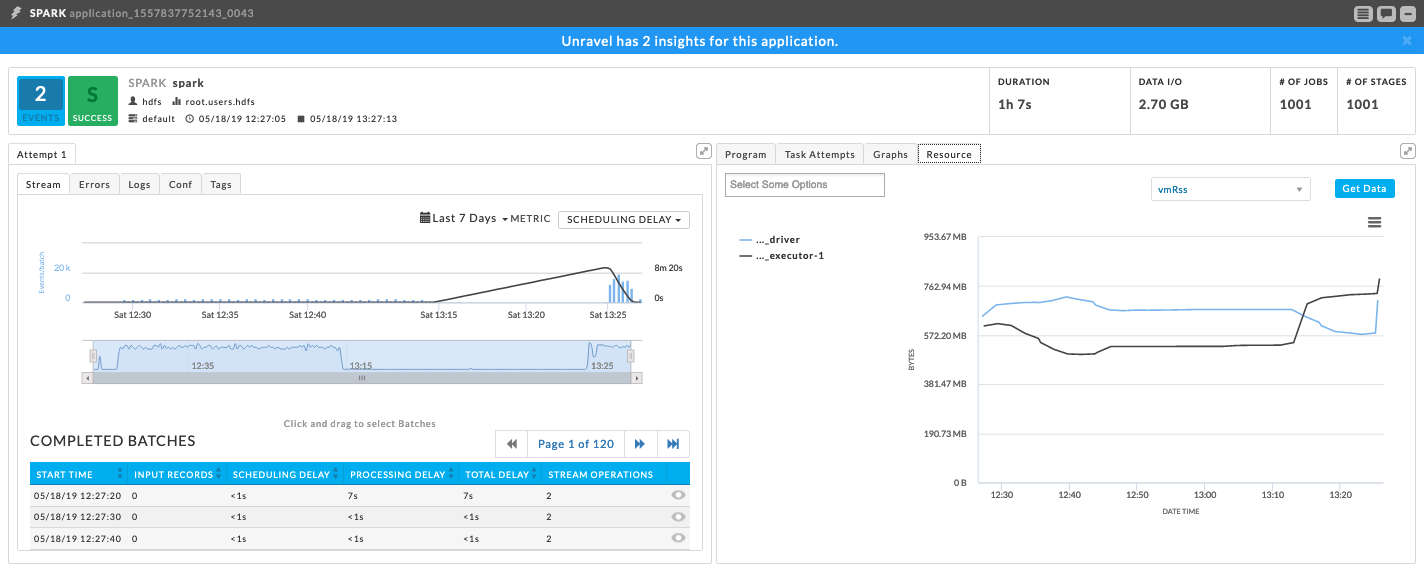
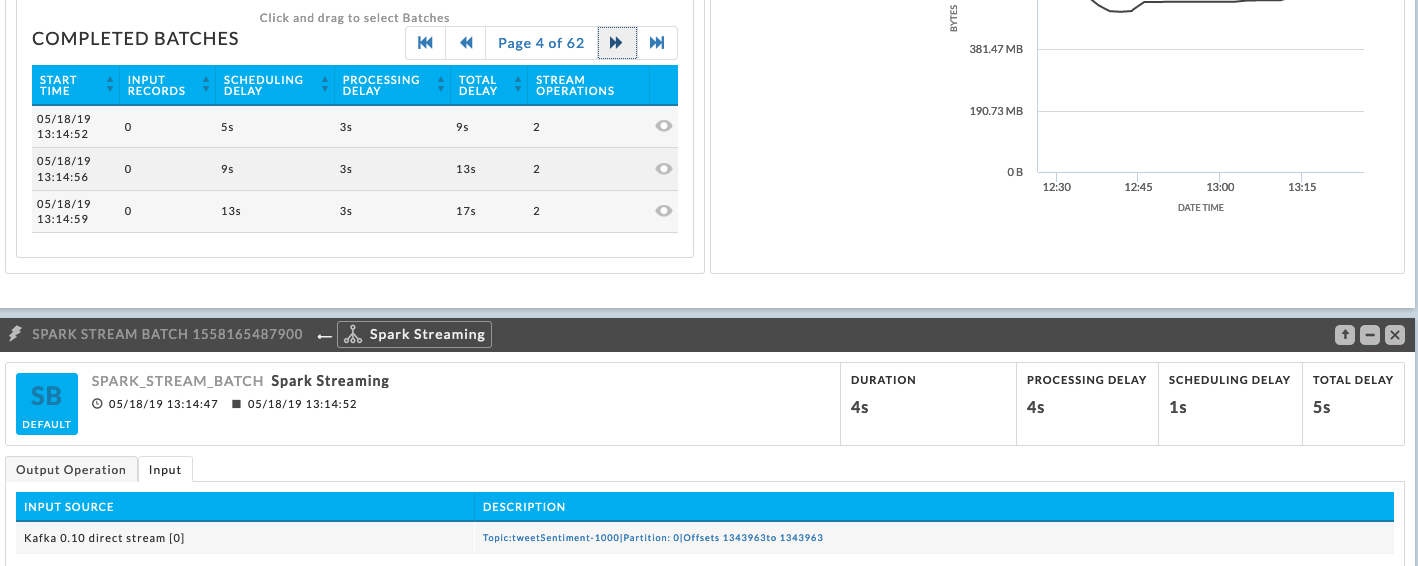
Drill down into the slow app's stream graph to narrow the time period (window) in which the I/O dropped off.
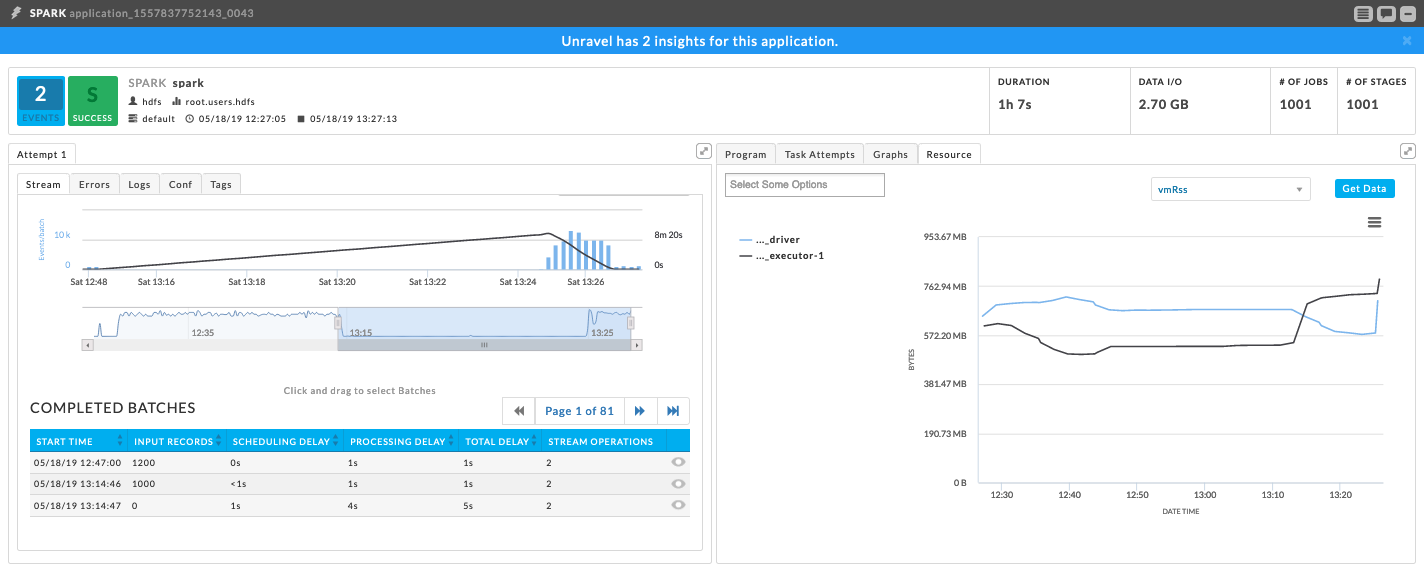
Unravel displays the batches that were running during the problematic time period. Inspect the time interval to see the batches' activity. In this example no input records were processed during the suspect interval. You can dig further into the issue by selecting a batch and examining it's input tab. In the following case, you can infer that no new offsets have been read based upon the Input Source's Description,“Offsets 1343963 to Offset 1343963”.
You can further debug the problem on the Kafka side by viewing the Kafka cluster monitor. Navigate to Operations > Usage Details > Kafka. At a glance, the cluster's KPIs convey important and pertinent information.
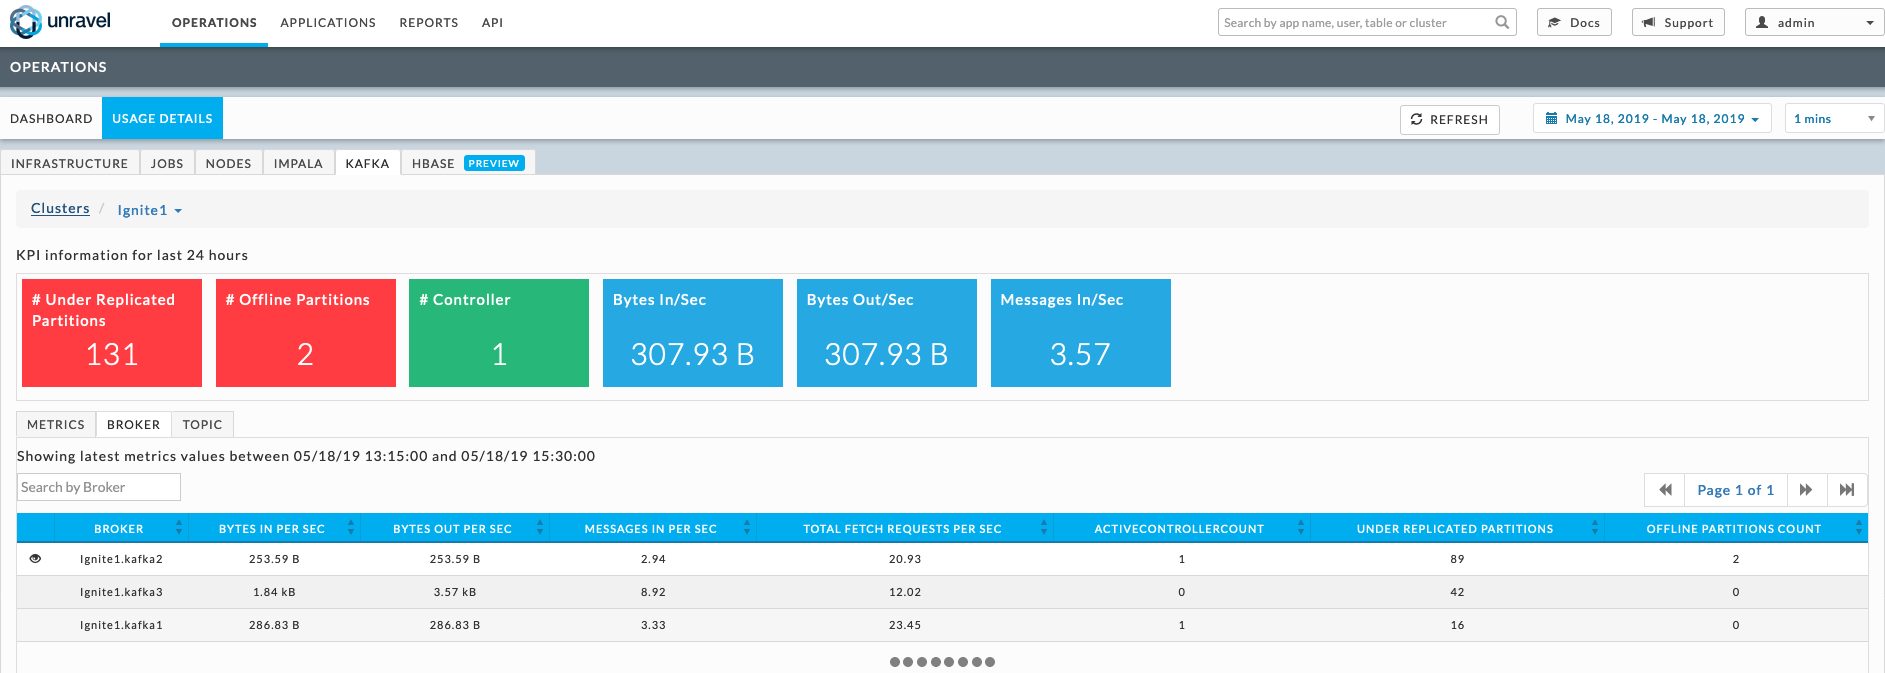
Here, the first two metrics show that the cluster is facing issues which need to be resolved as quickly as possible.
# of Under Replicated Partitions is a broker level metric of the count of partitions for which the broker is the leader replica and the follower replicas that have yet not caught up. In this case there are 131 under replicated partitions.
# of offline partitions is a broker level metric provided by the cluster's controlling broker. It is a count of the partitions that currently have no leader. Such partitions aren't available for producing/consumption. In this case there are two offline partitions.
You can select the Broker tab to see broker table. Here the table hints that the broker, Ignite1.kafka2 is facing some issue; therefore, the broker's status should be checked.
Broker Ignite1.kafka2 has two offline partitions. The broker table shows that it is/was the controller for the cluster. We could have inferred this because only the controller can have offline partitions. Examining the table further, we see that Ignite.kafka1 also has an active controller of one.
The Kafka KPI # of Controller lists the Active Controller as one which should indicate a healthy cluster. The fact that there are two brokers listed as being one active controller indicates the cluster is in an inconsistent state.
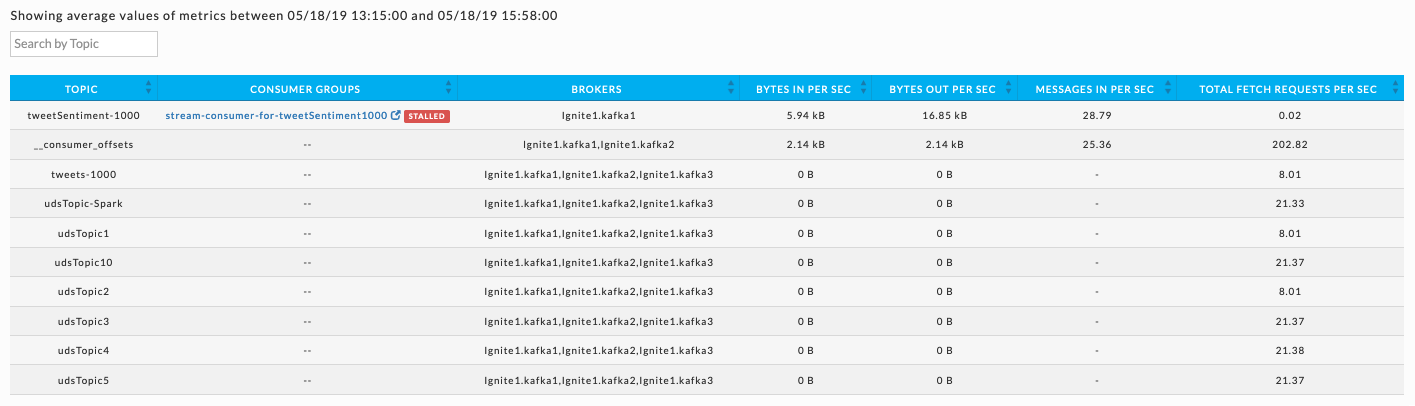
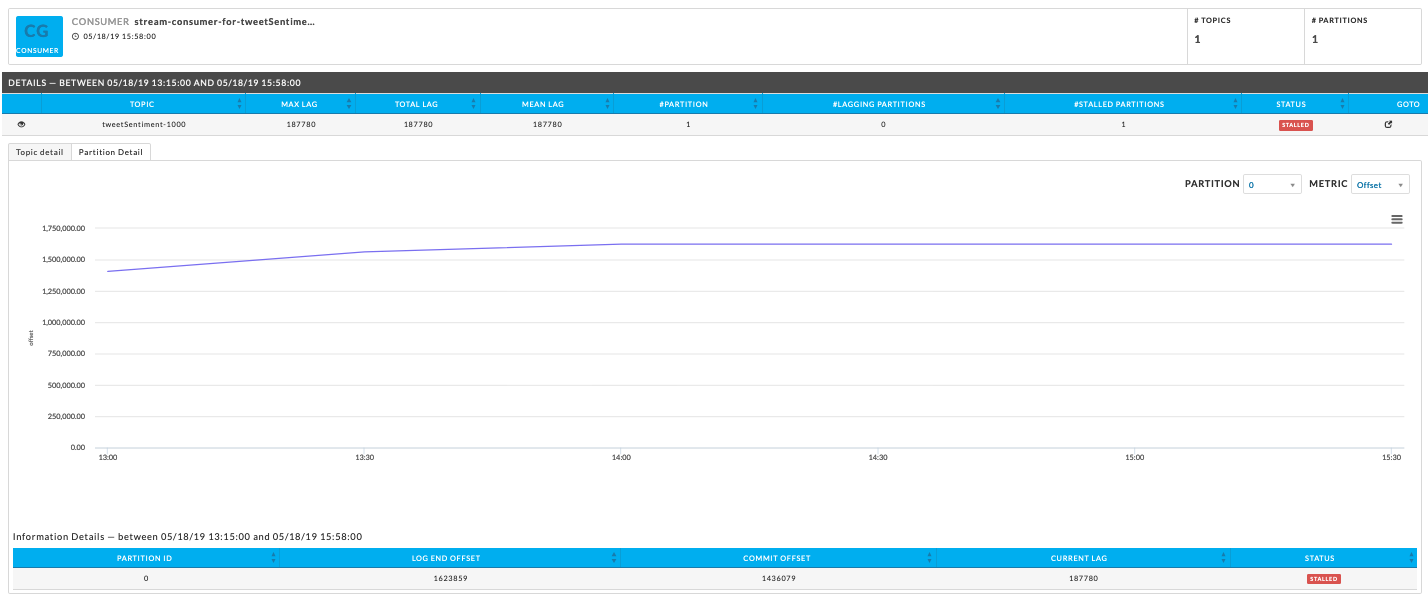
You can further corroborate the hypothesis by checking the status of the consumer group for the Kafka topic the Spark App is consuming from. In this example, consumer groups' status indicates it's currently stalled. The topic the stalled group is consuming is tweetSentiment-1000.
To drill down into the consumer groups topic, click the TOPIC tab in the Kafka Cluster manager and search for the topic. In this case, the topic's trend lines for the time range the Spark app's consumption dropped off show a sharp decrease in the Bytes In Per Second and Bytes Out Per Second. This decrease explains why the Spark app isn't processing any records.
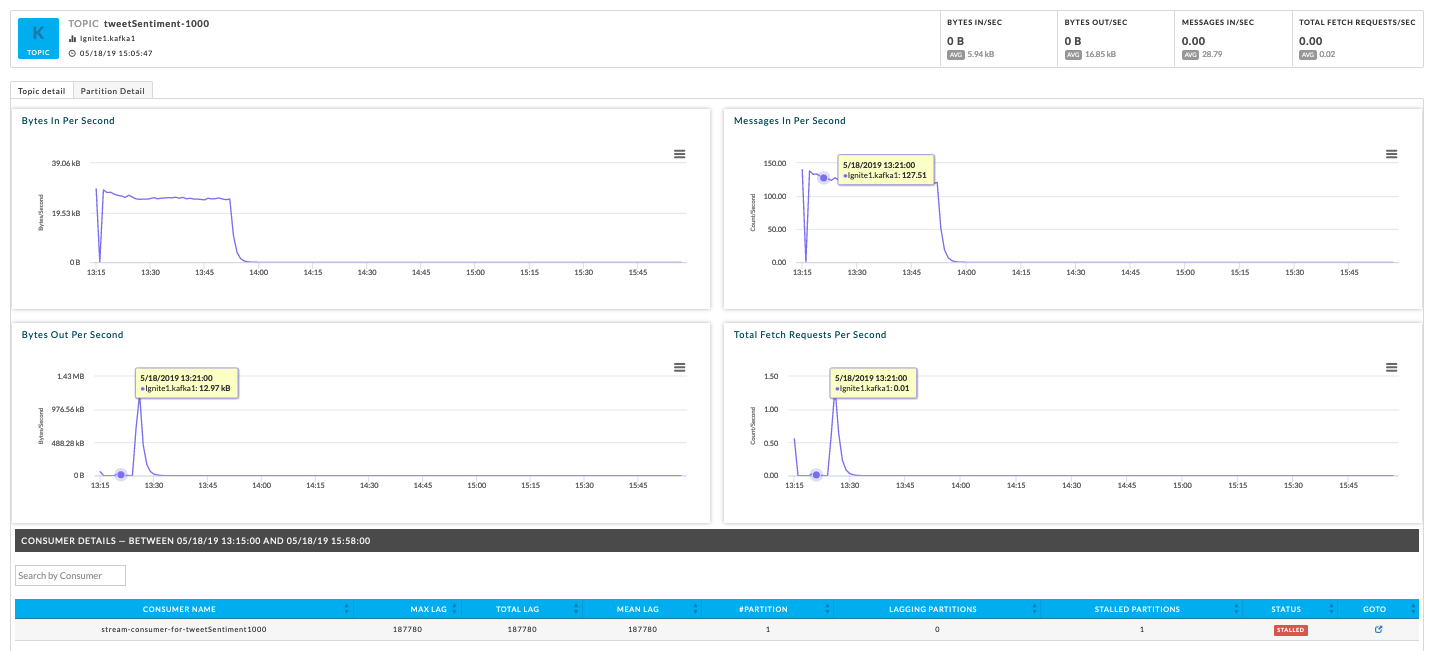
To view the consumer groups lag and offset consumption trends, click the consumer groups listed for the topic. In this example, the topic's consumer groups, stream-consumer-for-tweetSentimet1000, log end offset trend line is a constant (flat) line that shows no new offsets have been consumed with the passage of time. This further supports our hypothesis that something is wrong with the Kafka cluster and especially broker Ignite.kafka2.
These are but two examples of how Unravel helps you to identify, analyze, and debug Spark Streaming apps consuming from Kafka topics. Unravel's APMs collates, consolidates, and correlates information from various stages in the data pipeline (Spark and Kafka), thereby allowing you to troubleshoot apps without ever having to leave Unravel.