Applications page
The Applications page for Databricks displays the following tabs:
Job Runs
The Job Runs tab provides details about the job execution within different applications.
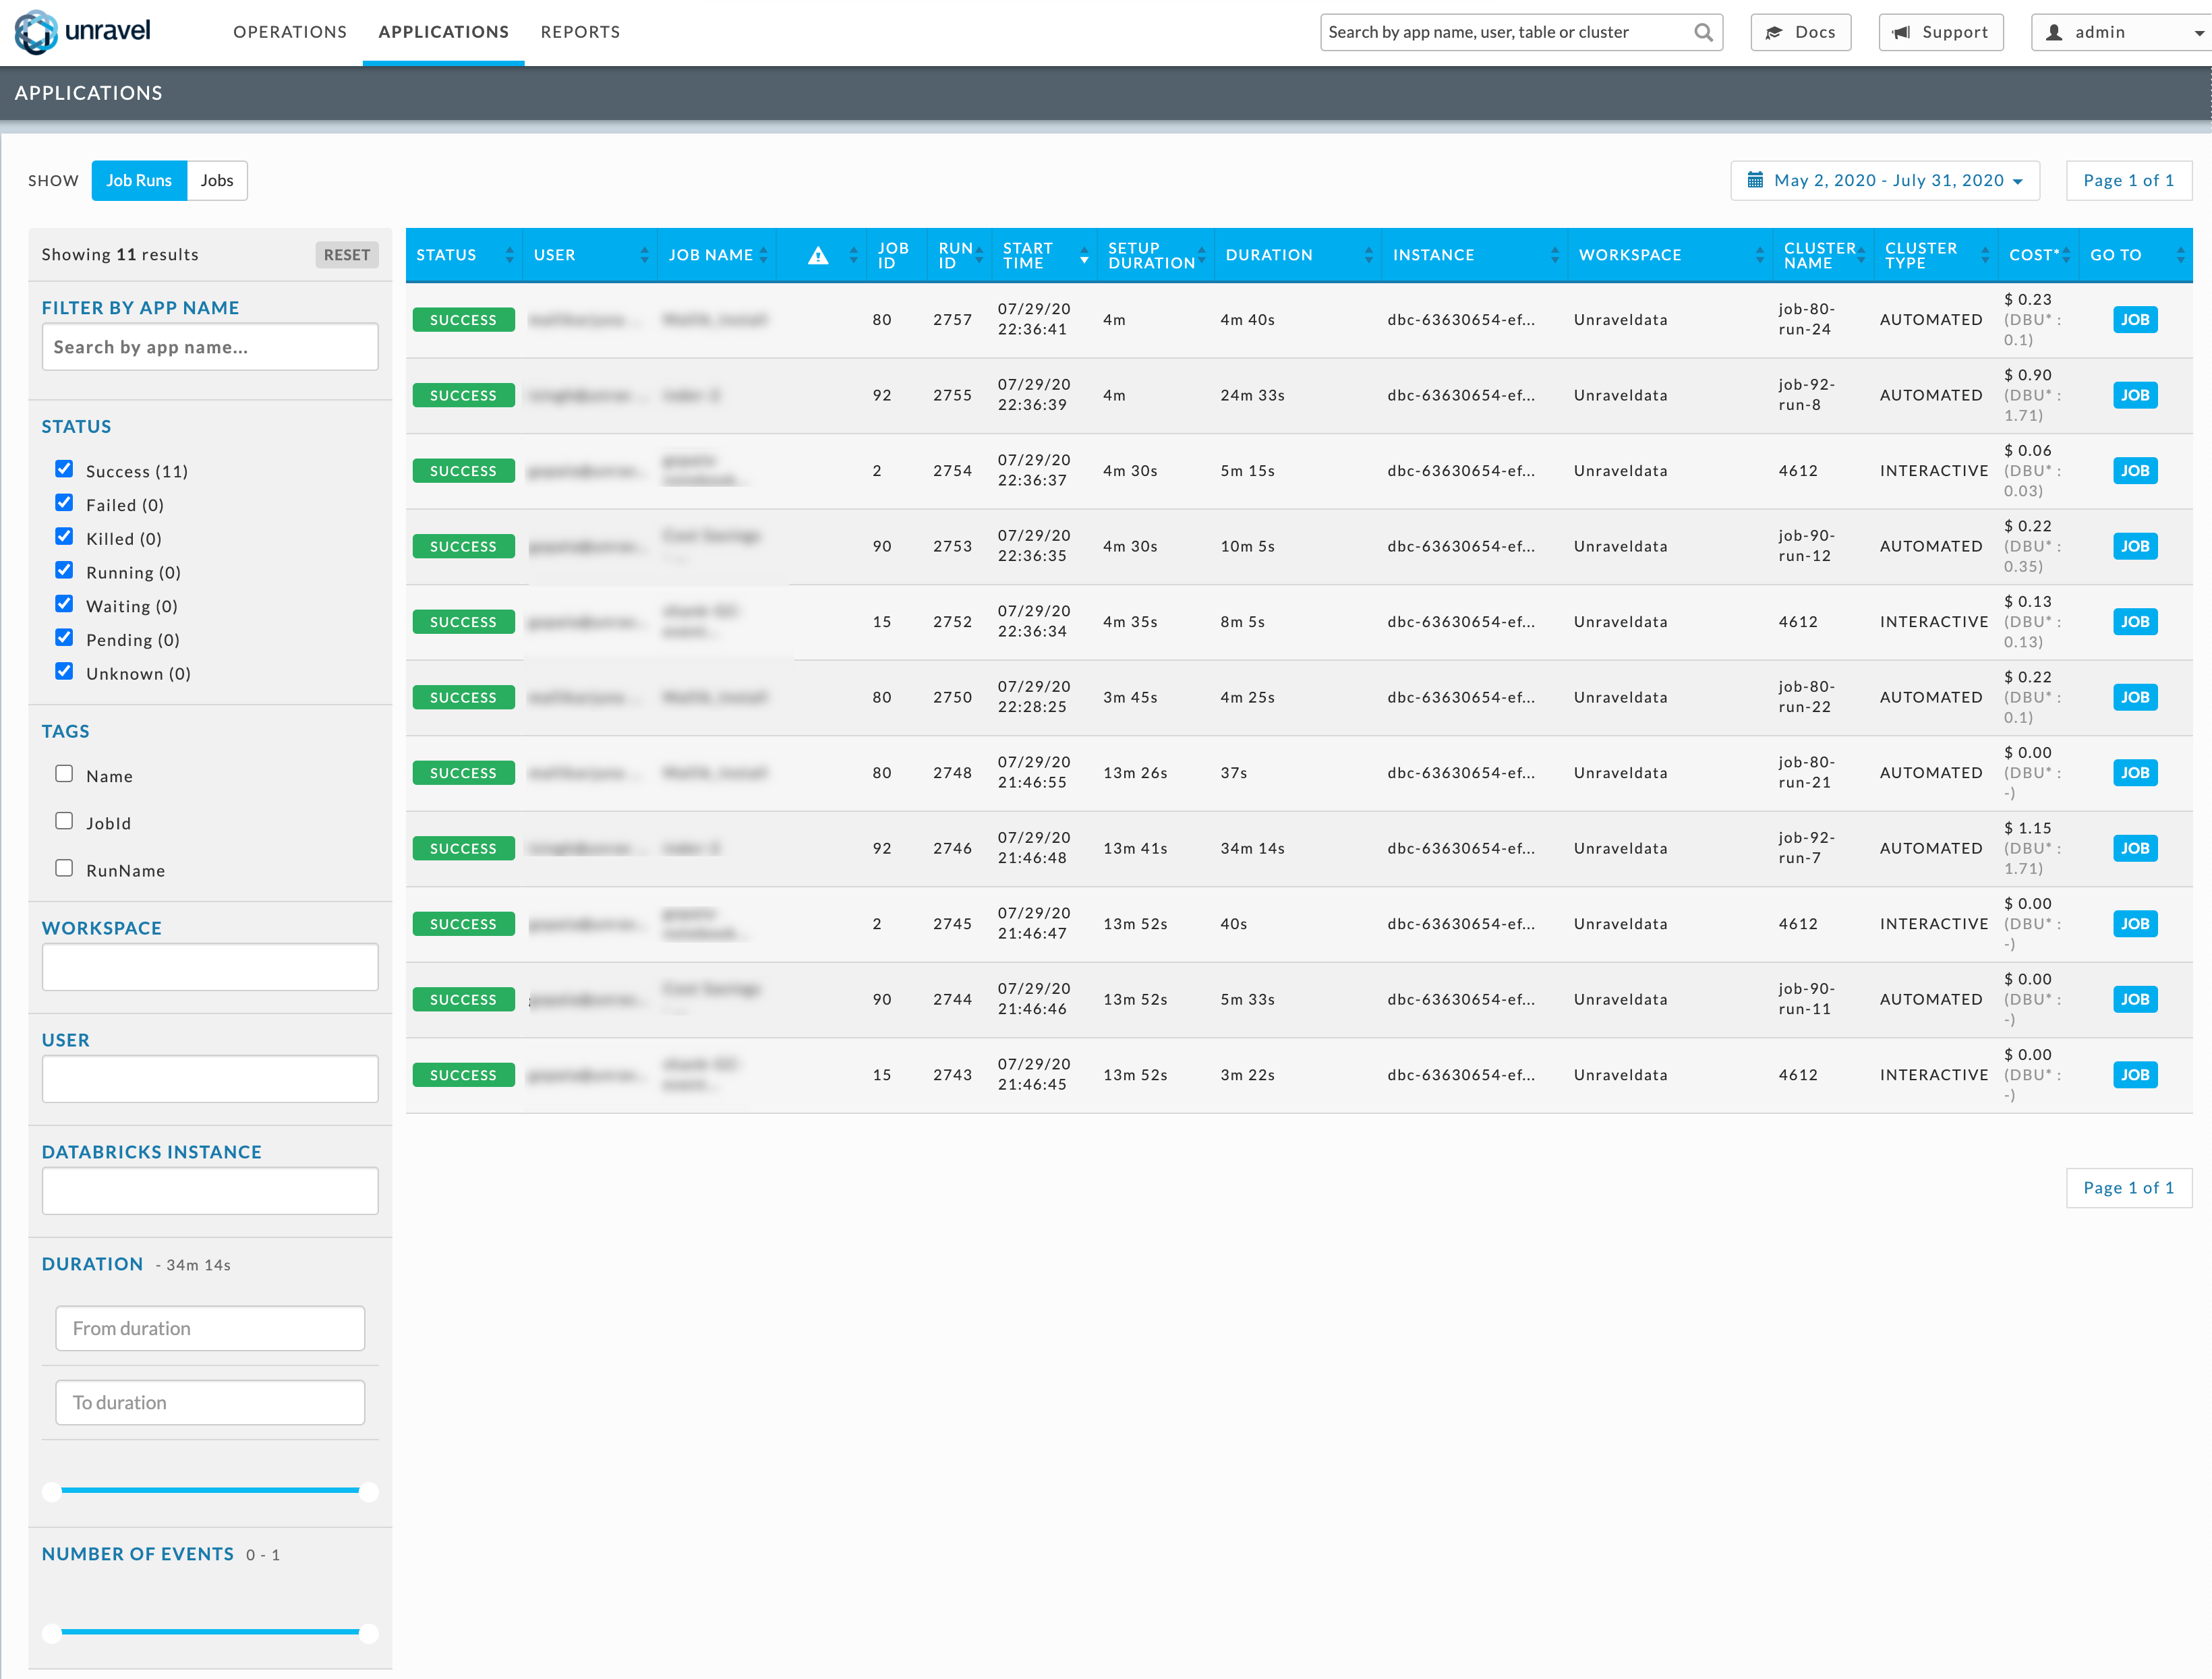
The details of a job run are listed in the following columns:
Columns | Description |
|---|---|
Status | App status. |
User | Name of the user who has run the job. |
Job Name | Name of the job. |
Notification Column ( | A fine-tuning ( |
Job ID | Unique ID of the job. |
Run ID | Unique ID of the run across a workspace. |
Start time | The start time and day of the application. |
Setup Duration | Time period required to set up the cluster. |
Duration | Total time taken by the application. |
Instance | Name of the Databrick Instance Id. |
Workspace | Name of the Workspace. |
Cluster Name | Name of the Databricks cluster. |
Cluster Type | Type of the Databricks cluster. (Interactive, Automative). |
Cost | An estimated cost incurred in running the app. This cost is calculated based on VM and DBU price. |
Job Name | Job's run name. |
Go To | Links to access more details of a specific job. |


Note
See Common UI Features for general information and common features about Unravel's UI.
Filtering Job Runs
You can filter the job runs using any of the following options:
Date and Time: Select a date and time range of the apps using the date picker above the table.
Filtering options: You can filter the applications using any of the following filtering options on the left panel:
App Name: Specify the name of the application and the applications matching the string are listed.
Status: Select any of the following status and the applications matching the status are displayed:
Success
Failed
Killed
Running
Waiting
Pending
Unknown
Tags: Select a tag and then click in the text box and choose a valid value, the corresponding applications are displayed. You may select none to all the options available.
Workspace: Click in the text box and then select a workspace from the drop-down. The corresponding applications are displayed.
User: Click in the text box and select a user. The corresponding applications are displayed.
Databricks Instance: Click in the text box and select a Databricks instance. The corresponding applications are displayed.
Duration: You can use the slider to set the range, or enter it directly in the from and to text boxes. The applications matching the duration are displayed.
Number of Events: The range of events is shown, for instance, 0-4. You can select a range by using the slider to specify the upper and lower bounds. The applications matching the number of events are displayed.
You can click anywhere within a specific row to bring up the Application Performance Management (APM) page.
Jobs
This tab lists all the jobs, with a trend line showing its Runs.
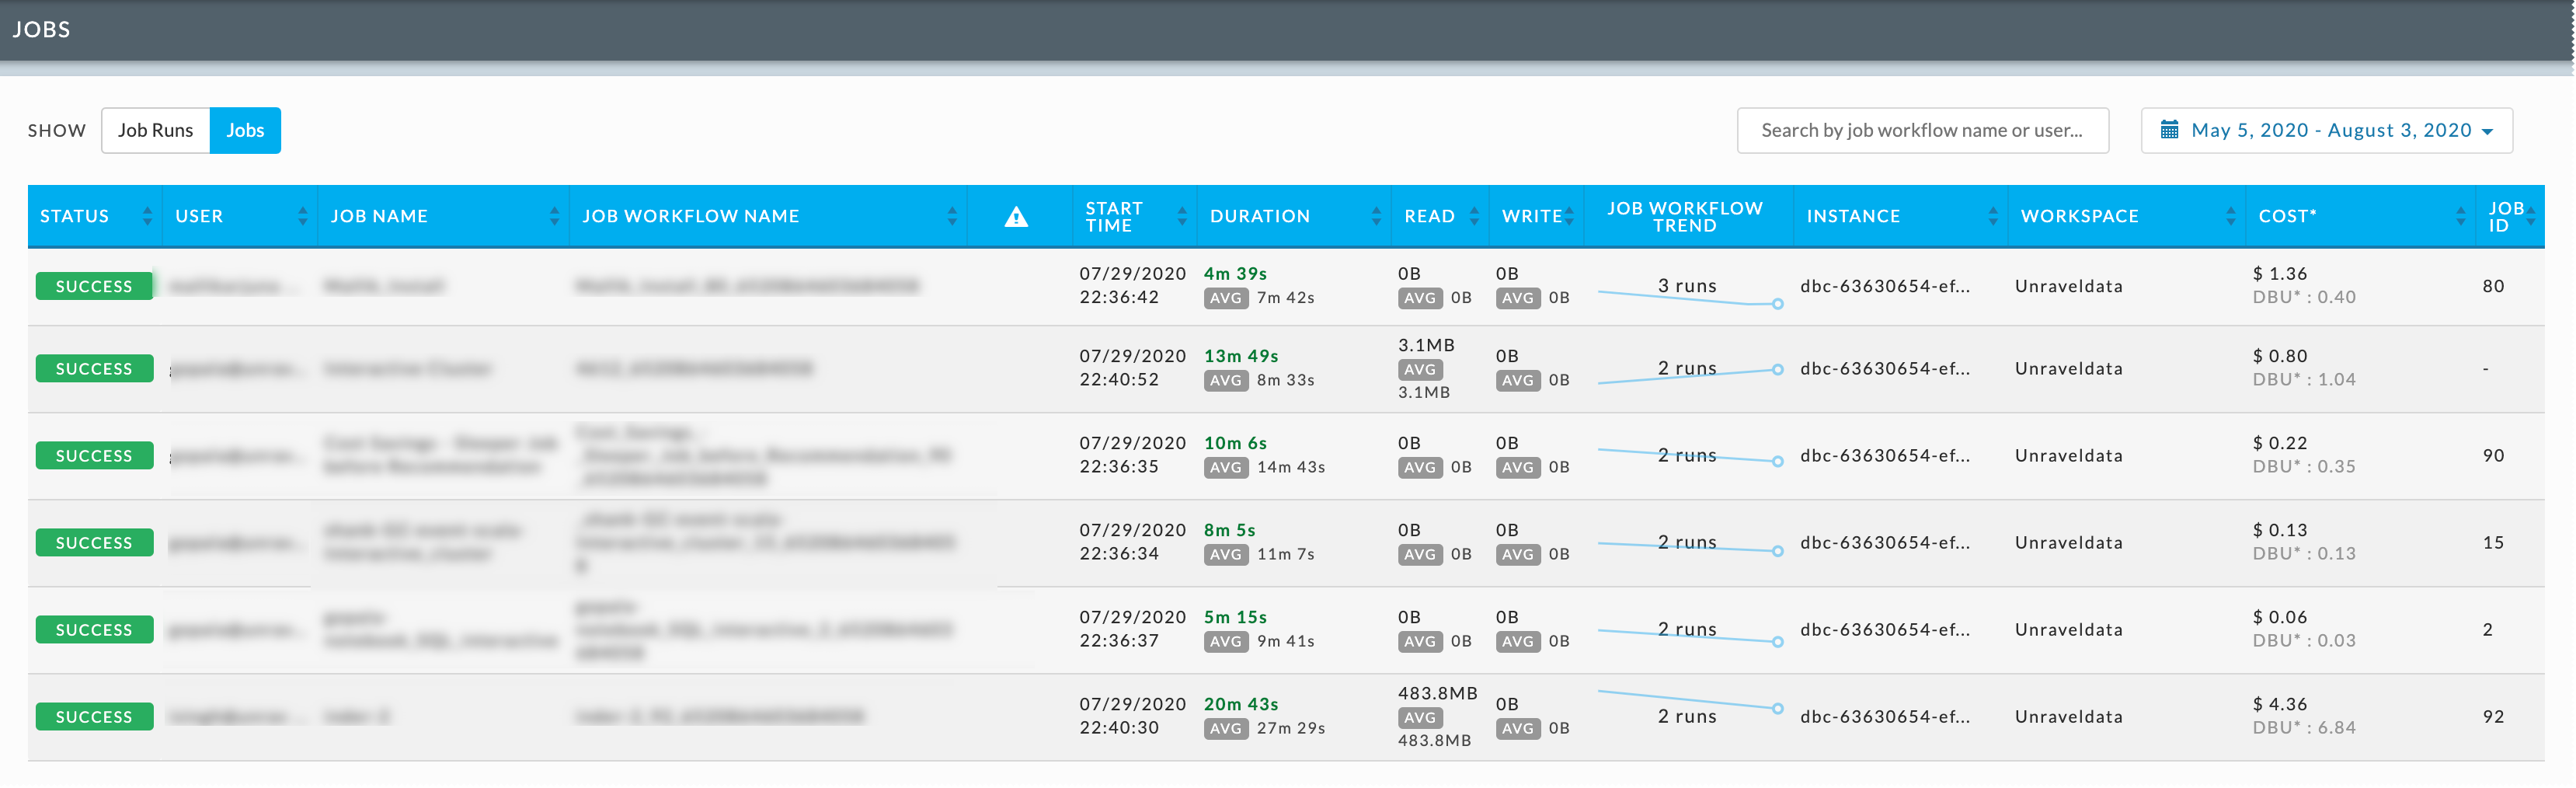
The columns are:
Columns | Description |
|---|---|
Status | App status. |
User | Name of the user who submitted the app. |
Job Name | Job's run name. |
Job Workflow Name | Name or ID of the app. |
Notification Column ( | A fine-tuning ( |
Start Time | Start time, day, and time. |
Duration | Total time taken by the app, with the average duration across all the workflows. |
Read | Total data read by the app, with the average amount read across all the workflows. |
Write | Total data written by the app, with the average amount written across all the workflows. |
Job Workflow Trend | The trend across all the run of the workflow, the total number of runs is listed across the trend line. |
Instance | Name of the Databricks Instance Id. |
Workspace | Name of the Workspace. |
Cost | An estimated cost incurred in running the app. This cost is calculated based on VM and DBU price. |
Job Id | Id that is unique across a workspace. |