Timings
A Spark program is about multiple jobs that run in parallel on different executors. When we analyze a Spark program, it is essential to know the areas where the applications spend most of the time. The Timings tab in the Spark details page provides the details of the time spent by an application, that is, the application’s wall clock time, as well as the time spent by different tasks on each executor.
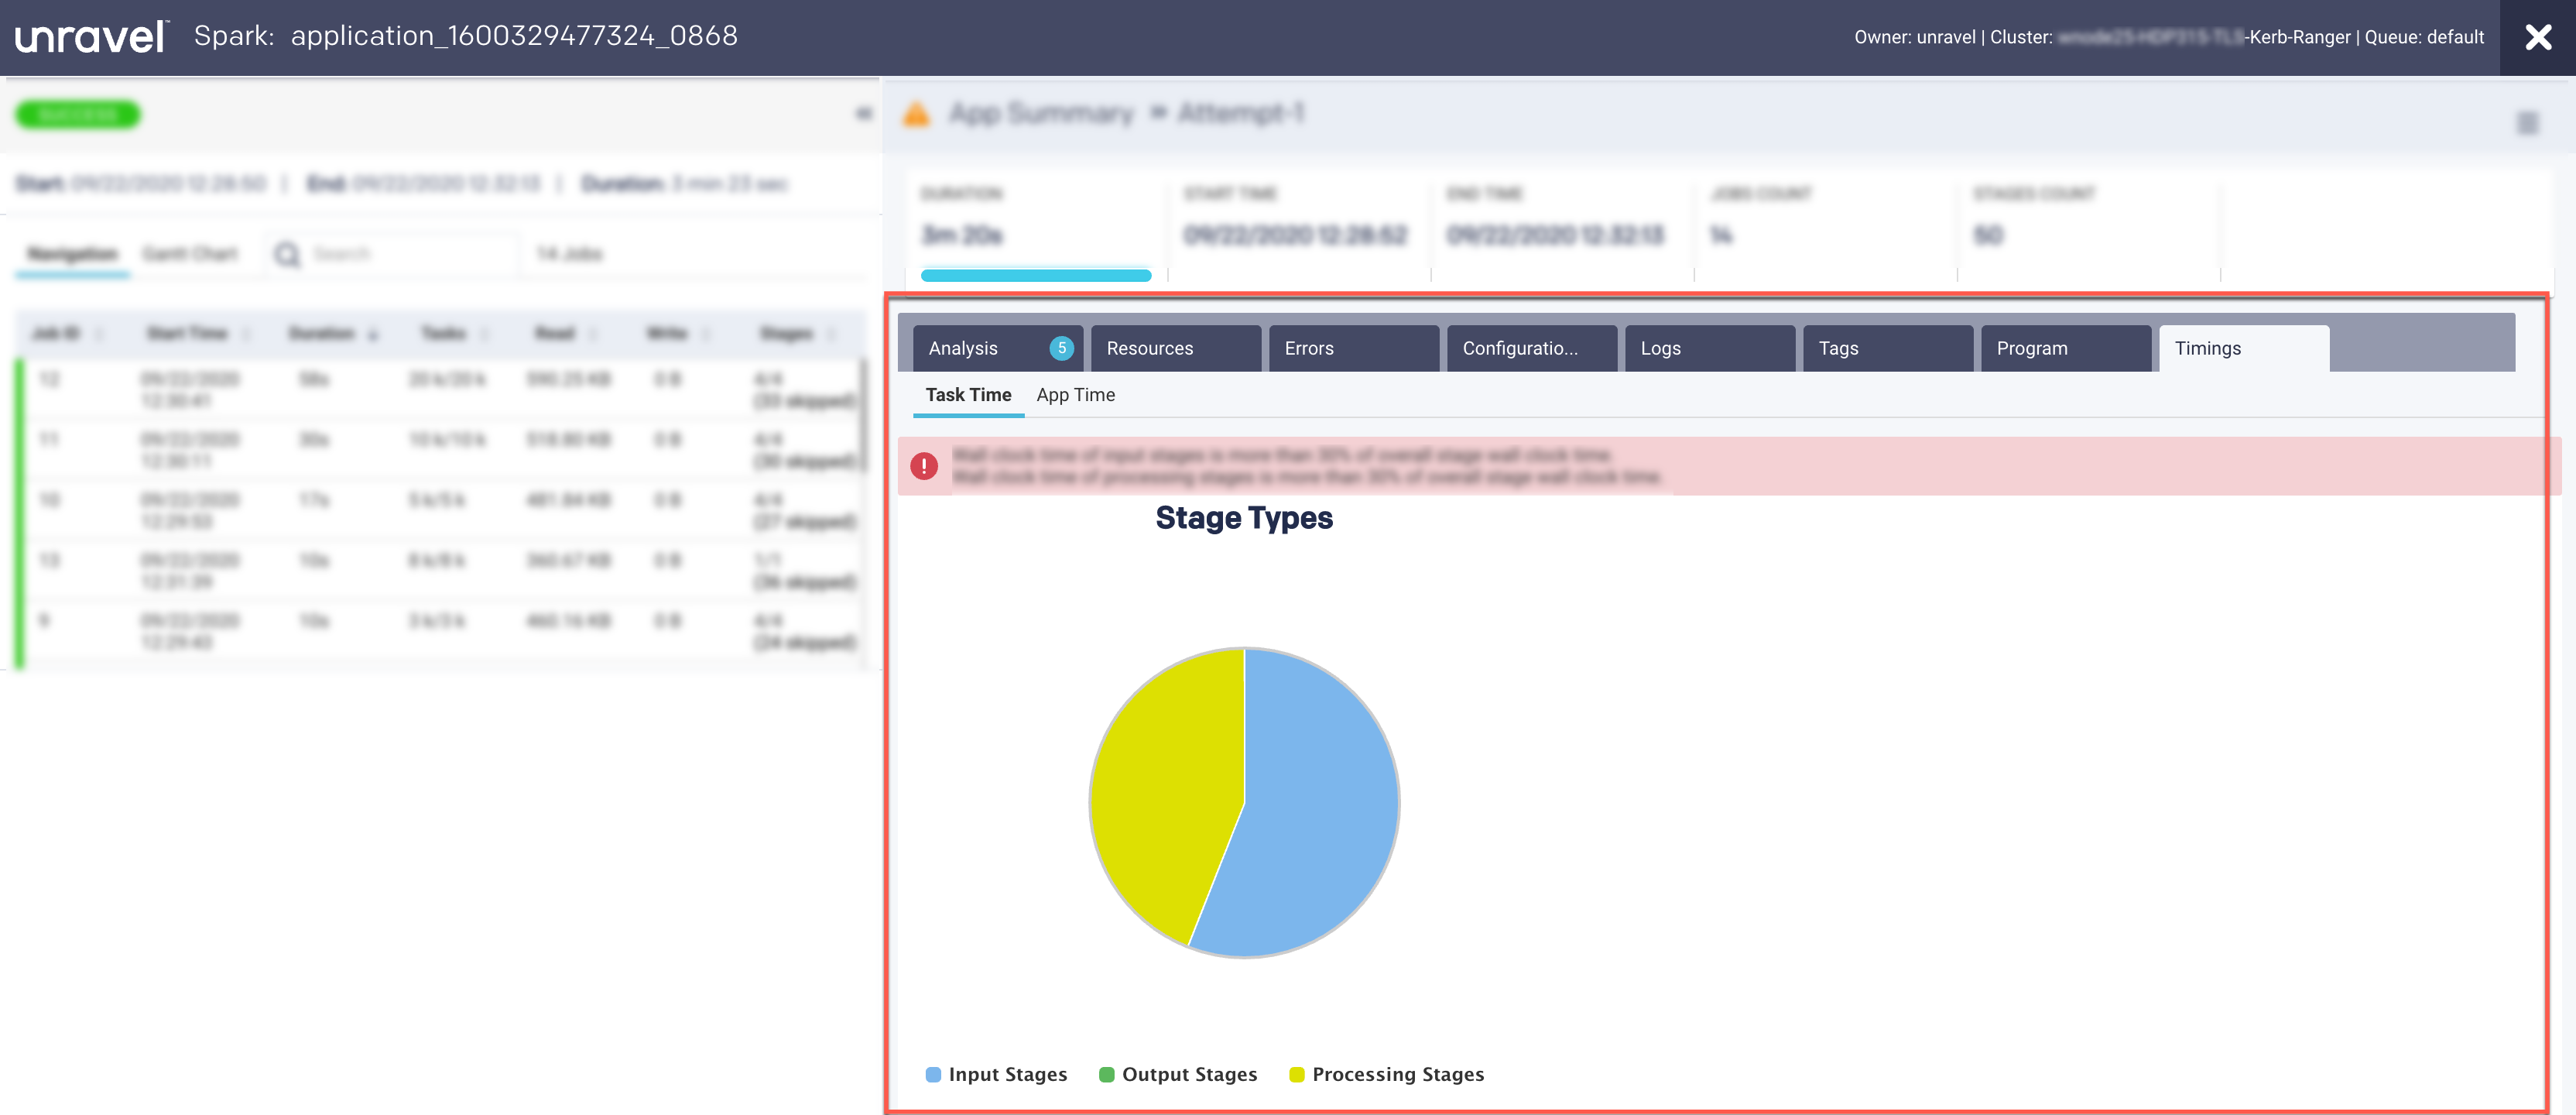
These are captured in the following views:
App Time
Task Time
Task Time
This view provides a breakdown of the areas where the time on tasks was spent.
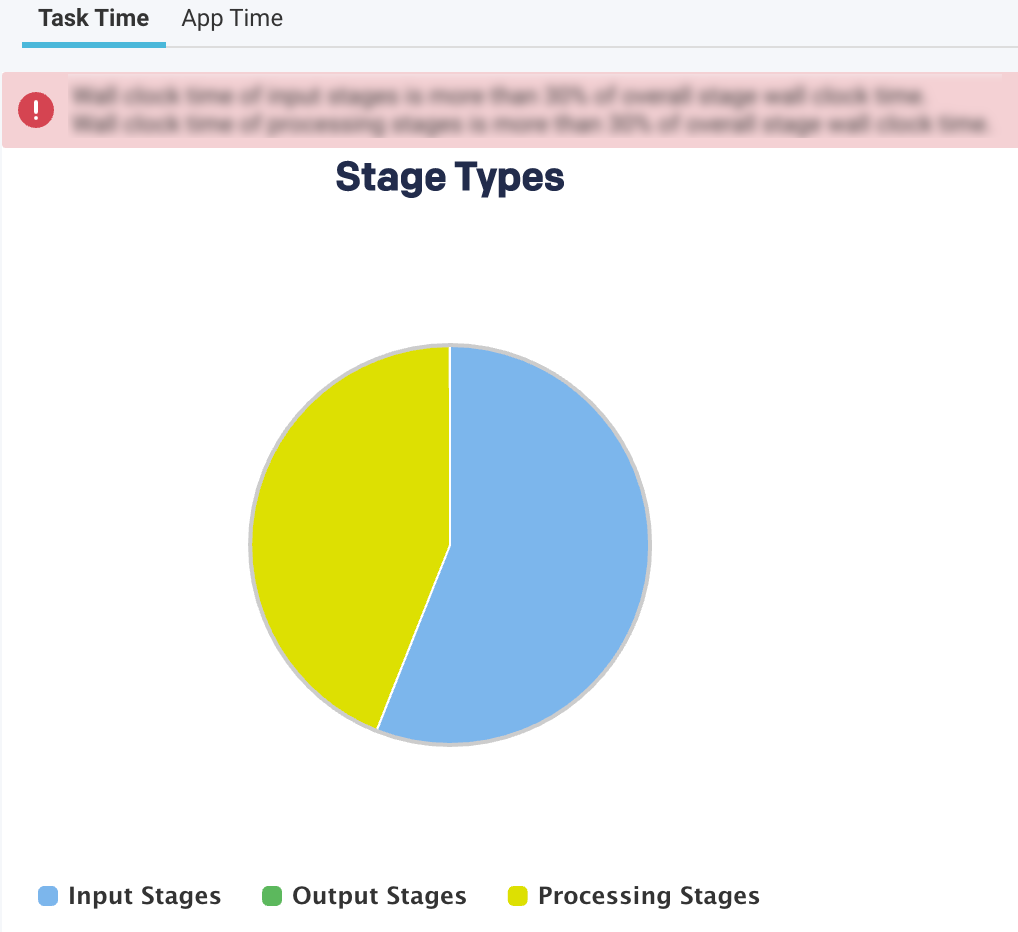
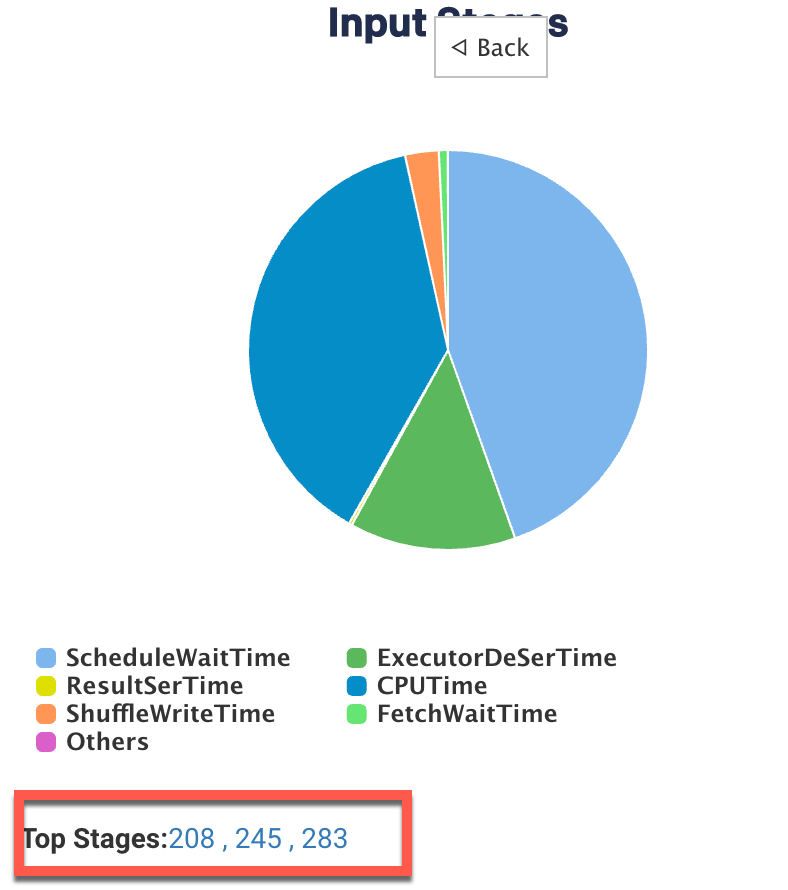
The top-level pie chart is divided into three types of stages:
Input Stages
This contains the total task duration of all the Spark stages, which read data from an external system, such as HDFS, S3, or JDBC.
Output Stages
This contains the total task duration of all the Spark stages, which write results to an external system such as HDFS, S3, or JDBC.
Processing Stages
This contains the total task duration of all the Spark stages, which are neither reading nor writing to external file systems.
Select any stages and click the corresponding pie chart to drill down further to view the time breakdown and other details.
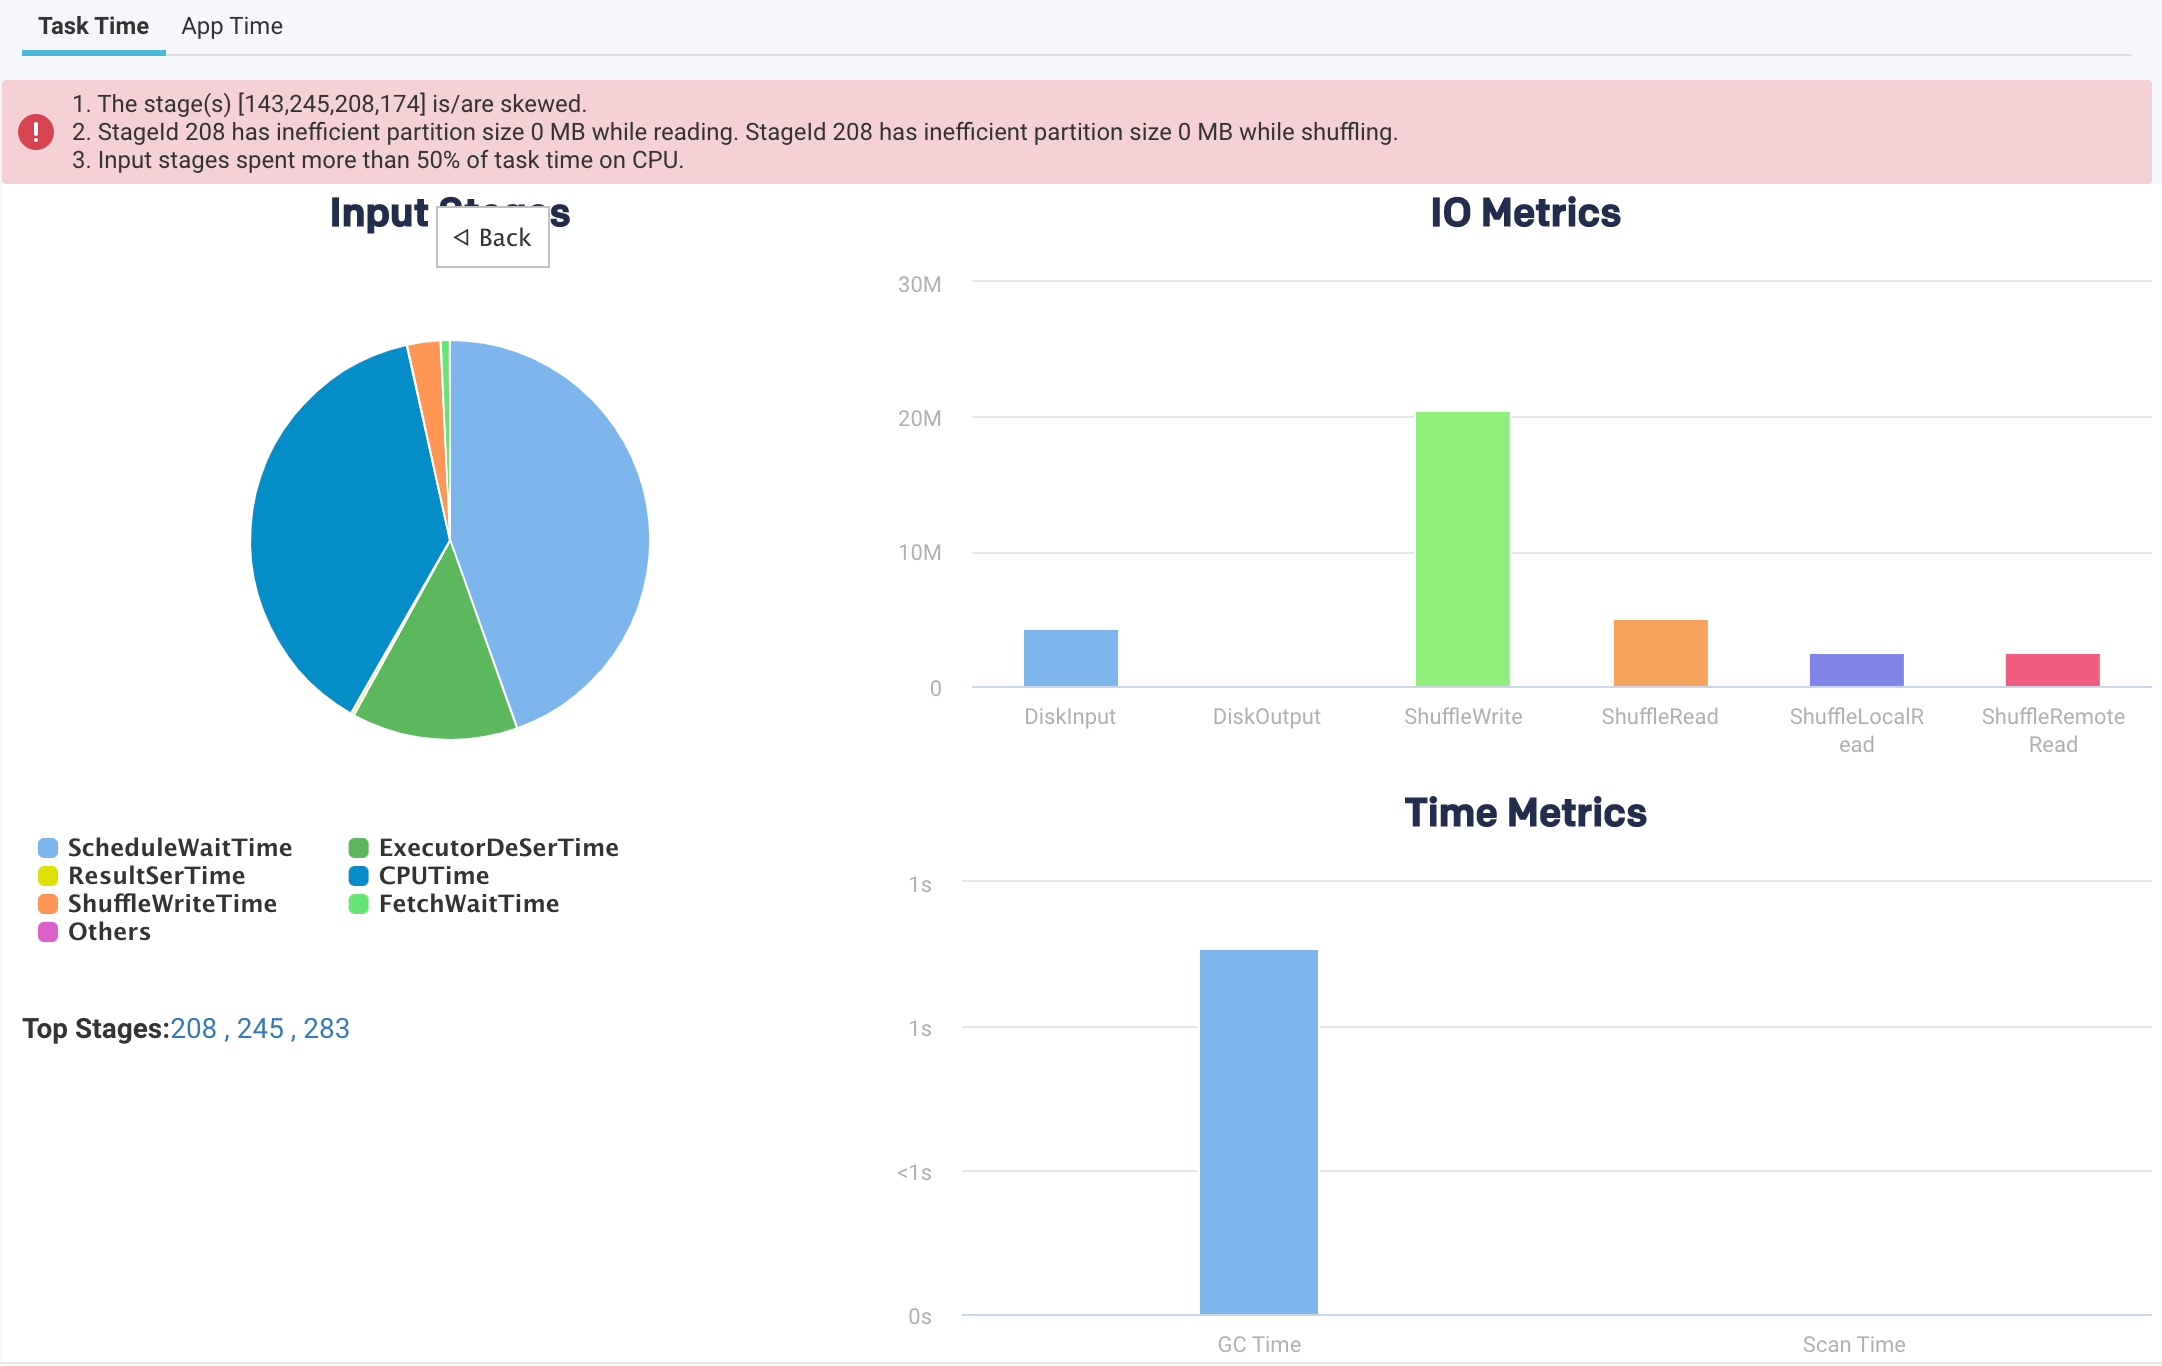
Pie-chart metrics
Item
Description
SchedulerDelay
Time to ship the task plus the time to ship the results back to the scheduler.
TaskDeserializationTime
Aggregated time spent on the executor to deserialize all tasks.
ResultSerializationTime
Aggregated time spent serializing the result of all tasks.
CPUTime
Aggregated CPU time that the executors spent to run all the tasks.
ShuffleWriteTime
An aggregated time that all the tasks spent blocking on the shuffle writes to disk or buffer cache.
ShuffleReadBlockTime
Aggregated time for all the tasks spent waiting for remote shuffle blocks.
Others
Other times all the tasks spent on components that could not be inferred.
Time metrics
Metric
Description
GC Time
The aggregated amount of time the JVM spent in garbage collection while executing all the tasks.
Scan Time
The aggregated amount of time spent reading data from files and tables.
IO Metrics
Metric
Description
DiskInput
Total data read by all the tasks.
DiskOutput
Total data written by all the tasks.
ShuffleWrite
Total shuffle data written by all the tasks
ShuffleRead
Total shuffle data read by all the tasks.
ShuffleLocalRead
Total shuffle data read, which were local to the executors.
ShuffleRemoteRead
Total shuffle data read, which were remote to the executors.
App Time
This view provides a breakdown of the application's wall clock time.
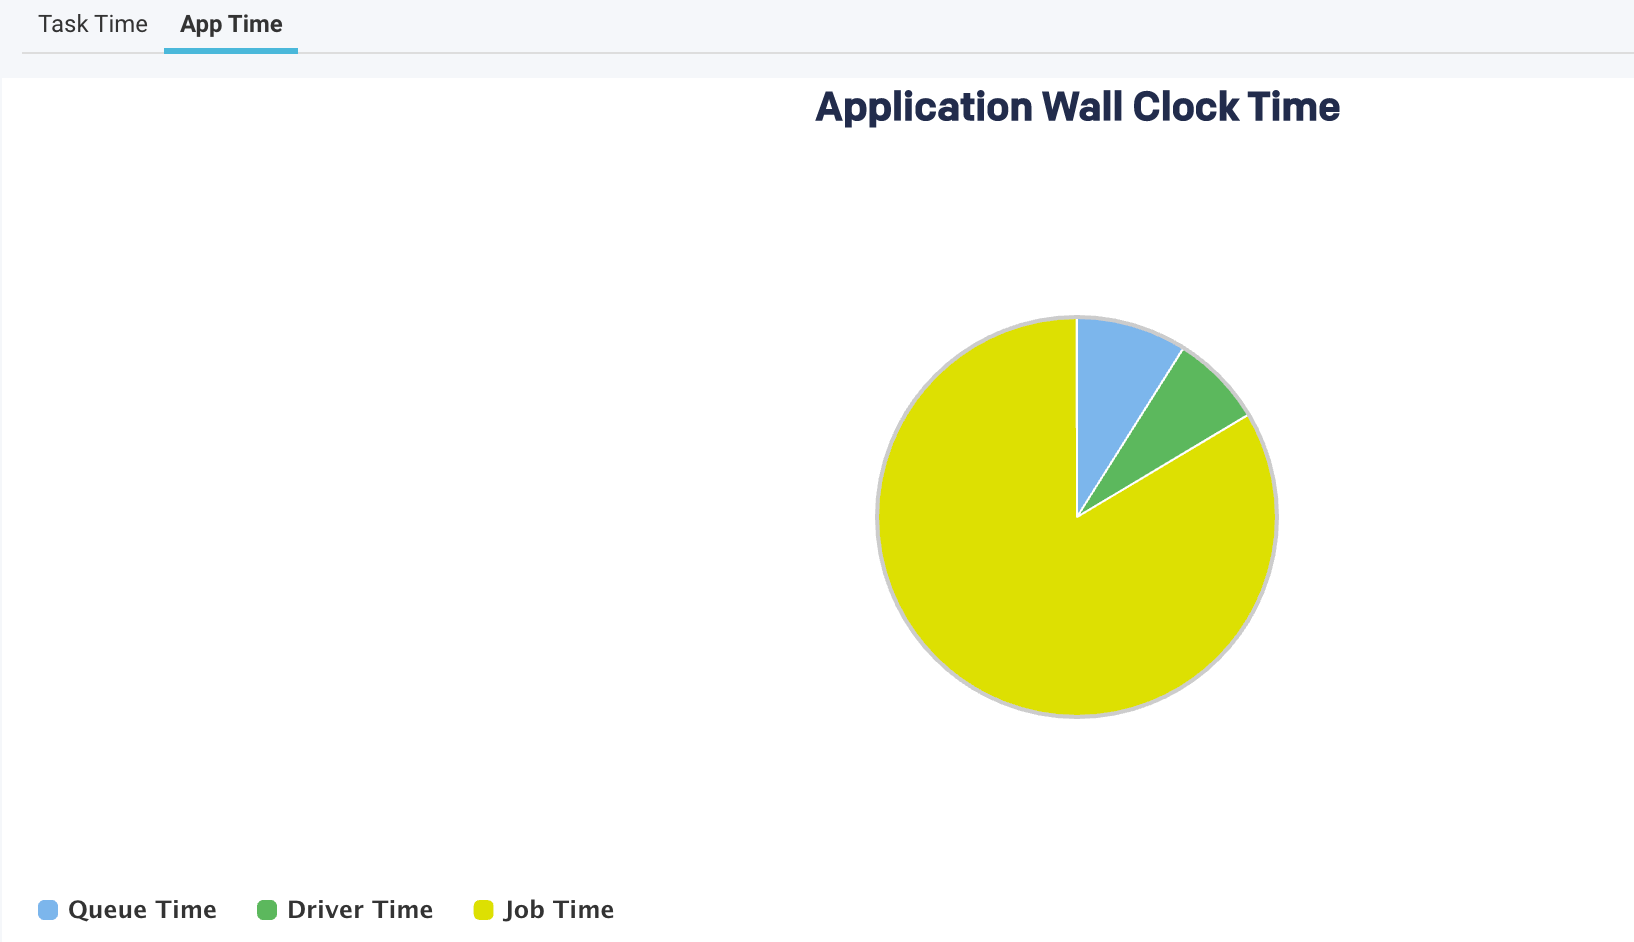
The following metrics are graphically represented in the App Time view:
Item | Description |
|---|---|
QueueTime | The time difference between the submission of an application and the start of the application. |
Driver Time | The time spent by the Spark applications exclusively on the driver. During this time, jobs are not executed. |
Job Time | The time when at least one job was running and thereby cluster resources are used. |
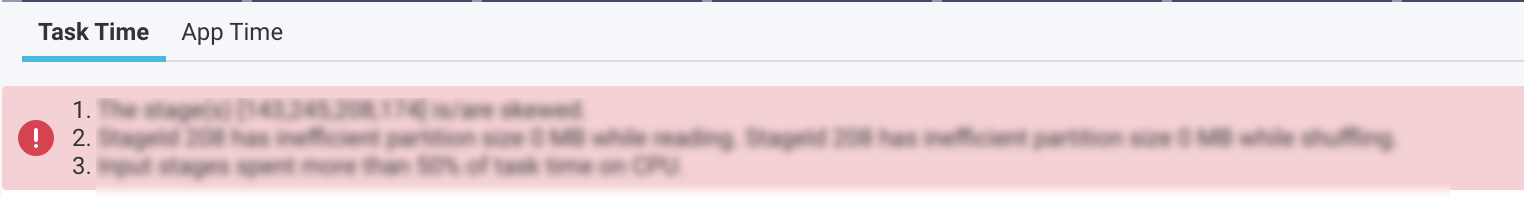
Hint section
An orange bar on the top provides various hints regarding the application.
Top Stages
In addition to the above metrics, at the bottom, there is a section called Top Stages. Here the top three stages are listed that contribute the most to the stage types.
Click the link of a Top stage to view the stage-level details of the metrics. The metrics are the same as a stage type, only the values belong to a specific stage.