Kafka APM
The Kafka APM provides multi-cluster support for monitoring:
Multi-cluster metrics monitoring.
Multi-cluster consumer offset/lag monitoring.
See Kafka Insights for a Use Case example of drilling down into lagging or stalled Consumer Groups.
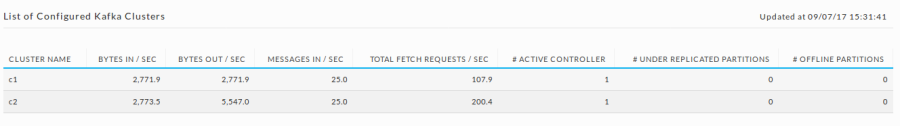
Operations > Usage Details > Kafka displays the List of Configured Kafka Clusters.
Click the Cluster Name to bring up the Cluster View.
 |
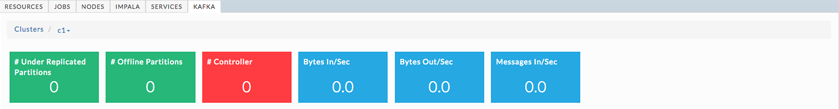
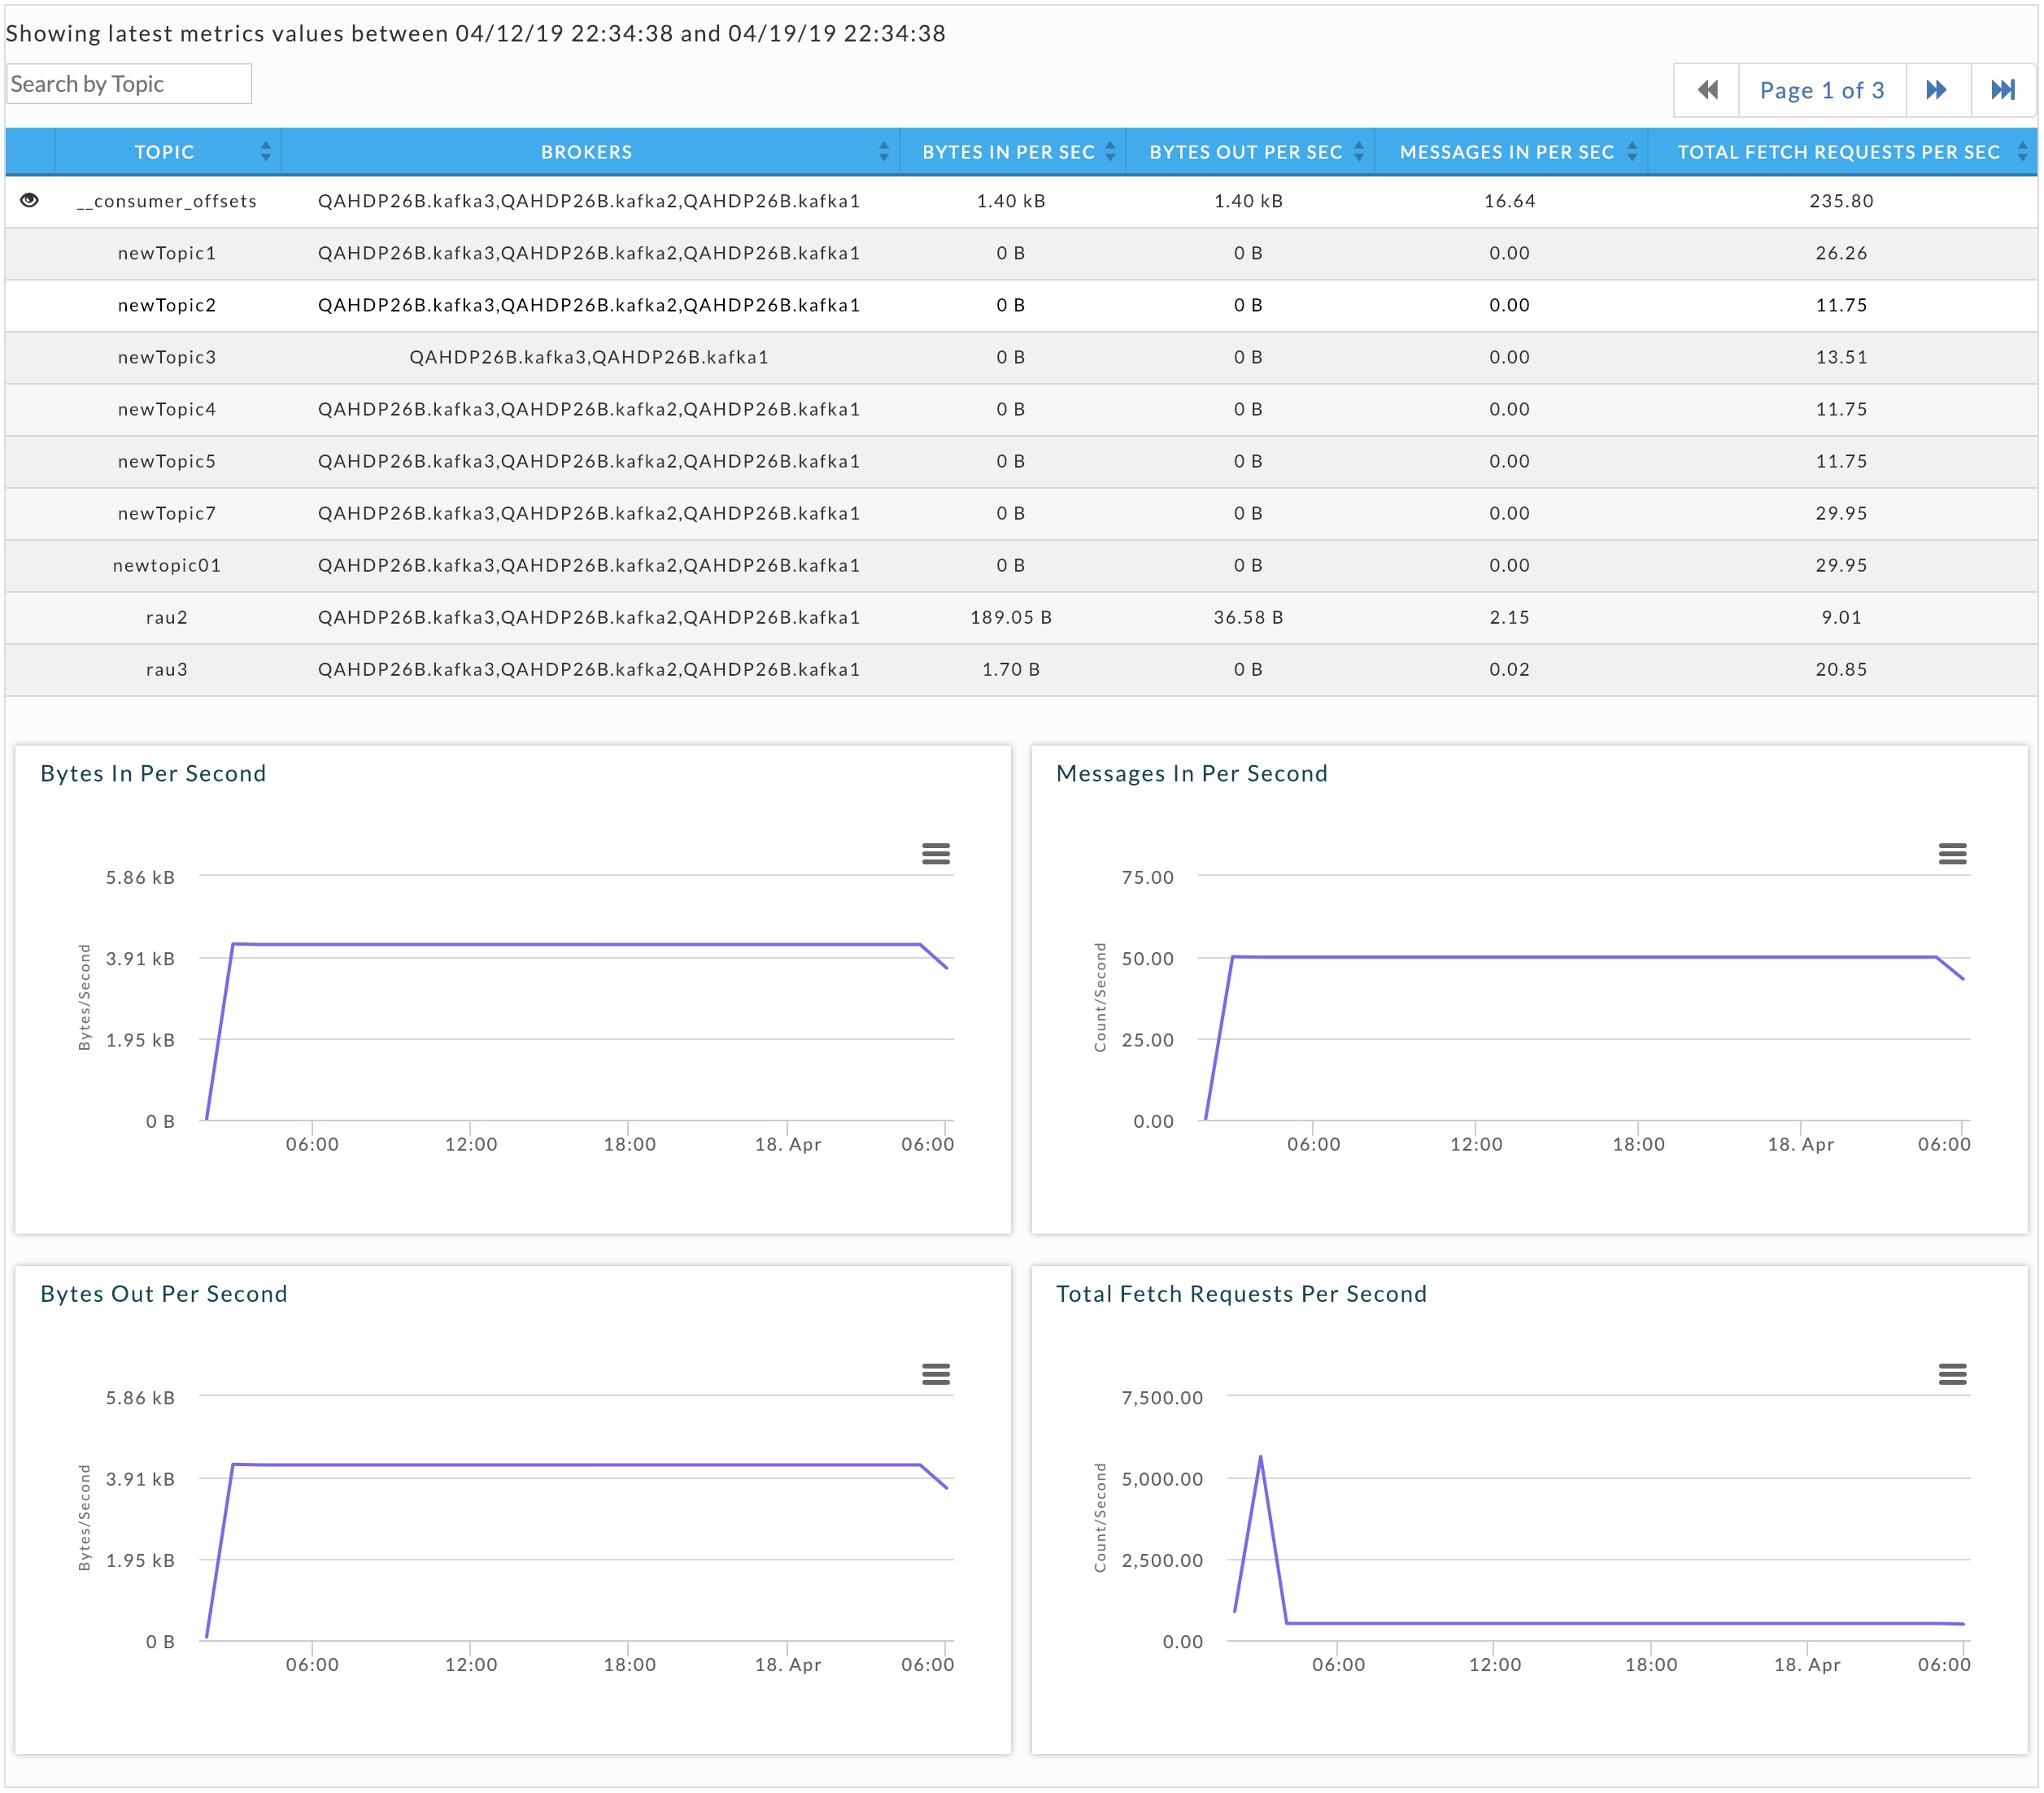
Cluster view
This window has three sections:
Key performance indicators
Metric graphs
Table of Kafka topics
Key performance indicators
# Under Replicated Partitions
# Offline Partitions
# Controller
Bytes In/sec
Bytes Out/sec
Messages in/sec
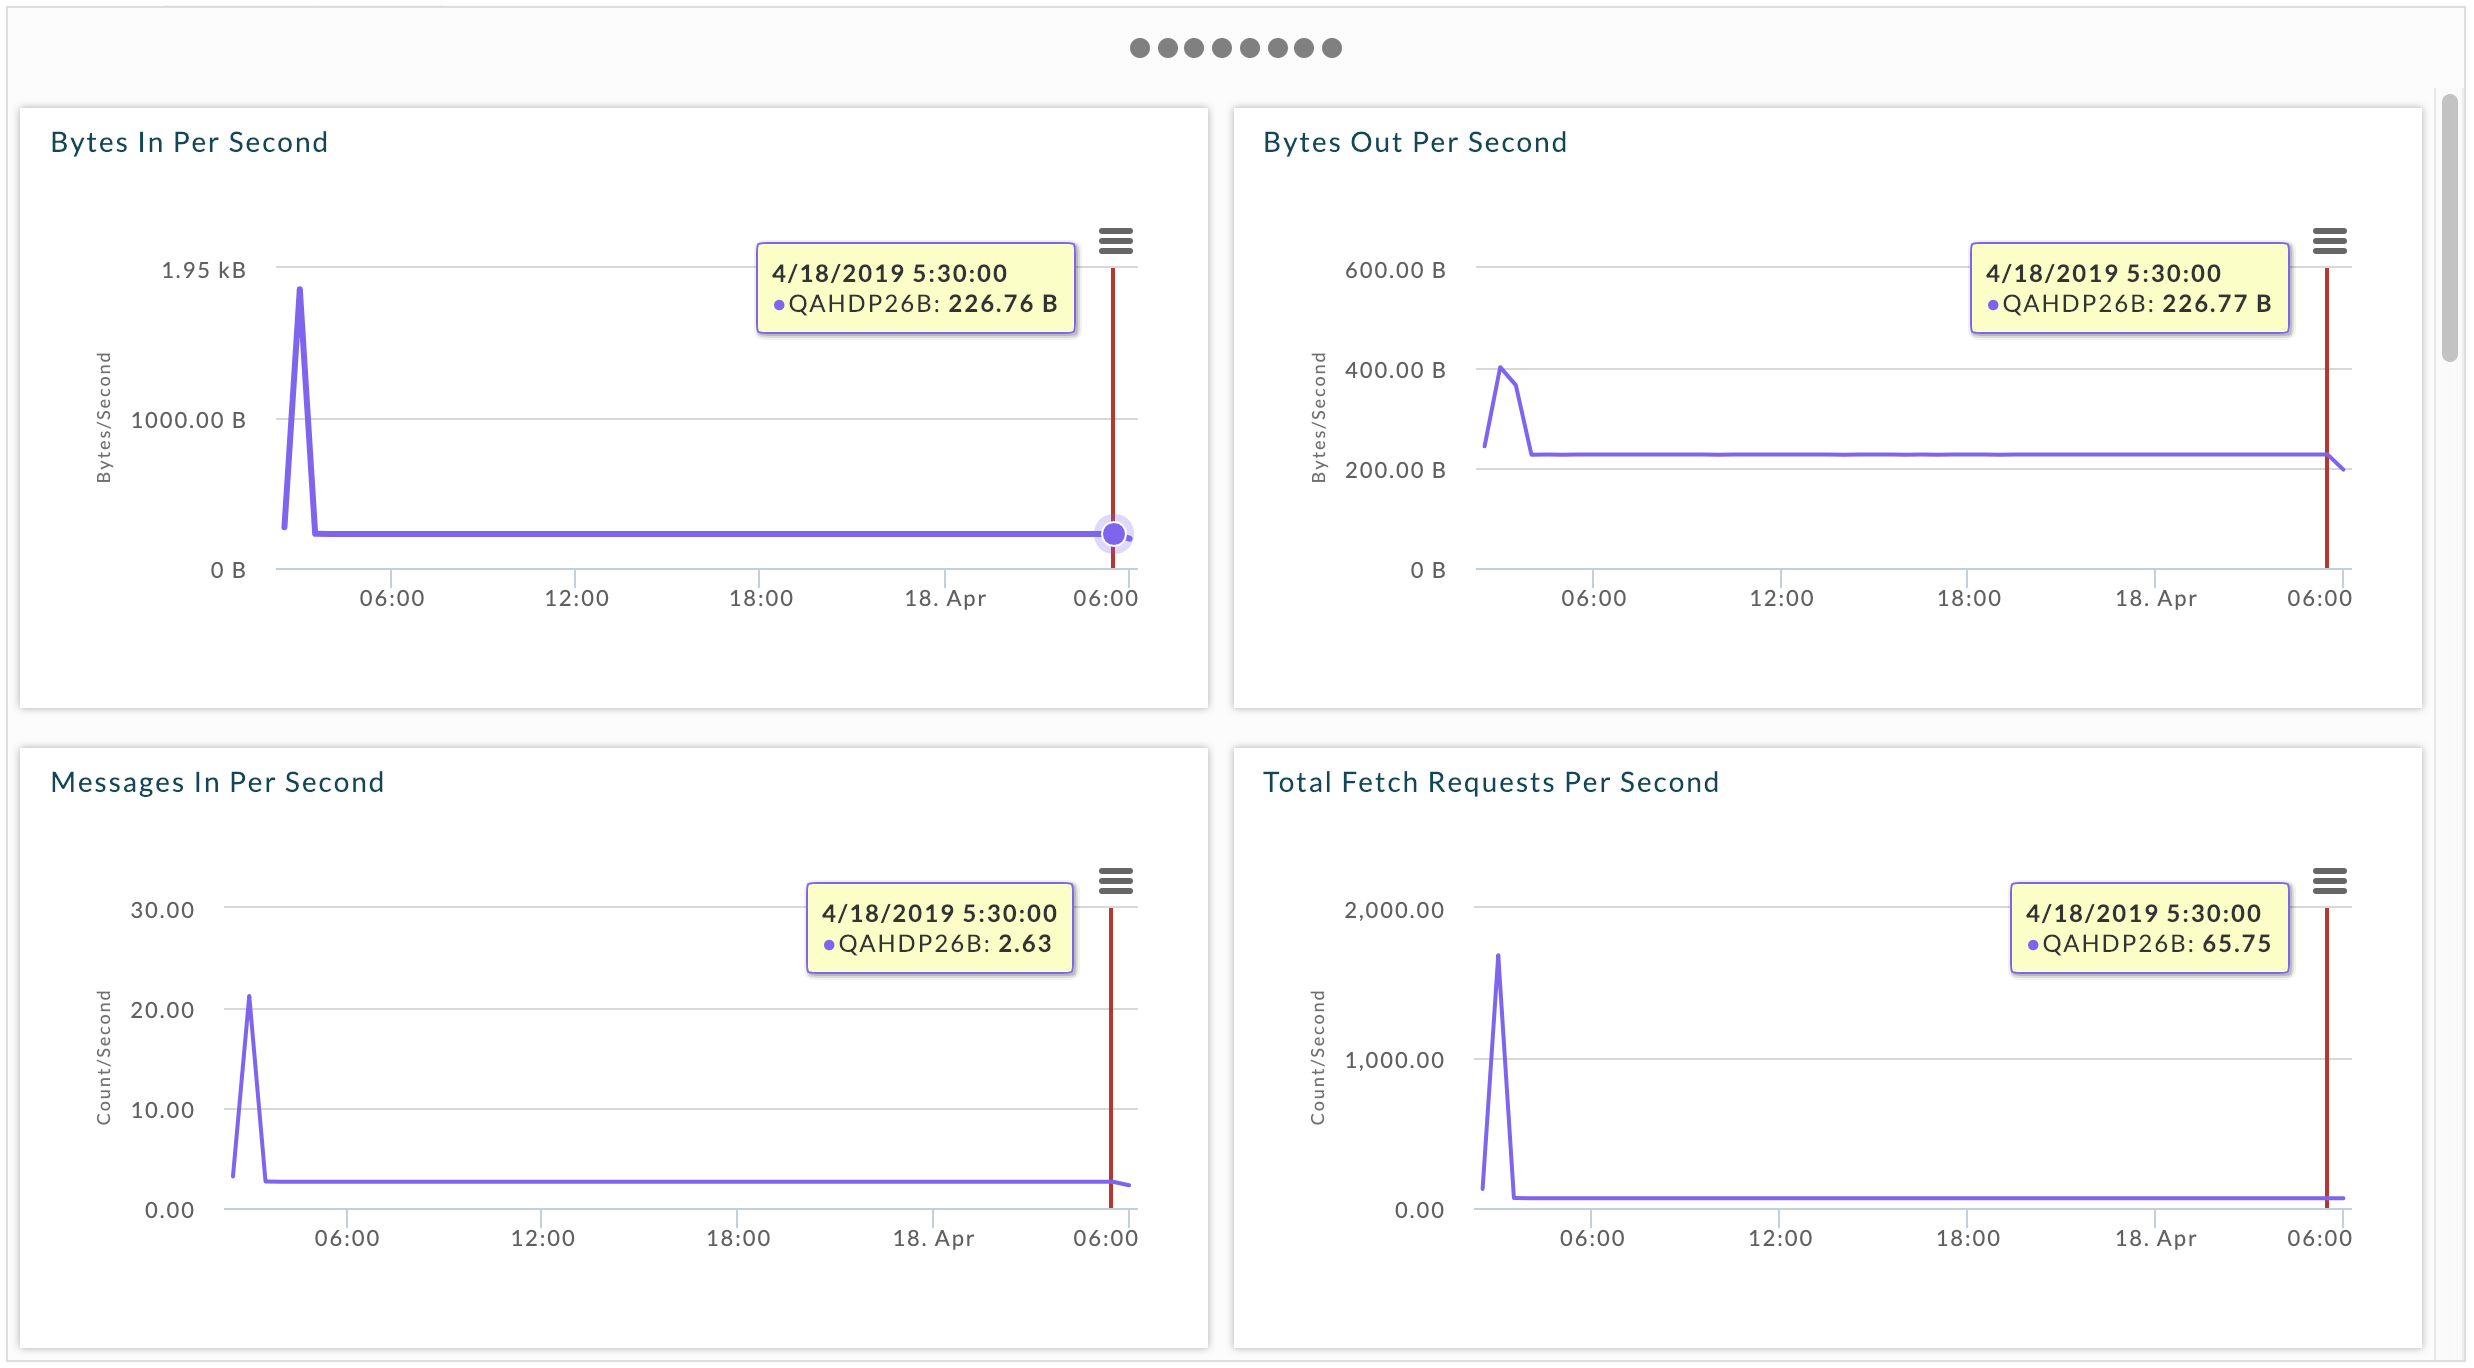
Metrics
This section has three tabs:
Metrics: Graphs the metrics for the data across the entire cluster.
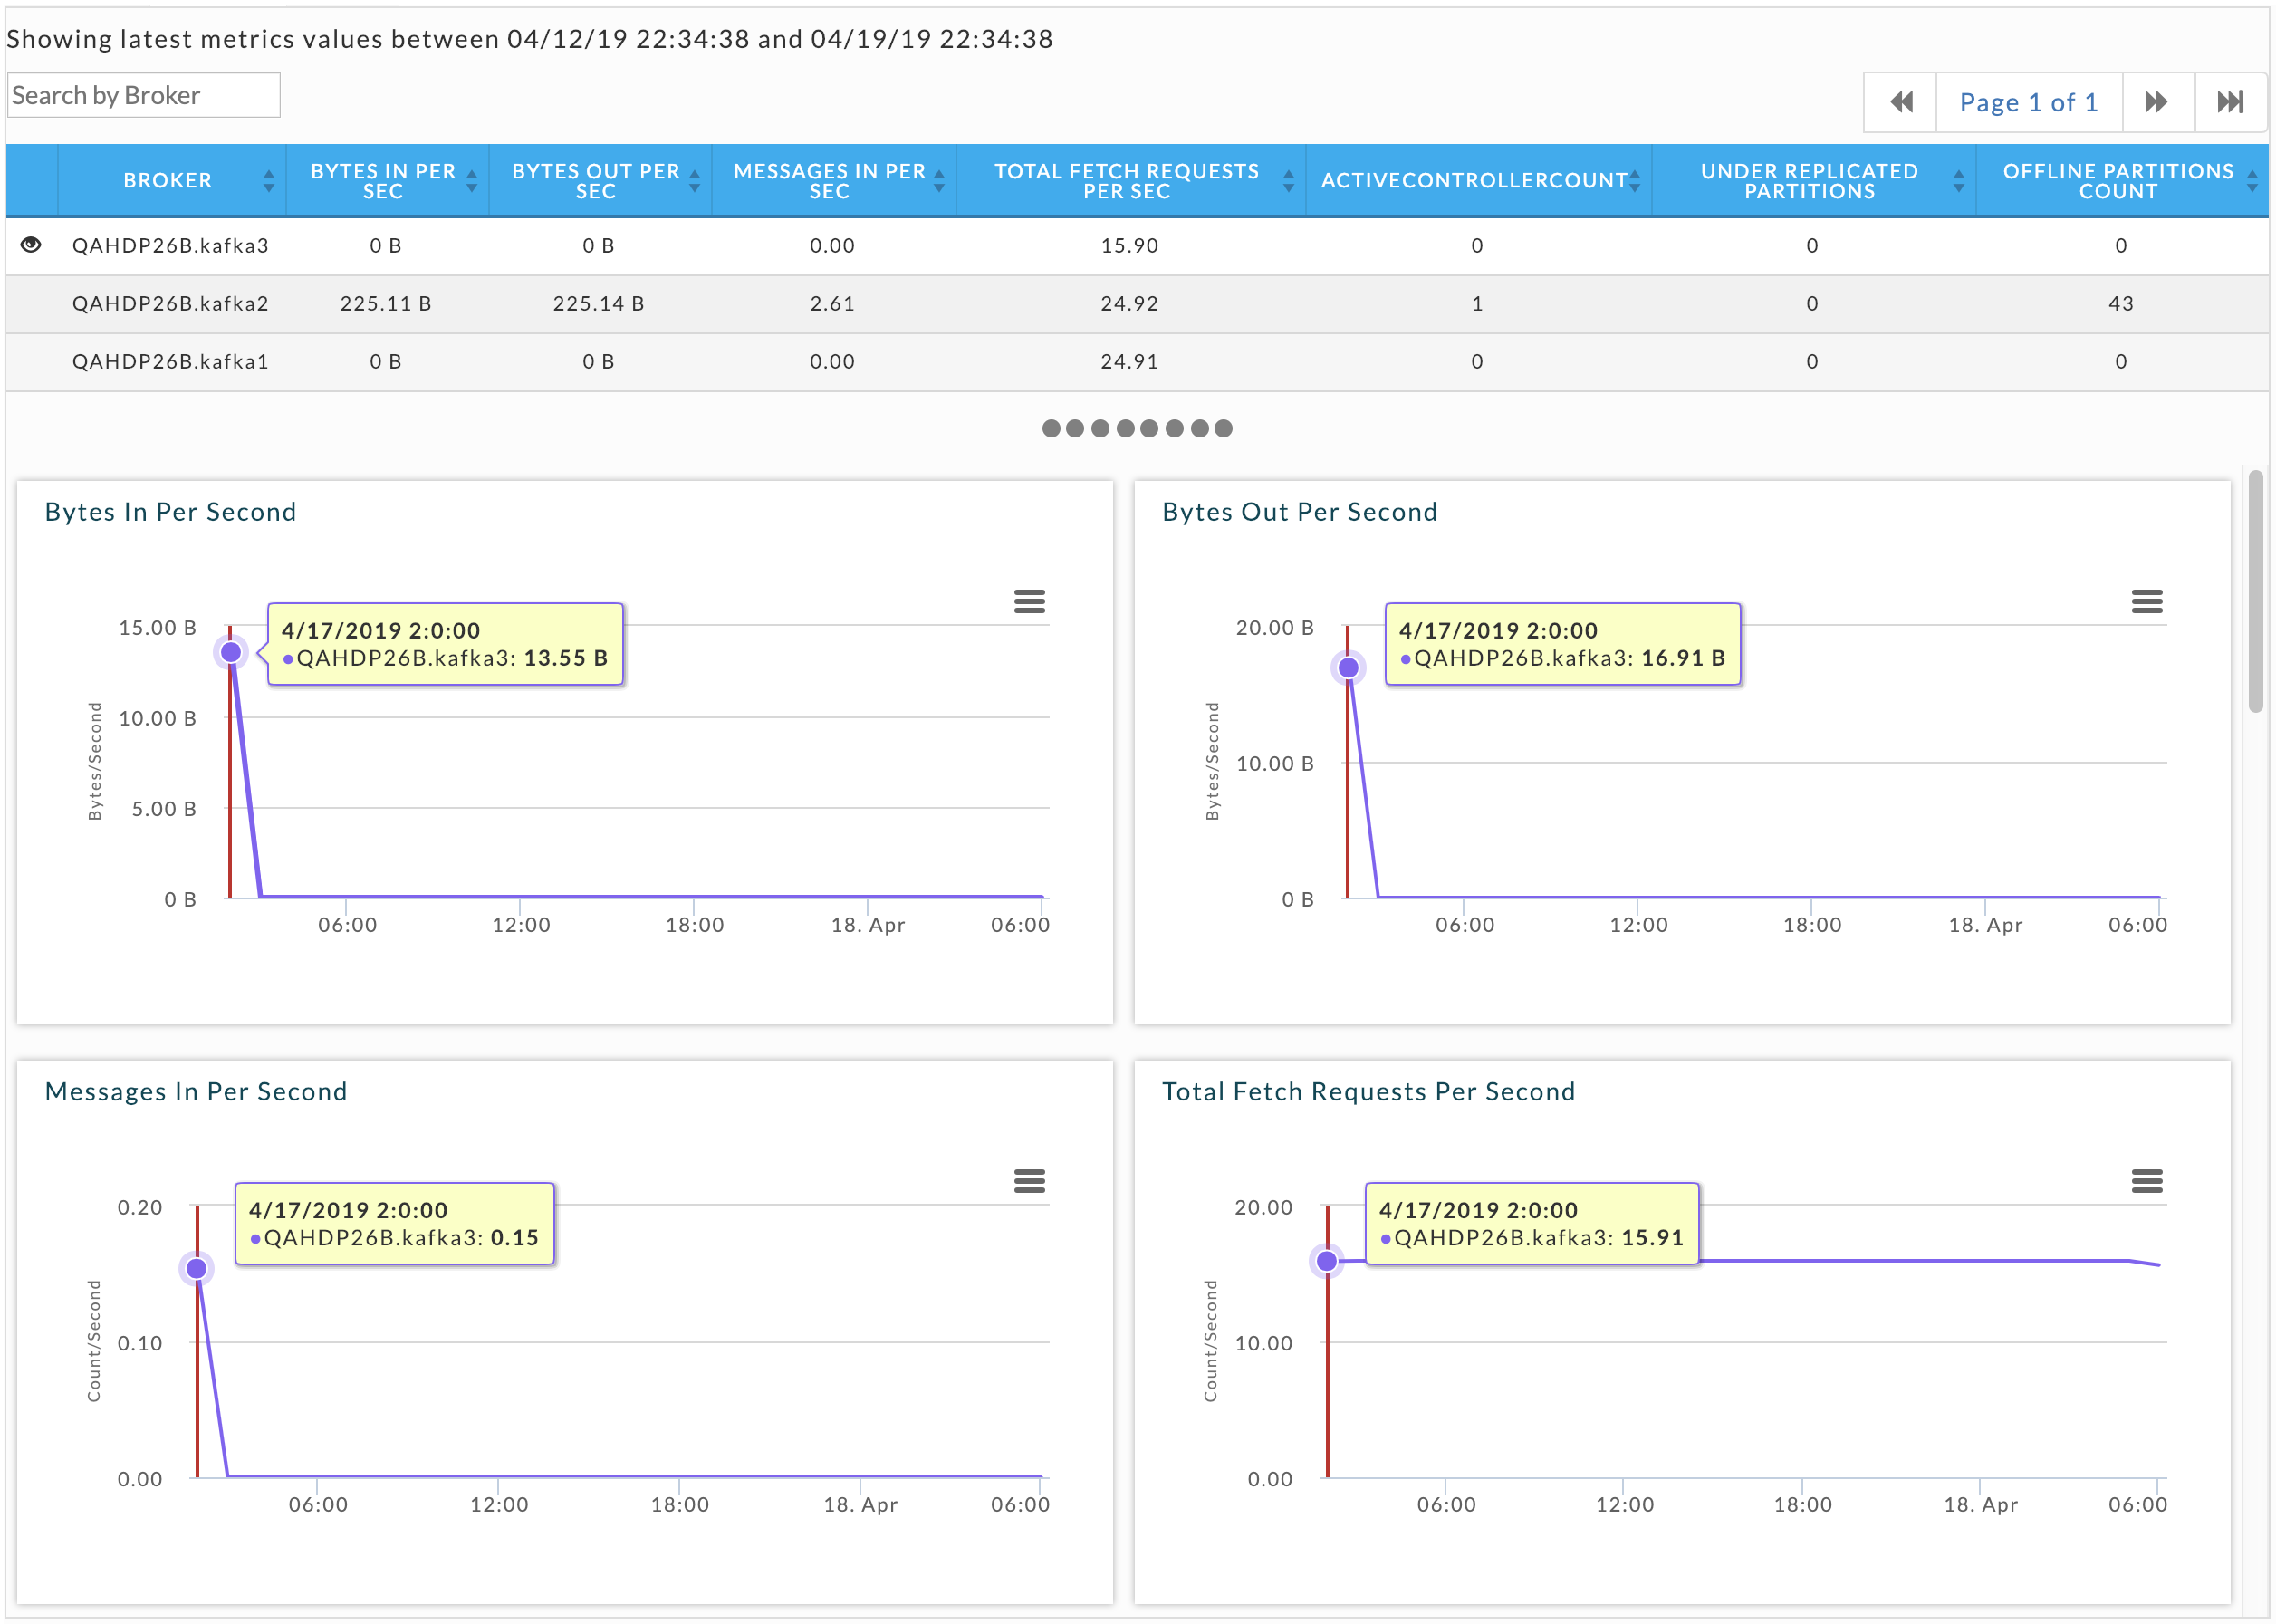
Broker: Graphs the metric for the data of the broker you select from the broker list.
Topic: Graphs the metric data for a specific topic you select from the topic list.
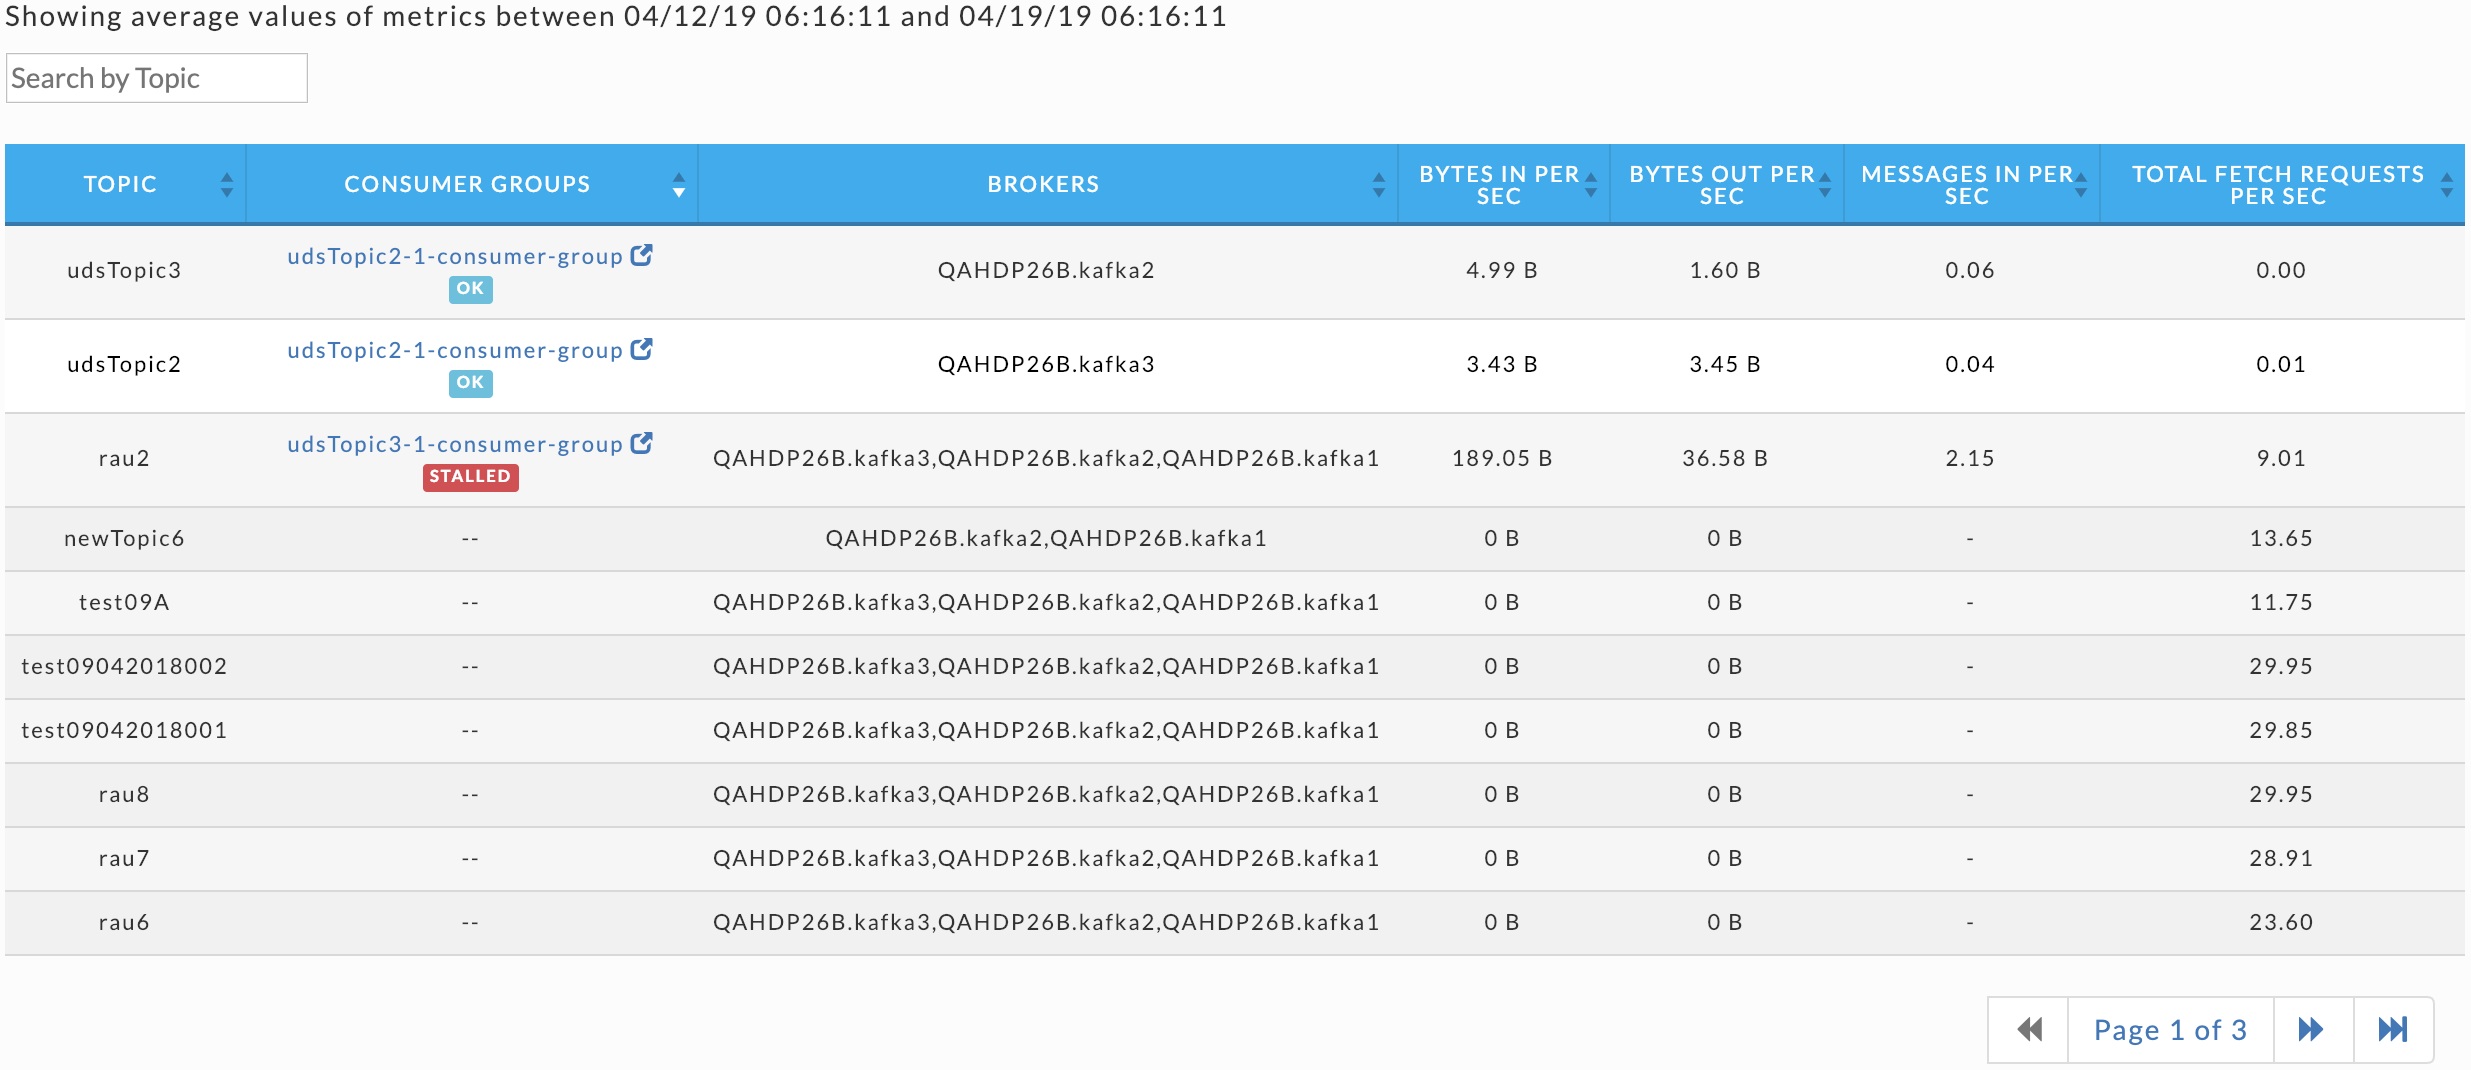
Metrics
Kafka topics list consumed by a consumer group (CG) with relevant KPIs.
Click the topic to bring up the Topic view and the consumer to bring up the Consumer group view. By default it is sorted on Topic name, this table is sorted on Consumer Groups in order to see the active consumer groups. The Consumer Groups status is clearly indicated below it. See Kafka Insights for a Use Case example of locating of lagging or stalled Consumer Groups.
Consumer group page
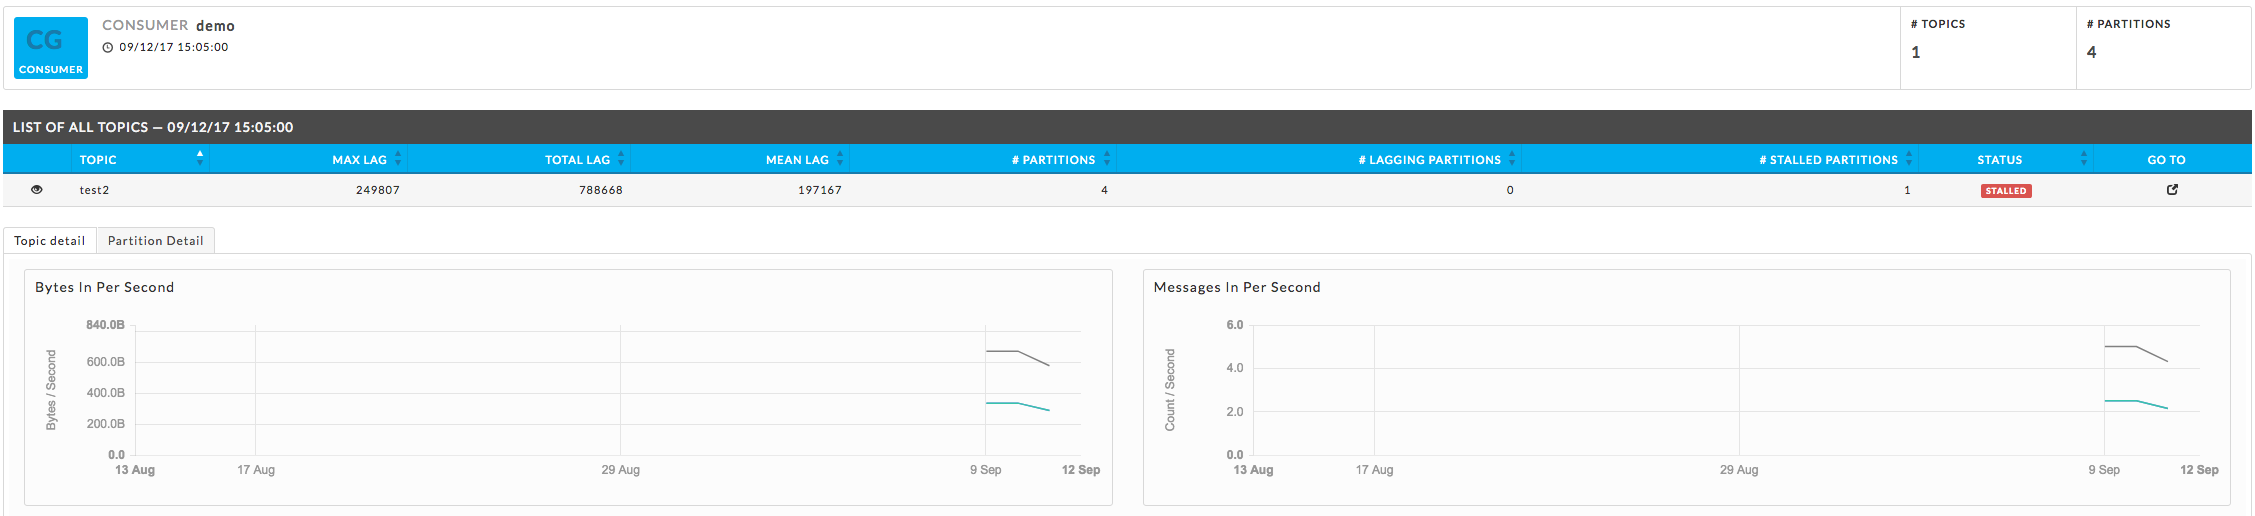
Key Performance Indicators
Number of Topics
Number of Partitions
The Topic list displays the KPIs; when details are available a more info icon is displayed. Click it to bring up the Kafka view for the topic. Below the list are two tabs that display graphs of the Topic and Partition details. By default, the window opens with the Topic Detail graph displayed.
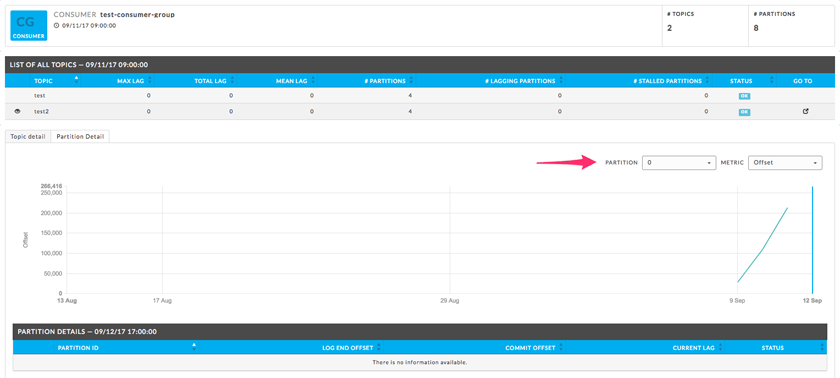
Partition Tab
You can choose both the Partition and the Metric for the display. By default, the 0th partition is displayed using the metric offset. The Partition Details' list is populated if the details are available.
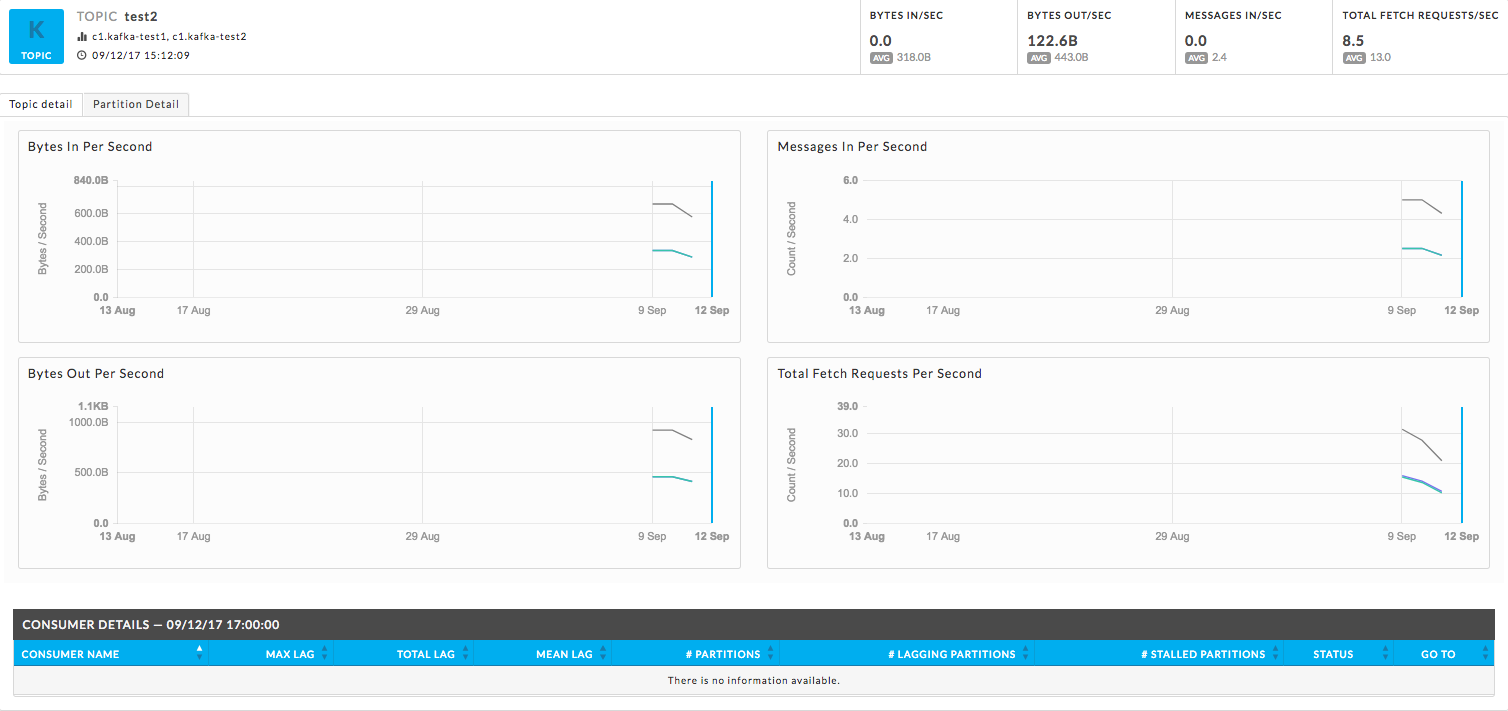
Topic page
The Kafka View has two tabs, Topic Detail and Partition Detail. Each view has a Consumer Details' list which is populated if the details are available.
Kafka Topic Detail
By default, the Kafka Topic Detail opens in the Topic Detail view which graphs the KPIs. The KPIs in the title bar, present
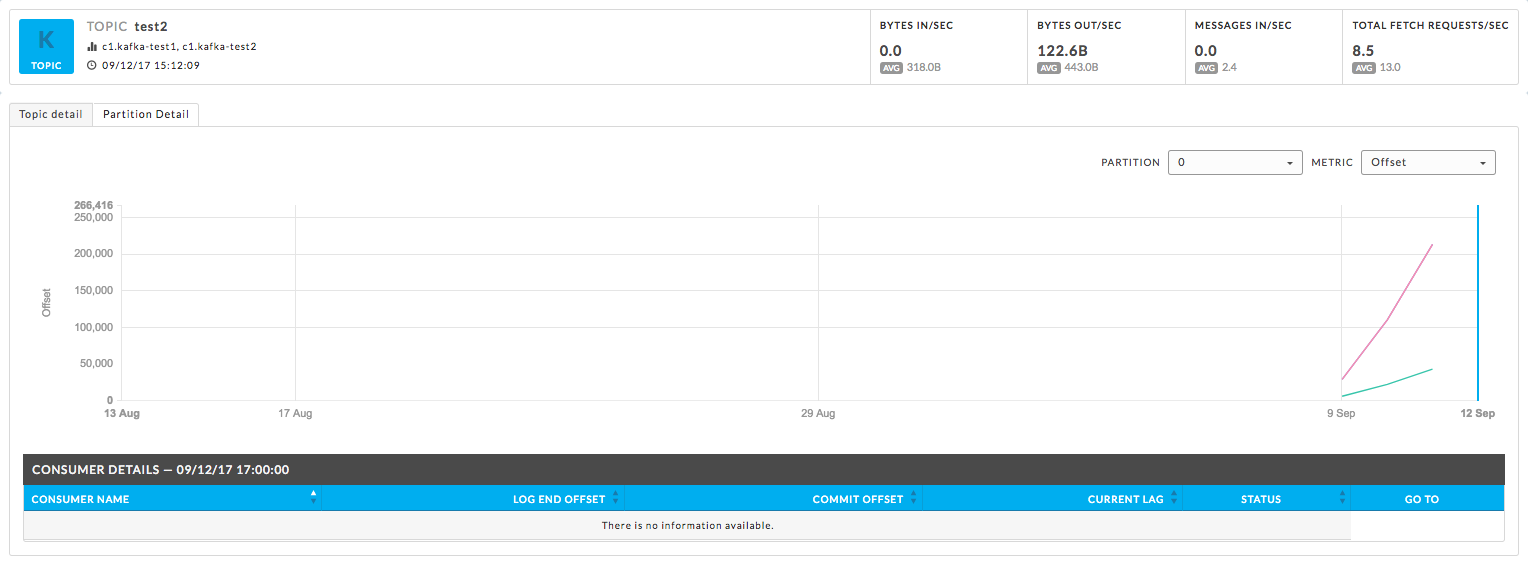
Kafka Partition Detail
You can choose both the Partition and the Metric for the display. By default, the 0th partition will be displayed on using the metric offset.
Unravel insights for Kafka
Unravel provides auto-detection of lagging/stalled Consumer Groups. It lets you drill down into your cluster and determine which consumers, topics, partitions are lagging or stalled. See Kafka Insights for a use case example of drilling down into lagging or stalled Consumer Groups.
Unravel determines Consumer status by evaluating the consumer's behavior over a sliding window. For example, we use an average lag trend for 10 intervals (of 5 minutes duration each), covering a 50-minute period. Consumer Status is evaluated on several factors during the window for each partition it is consuming.
For a topic partition Consumer status is:
Stalled: If the Consumer commit offset for the topic partition is not increasing and lag is greater than zero.
Lagging: If the Consumer lag for the topic partition is increasing consistently, and an increase in lag from the start of the window to the last value is greater than lag threshold (e.g., 250).
The information is distilled down into a status for each partition, and then into a single status for the consumer. A consumer is either in one of the following states:
OK: The consumer is working and is current.
Warning: The consumer is working, but falling behind.
Error: The consumer has stopped or stalled.