Hive APM
The Hive APM provides a detailed view into the behavior of Hive queries. Typical users are Hadoop DBAs or app owners (engineers, BI team, analysts). You can use this view to:
Resolve inefficiencies, bottlenecks and reasons for failure within apps.
By default, the Hive APM opens displaying the Navigation and Query tabs.
Note
For Hive queries that don't run using a Tez, LLAP, MapReduce, or Spark app, the duration shown by Unravel may be inaccurate because Hive doesn't call the Hive pre and post hooks correctly for these queries.
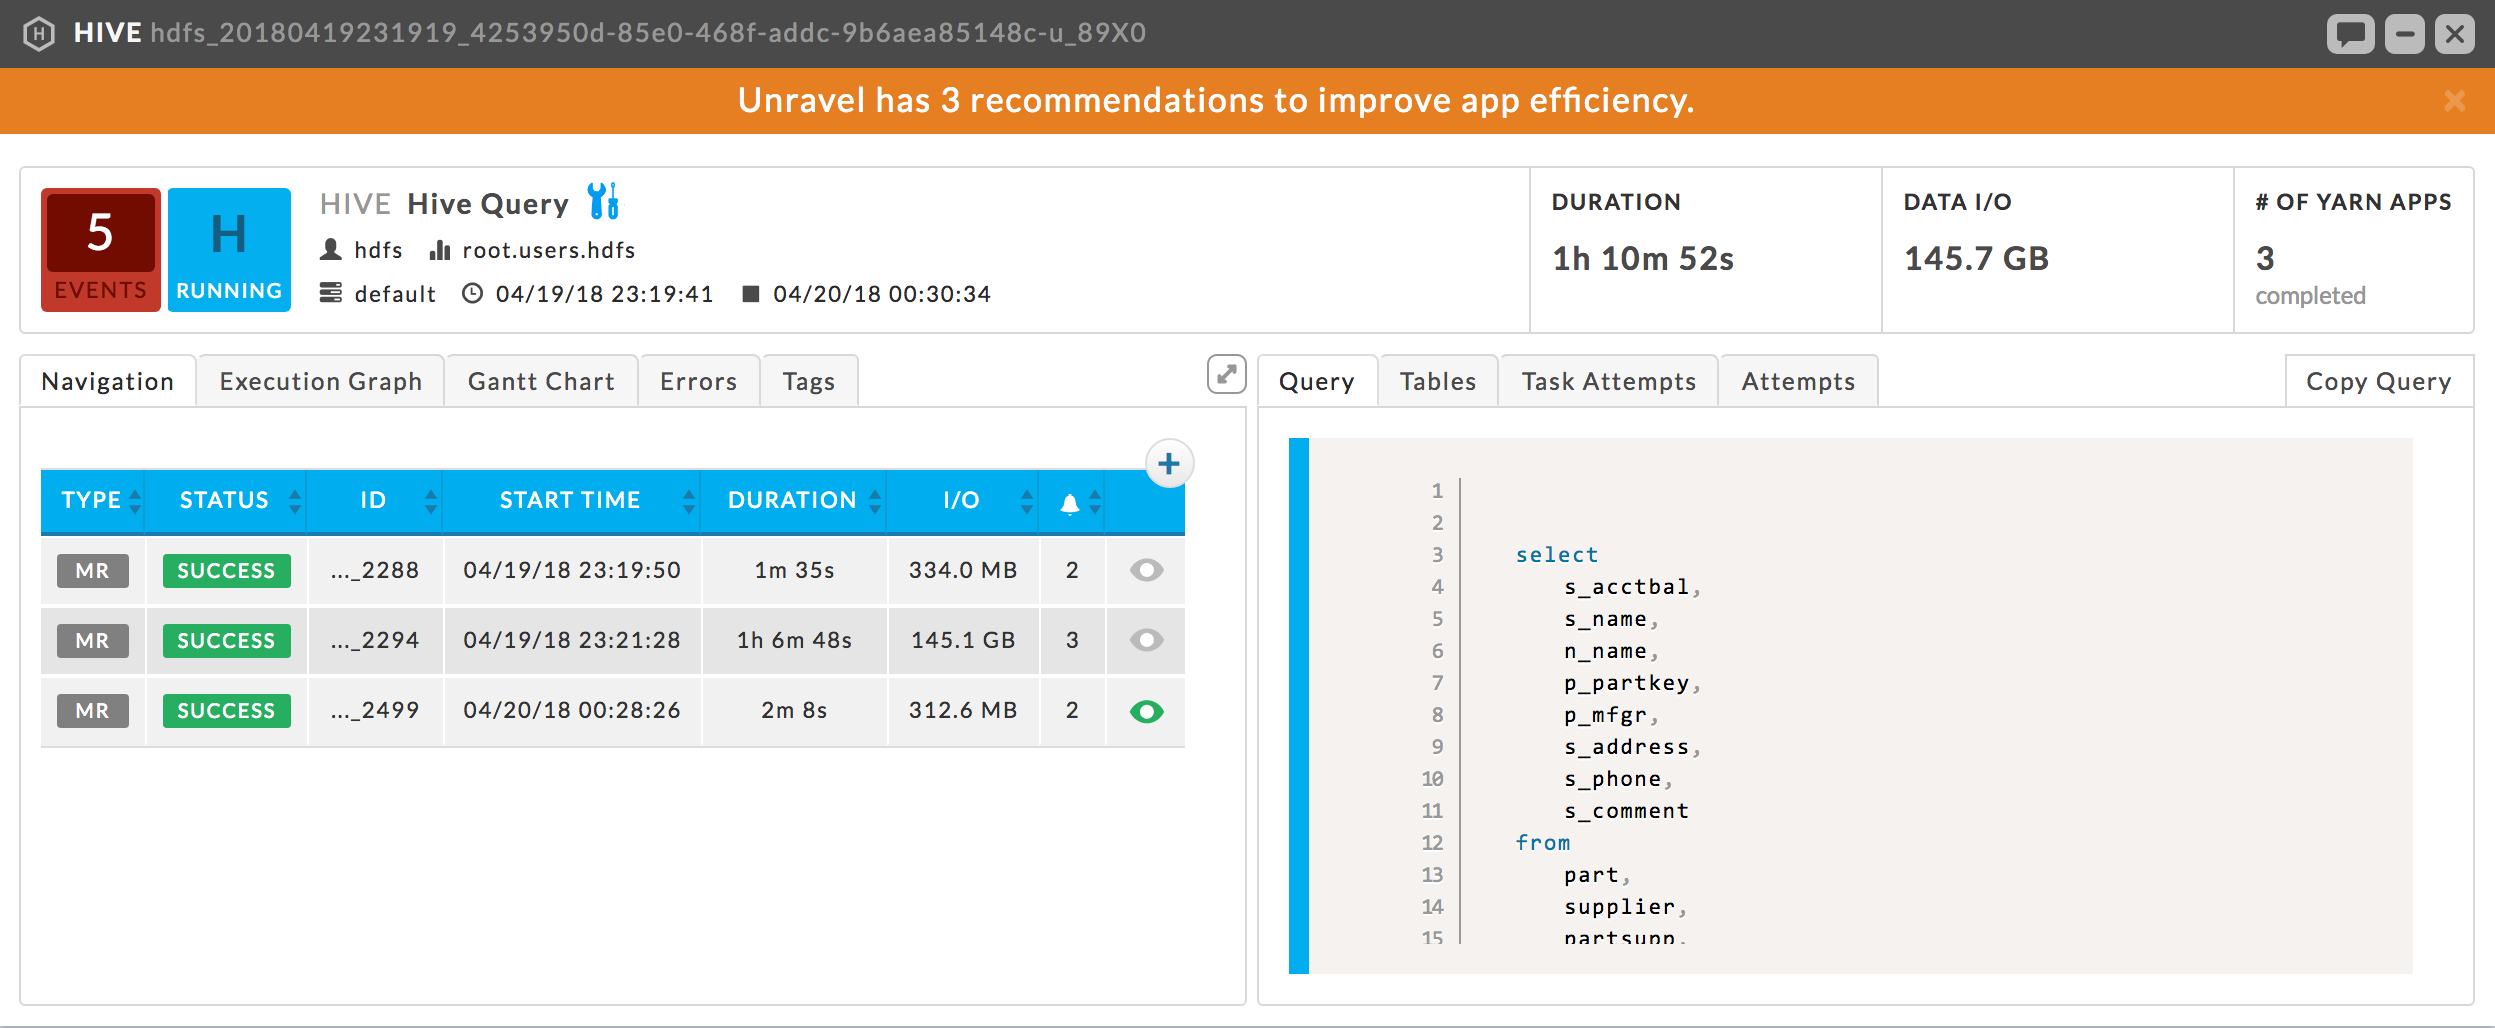
Key performance indicators
Events: The number, if any, of Unravel insights for this query. See Event Panel & Insights for more information.
Duration: Total time taken by the app to complete execution.
Data I/O: Total data read and written by the app.
Number of YARN apps: The number of YARN apps making up the query.
Left tabs
Navigation: List all the MapReduce jobs associate with the query. Click the job name to bring up job in the MapReduce Application Manager tile.
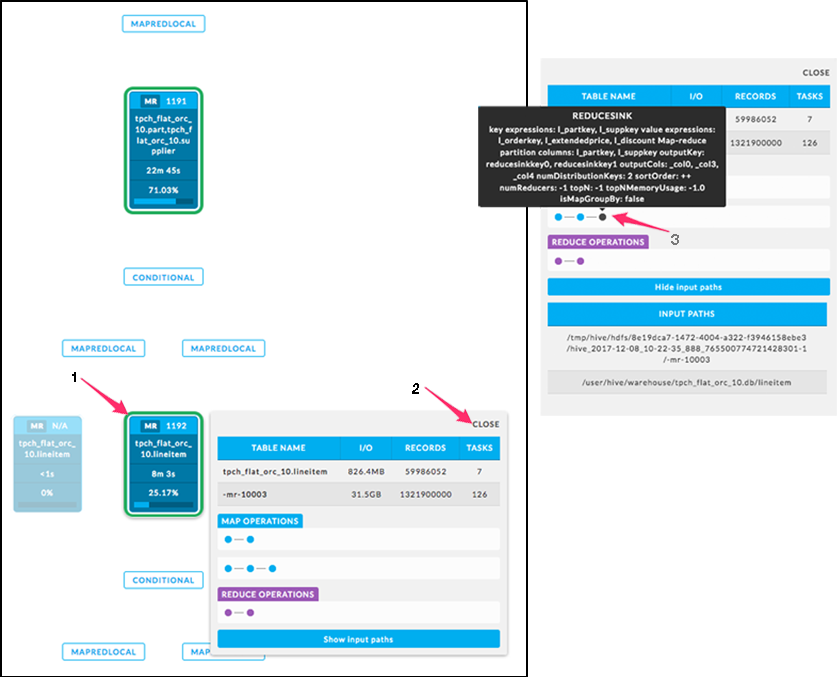
Execution Graph: Shows detailed information about the MapReduce jobs and their relationship to one another.
 This view helps identify bottlenecks and inefficiencies.
The graph provides a quick and intuitive way to understand the MapReduce jobs. Upon opening the tab you immediately see the MR jobs (1) in relation to each other and limited job info: tables used, the job length in absolute and relative value to the whole.
Clicking on the job brings up a box with more Table KPIs, a forward path for the Map and Reduce operations, and input paths (should you want to show them). Click a table name to bring up its details. See Reports > Data Insights > Details for description of the tables. Click Close (2) or scroll within the tab to close the box.
Click a path point (3) drill deeper. The resulting text box notes the operation type (MapJoin, ReduceSink, etc.), and various key information about the operation. The information displayed is specific to that operation at that time.
Gantt Chart: Shows job sequencing using a Gantt chart.
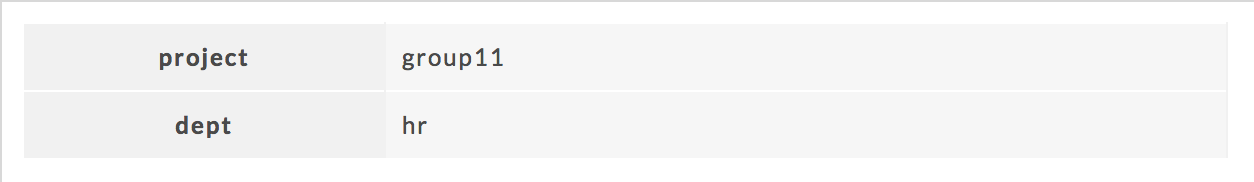
Tags: The defined tag keys and values for the app. This example has two tag keys, project and dept , with each having one value, group11 and hr , respectively.
Right tabs
Query: Shows the Hive query. See the Hive APM window above for an example Query tab. Click the Copy Query to copy it to the clipboard.
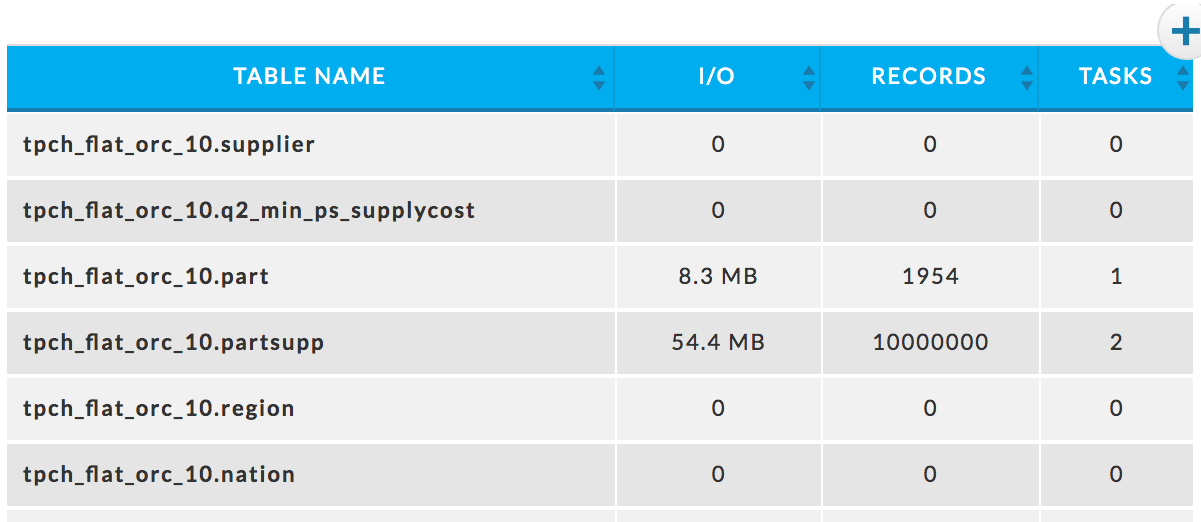
Tables: A list of tables accessed by the app.
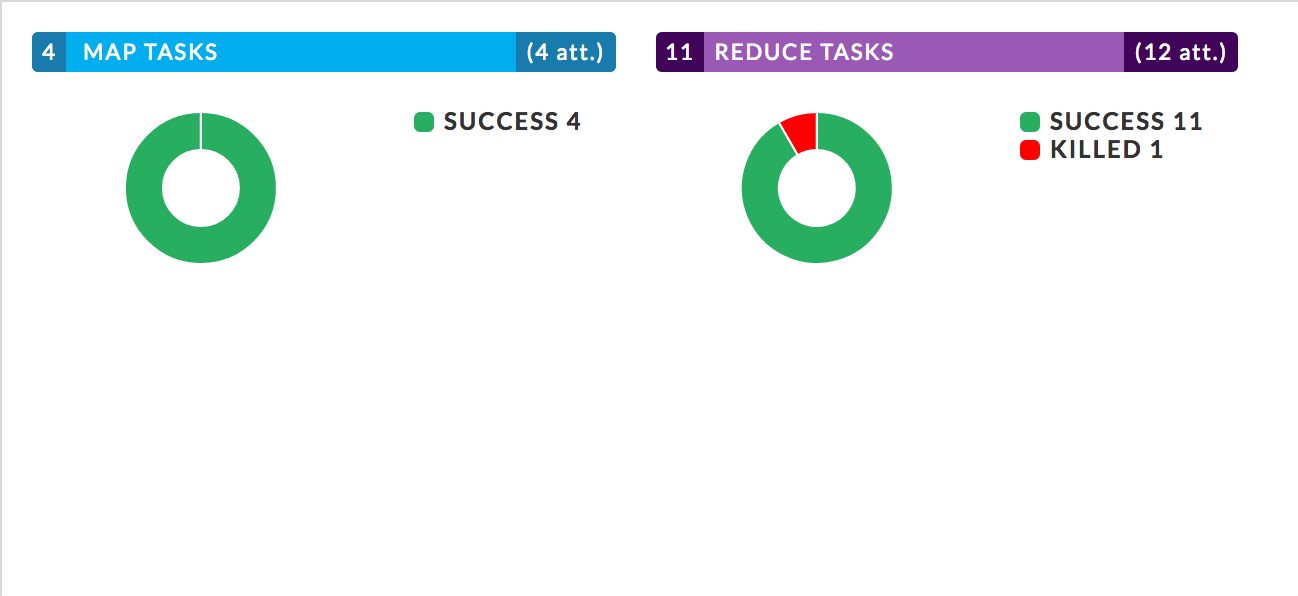
Task Attempts: Displays MapReduce task attempts by success, failed, and killed status. The data displayed is for the entire Hive job. To see the details for a specific MapReduce task click on the job in the Navigation tab.
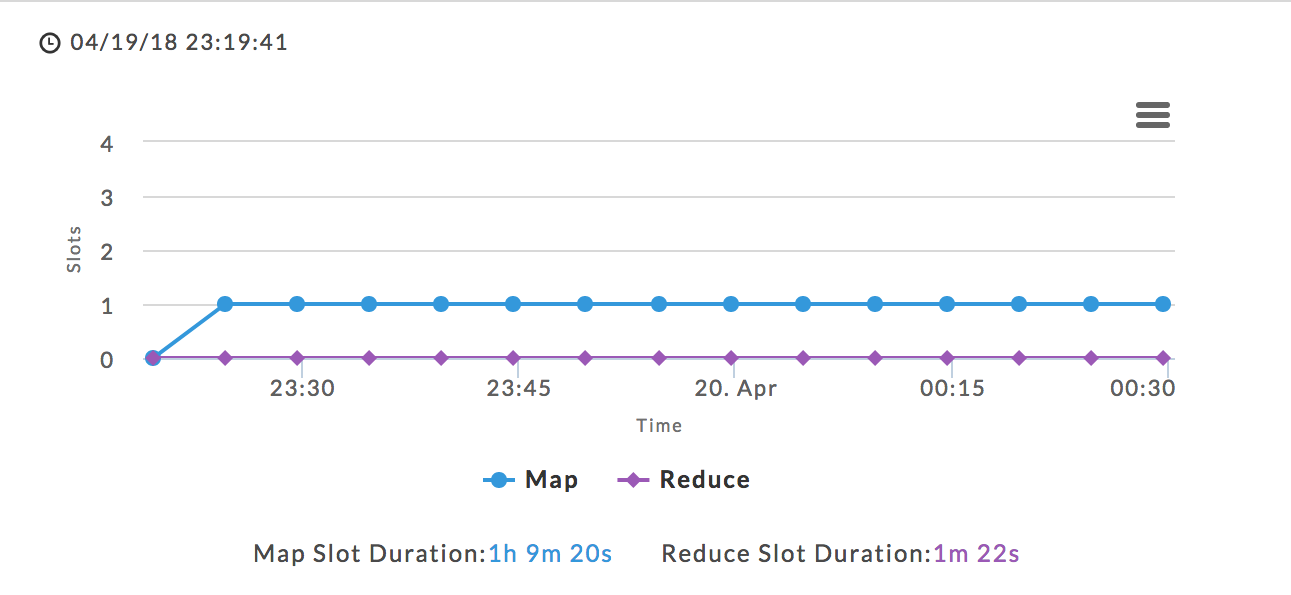
Attempts: Graphs the map and reduce task slot usage over the duration of the job. The wall clock time the job started is listed in the upper left-hand corner. The total map and reduce slot duration times are listed beneath the graph.
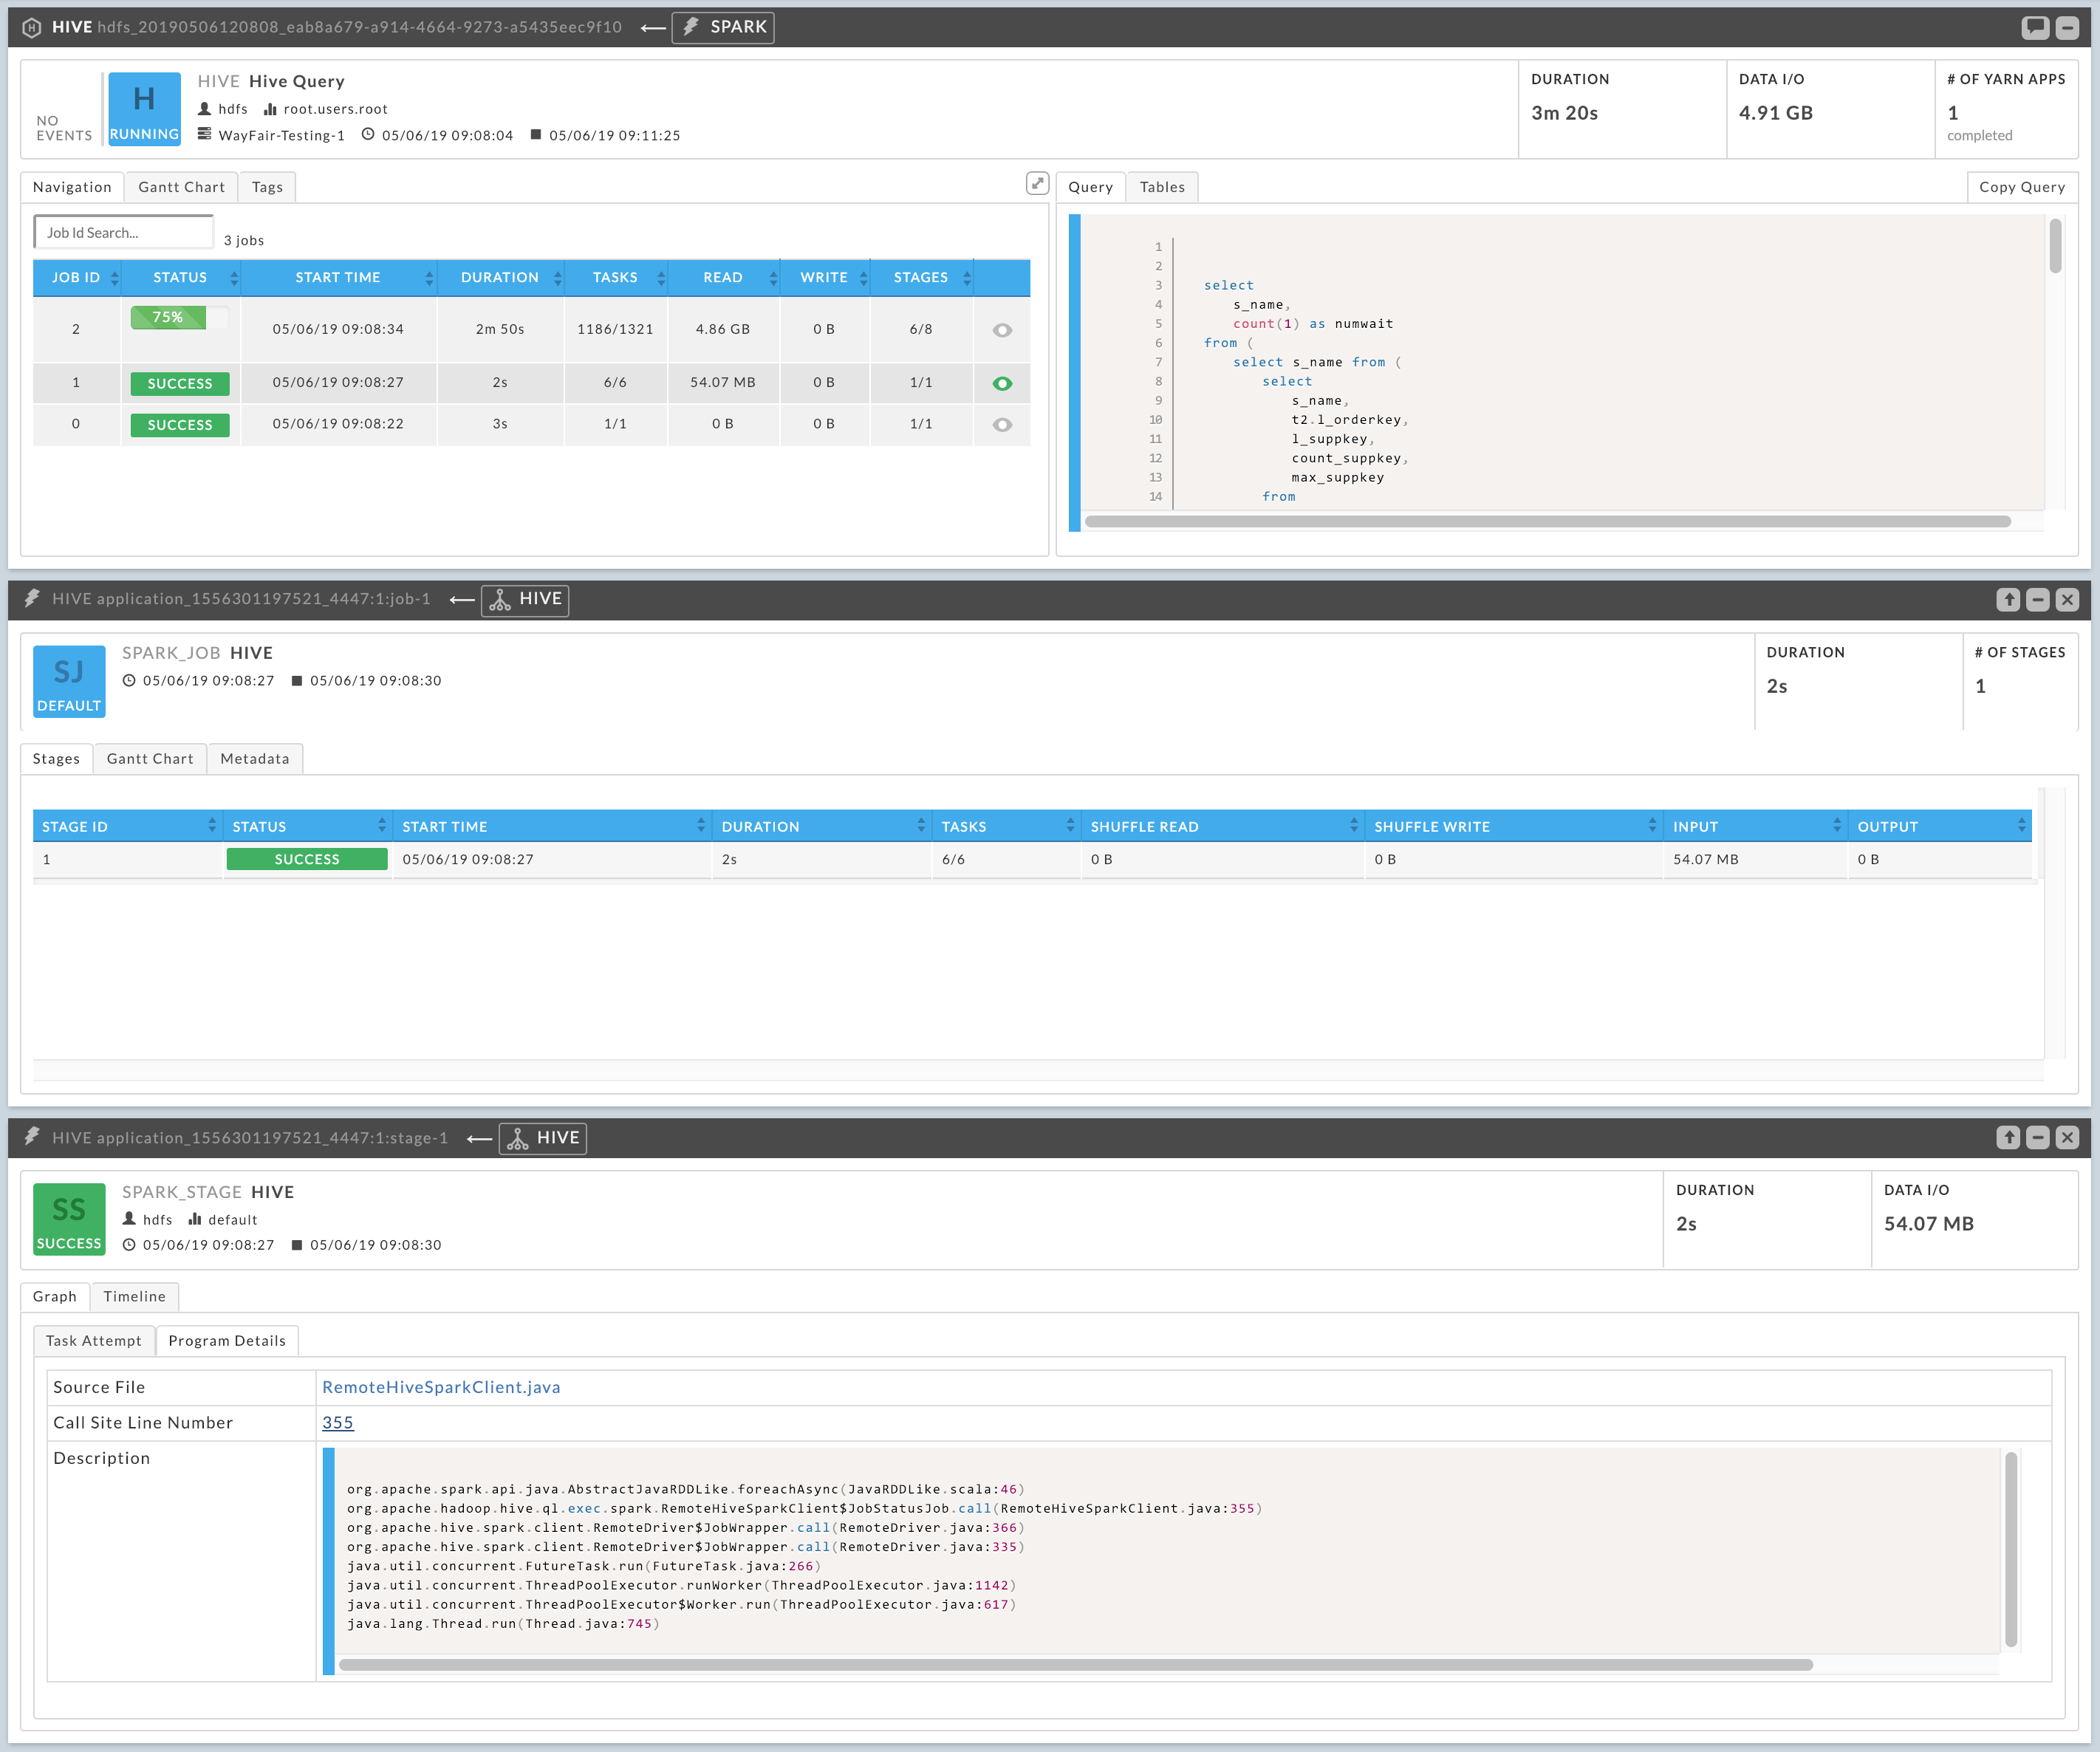
Hive-on-Spark
For Hive-on-Spark jobs the Hive APM shows the details of the Spark app. Like the Spark APM, the running and completed Spark Jobs are listed in the Navigation tab. The progress of a running Job is displayed. In this example, Job 2 is 75% complete. Clicking on the job brings up the Spark Job information in a new tile, and from there you can drill down into the Job's Stages. See the Spark APM for more information.