End-to-end monitoring of HBase databases and clusters
Running real-time data injection and multiple concurrent workloads on HBase clusters in production are always challenging. There are multiple factors that affect a cluster's performance or health and dealing with them isn't easy. Timely, up-to-date and detailed data is crucial to locating and fixing issues to maintain a cluster's health and performance.
Most cluster managers provide high level metrics, which while helpful, aren't enough for understanding cluster and performance issues. Unravel provides detailed data and metrics to help you identify the root causes of cluster and performance issues specifically hot-spotting. This tutorial examines how you can use Unravel's HBase's (APM) to debug issues in your HBase cluster and improve its performance.
Cluster health
Unravel provides cluster metrics per cluster which provide an overview of HBase clusters in the Operations > Usage Details > HBase tab where all the HBase clusters are listed. Click a cluster name to bring up the cluster's detailed information.
The metrics are color coded so you can quickly ascertain your cluster's health and what, if any, issues you need to drill into.
Green = Healthy
Red = Unhealthy, alert for metrics and investigation required
In this case, we examine the HBase metrics and to help youunderstand how use them to monitor your HBase cluster through Unravel.
Overall cluster activity
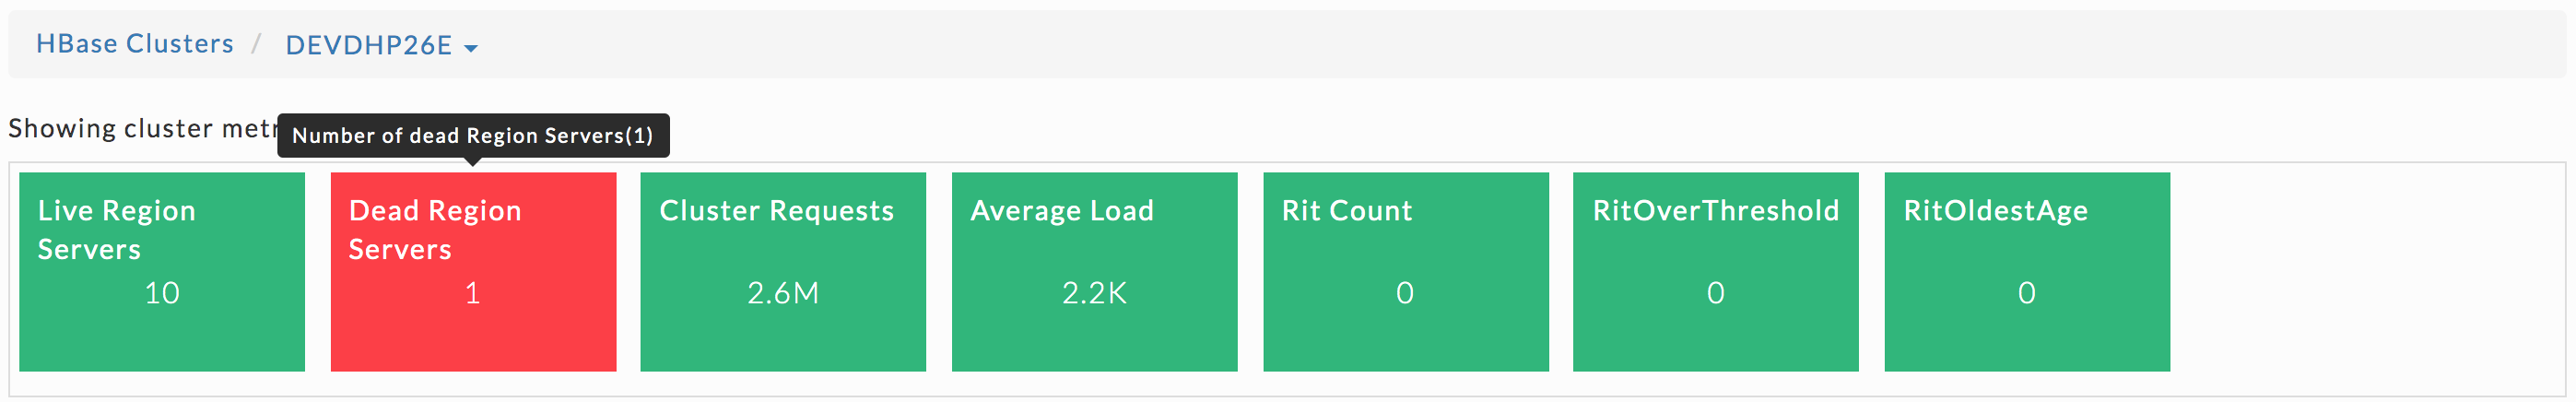
Live Region Servers: the number of running region servers.
Dead Region Servers: the number of dead region servers.
Cluster Requests: the number of read and write requests aggregated across the entire cluster.
Average Load: the average number of regions per region server across all Servers
Rit Count: the number of regions in transition.
RitOver Threshold: the number of regions that have been in transition longer than a threshold time (default: 60 seconds).
RitOldestAge: the age, in milliseconds, of the longest region in transition.
Note
Region Server refers to the servers (hosts) while region refers to the specific regions on the servers.
Dead Region Servers
This metric gives you insight into the health of the region servers. In a healthy cluster this should be zero. When the number of dead region servers is one or greater you know something is wrong in the cluster.
Dead region servers can cause an imbalance in the cluster. When the server has stopped its regions are then distributed across the running region servers. This consolidation means some region servers handle a larger number of regions and consequently have a corresponding higher number of read, write and store operations. This can result in some servers processing a huge number of operations and while others are idle, causing hot-spotting.
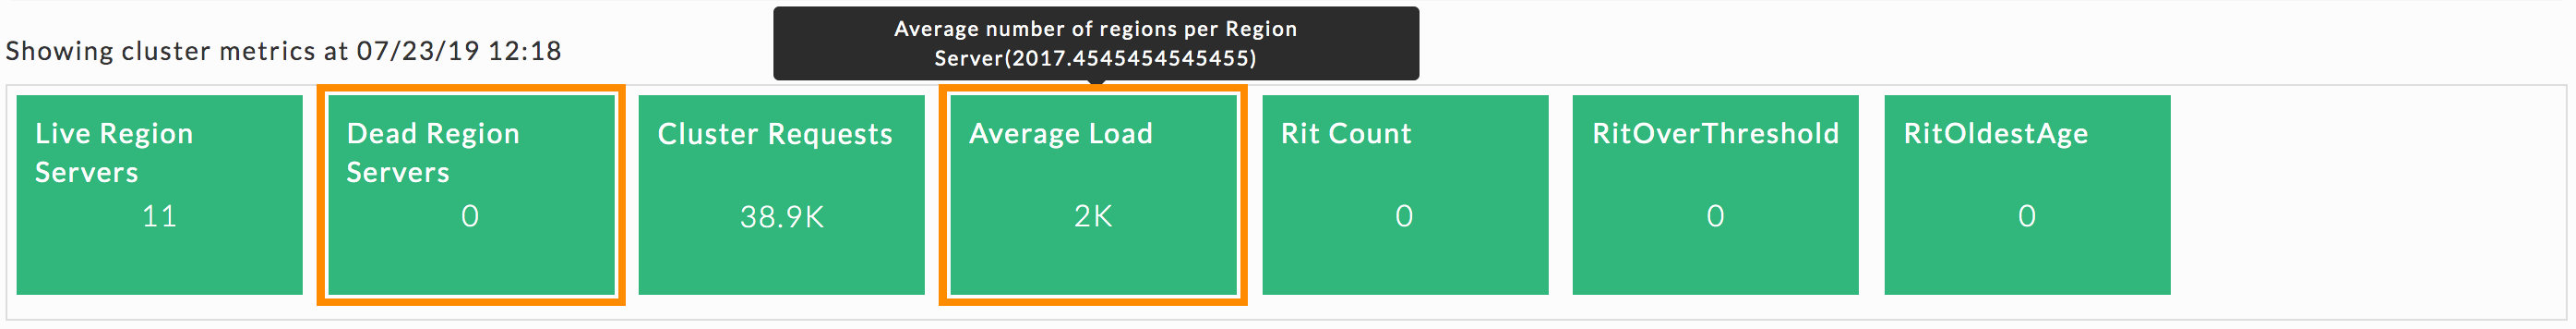
Average Load
This metric is the average number of regions on each region server. Like Dead Region Servers, this metric helps you to triage imbalances on cluster and optimize the cluster's performance.
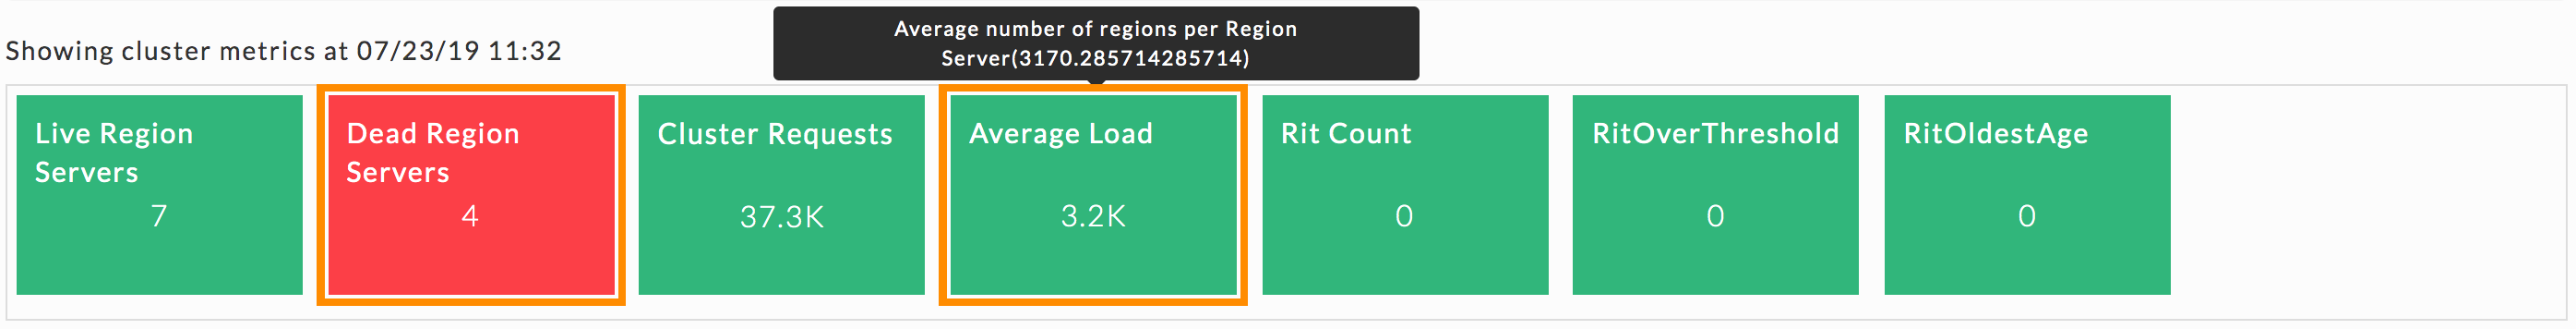
Below, for the same cluster, you can see the impact on the Average Load when Dead Region Servers is 0 and 4.
In this case, the Average Load is 2k.
As the number increased so did the corresponding Average Load which is now 3.23k, an increase of 60%,
The next section of the tab contains a region server table which shows the number of regions hosted by the region server. You can see the delta (Average Load - Region Count); a large delta generates an imbalance in cluster and reduces the cluster's performance. You can resolve this issue by either:
Moving the regions onto other region servers.
Removing regions from a current region server at which point the master immediately deploys it on another available region server.
Region server
Unravel provides a list of region servers, their metrics and Unravel's insight into server's health for all region servers across the cluster for a specific point of time.
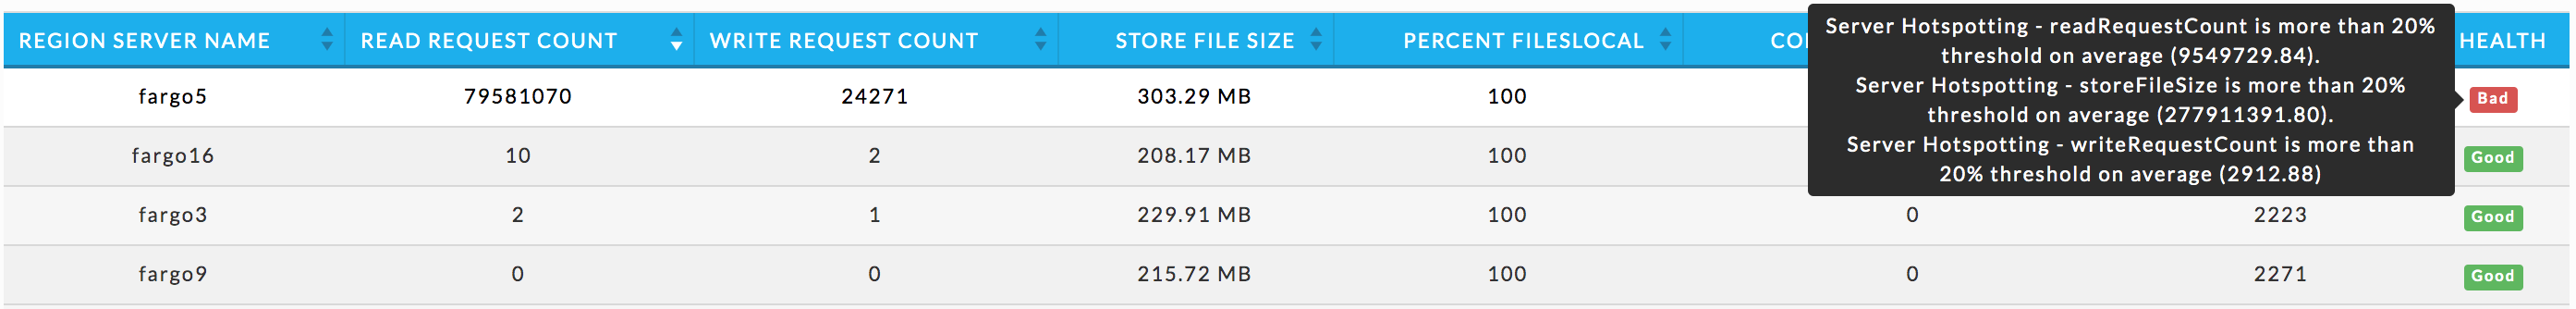
For each region server the table lists the Region Server Name and the server metrics Read Request Count, Write Request Count, Store File Size, Percent Files Local, Compaction Queue Length, Region Count, and Health for each server. These metrics and health status are helpful in monitoring activity in your HBase cluster
The Health status is color coded and you can see at a glance when the server is in trouble. Hover over the server's health status to see a tool tip listing the hot-spotting notifications with their associated threshold (Average value * 1.2). If any value is above the threshold the region server is hot-spotting and Unravel shows the health as bad.
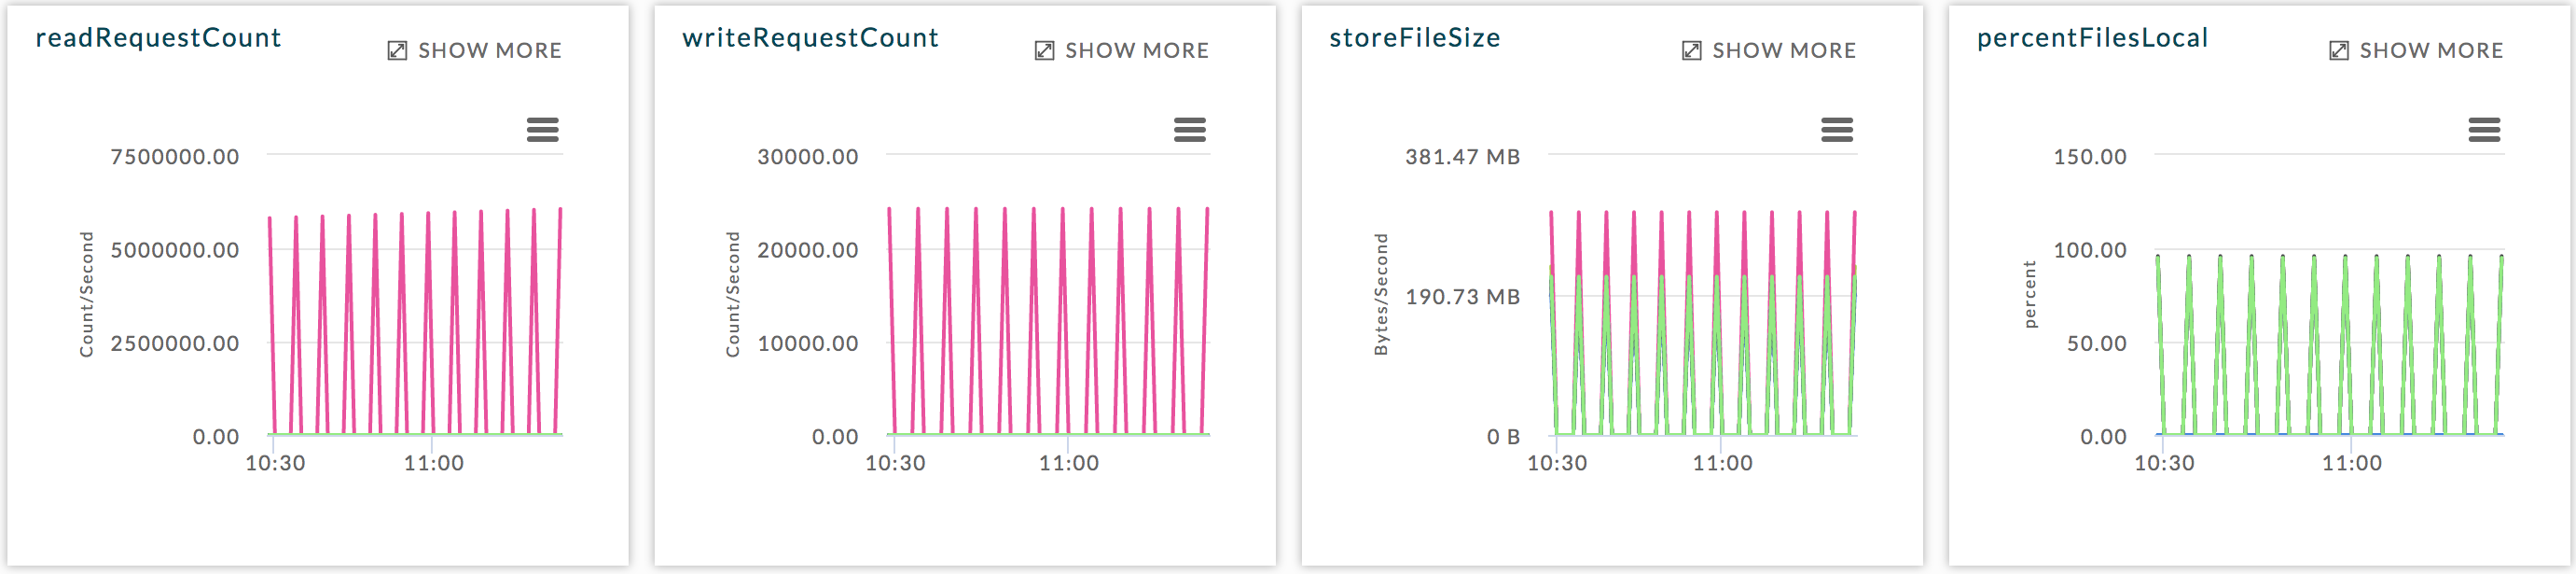
Region server metric graphs
Beneath the table are four graphs readRequestCount, writeRequestCount, storeFileSize, and percentFilesLocal. These graphs are for all metrics across the entire cluster. The time period the metrics are graphs over is noted above the graphs.
Tables
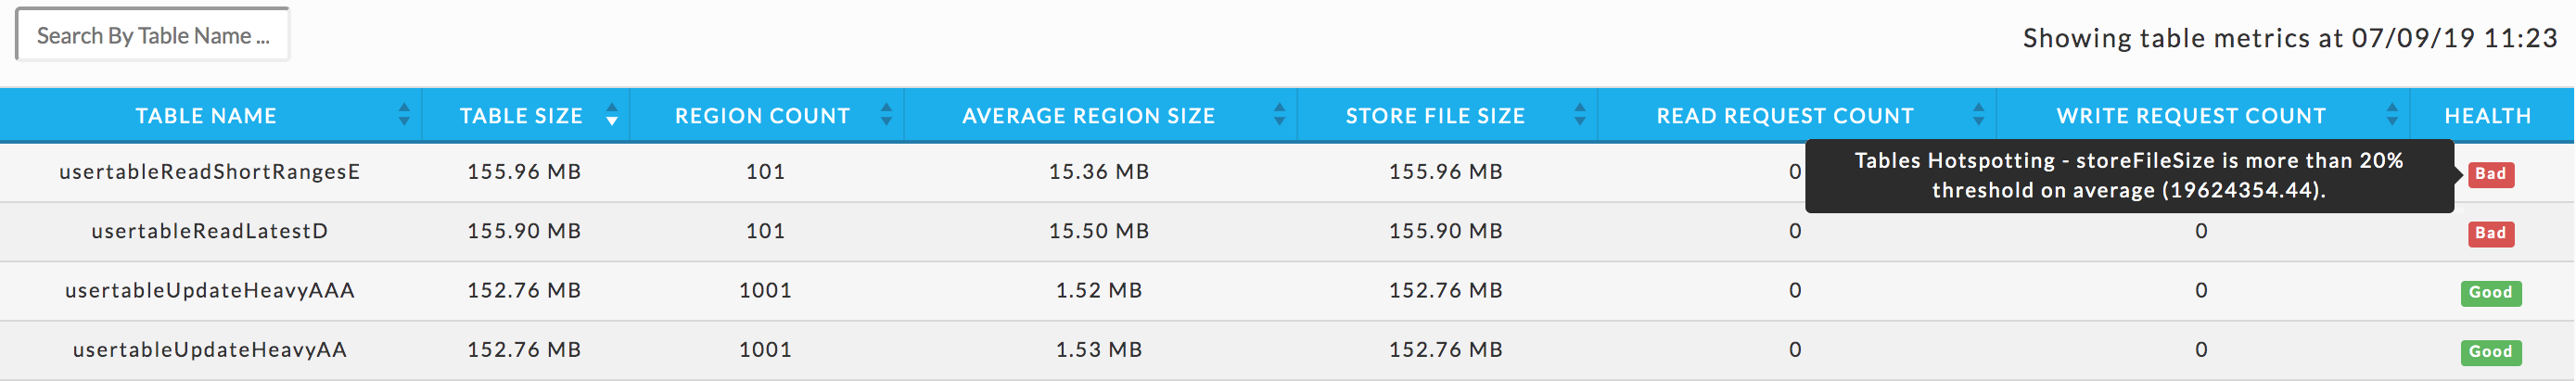
The last item in the Cluster tab is a list of tables. This list is for all the tables across all the region servers across the entire cluster. Unravel then uses these metrics to attempt to detect an imbalance. Averages are calculated within each category and alerts are raised accordingly. Just like with the region servers you can tell at glance the Health of the table.
The list is searchable and displays the Table Name, Table Size, Region Count, Average Region Size, Store File Size, Read Request Count, Write Request Count, and finally Health. Hover over the health status to see a tool tip listing the hot-spotting. Bad health indicates that a large amount of store operations from different sources are redirected to this table. In this example, the Store File Size is more than 20% of the threshold.
You can use this list to drill down into the tables, and get its details which can be useful to monitor your cluster.
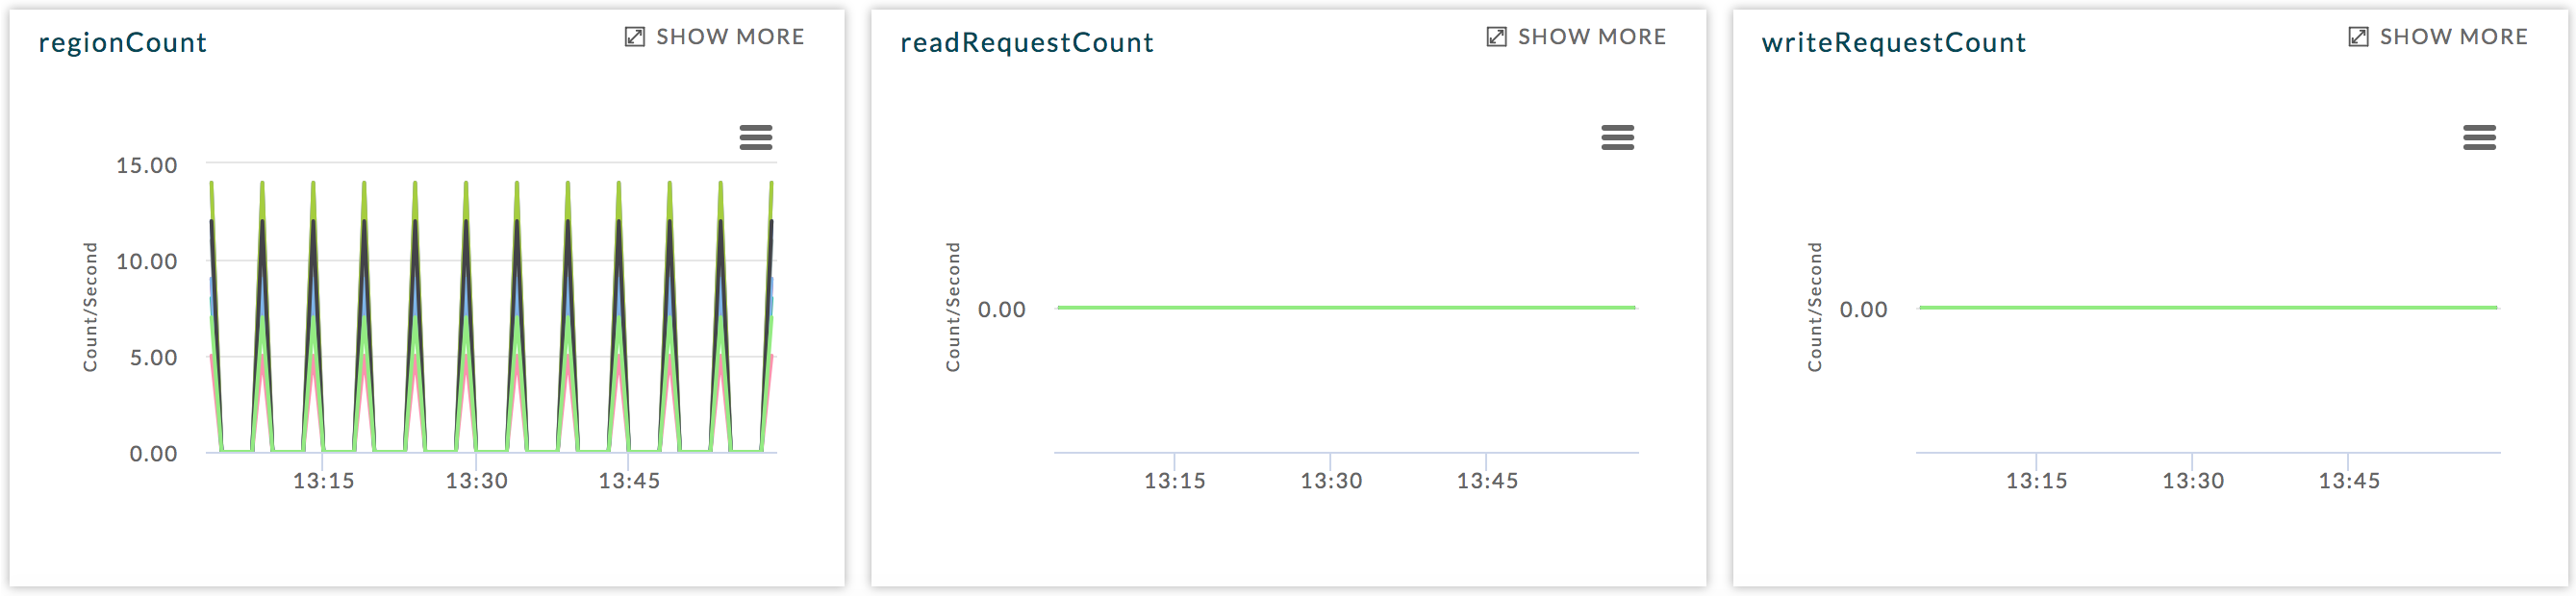
Click a table to view its details, which include graphs of metrics over time for the region, a list of the regions using the table, and the apps accessing the table. The following is an example of the graphed metrics, regionCount, readRequestCount, and writeRequestCount.
Region
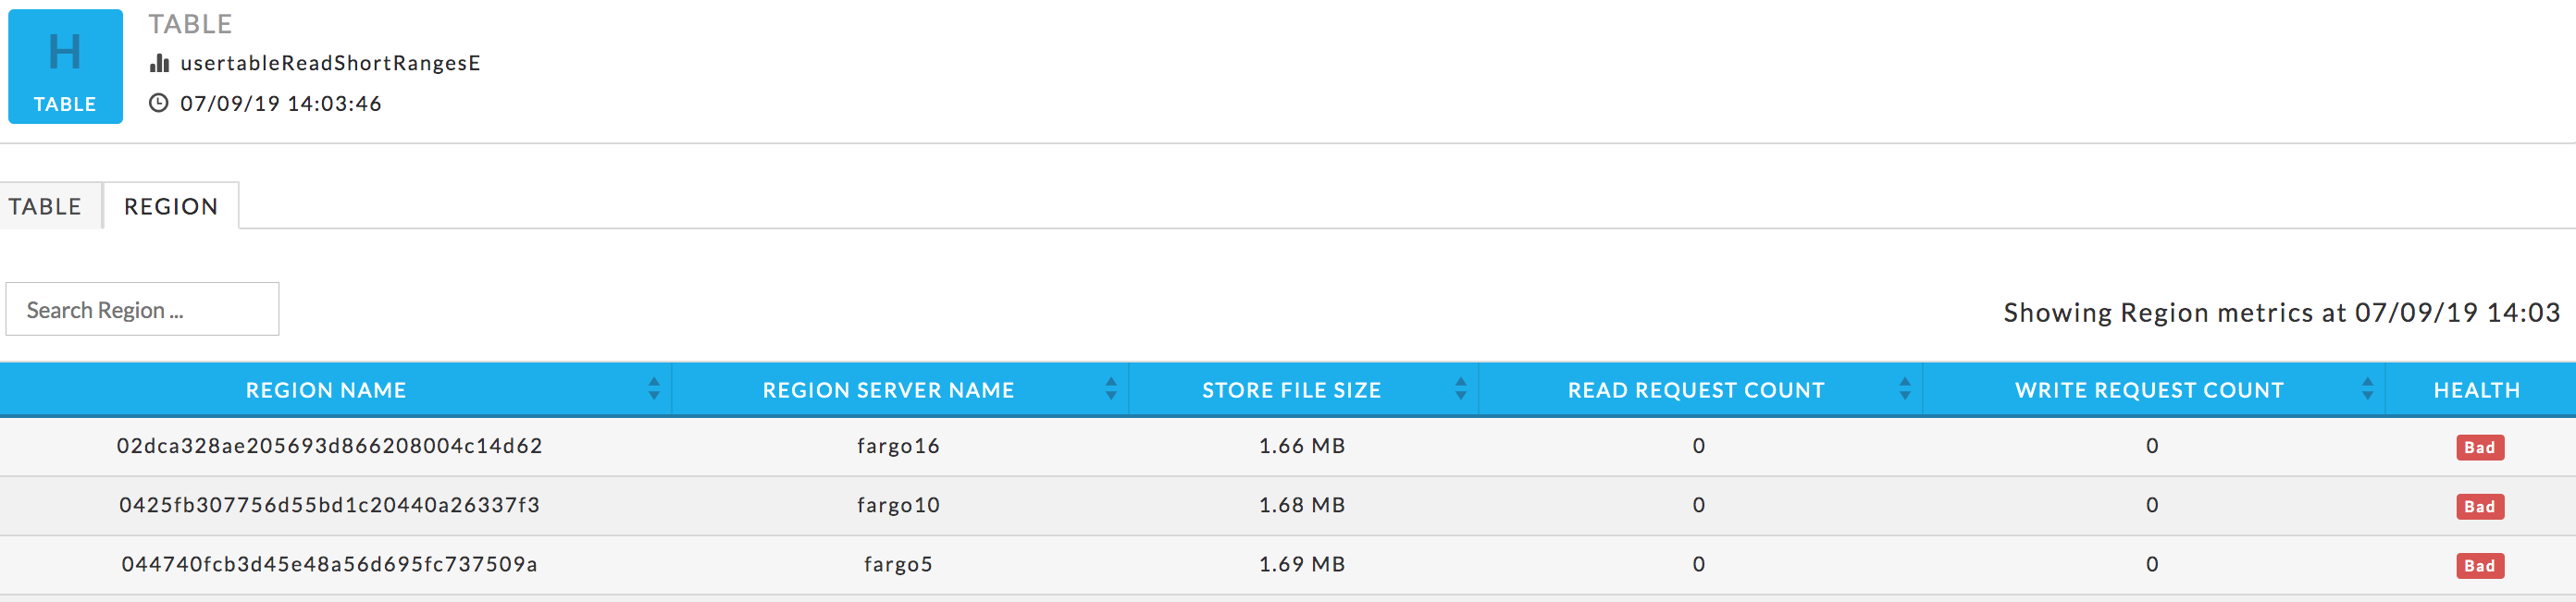
Once in the Table view, click the Region tab to see the list of regions accessing the table.
The table list shows the Region Name, Region Server Name, and the region metrics Store File Size, Read Request Count, Write Request Count, and Health. These metrics are useful in gauging activity and load in region. The region health is important in deciding whether the region is functioning properly. In case any metric value is crossing the threshold, the status is listed as bad. A bad status indicates you should start investigating to locate and fix hot-spotting.