Spark APM
Overview
A Spark app consists of one or more Jobs, which have one or more Stages.
Job: corresponds to a Spark action, for example, count, take, for each.
The Spark APM lets you:
Quickly see which jobs and stages consumed the most resources.
View your app as an RDD execution graph.
Drill into the source code from the stage tile, Spark stream batch tile, or the execution graph to locate the problems.
You can use the APM to analyze an app's behavior to:
Resolve inefficiencies, bottlenecks, and reasons for failure within apps.
Optimize resource allocation for Spark driver and executors.
Detect and fix poor partitioning.
Detect and fix inefficient and failed Spark apps.
Tune JVM settings for driver and executors.
Unravel provides insights into Spark apps and potentially tuning recommendations.
There are multiple Spark app types and the Spark APM's information can vary by the app type. Currently, Unravel distinguishes between:
Regardless of the app type and how they are submitted (for example, from Notebooks, Spark shells, or spark-submit), the Spark APMs are similar and there are common tabs/information across all types.
The Spark APM's basic layout
A black title bar notes the type of tile (Spark, Job, Stage, etc). On the right side, there are actions (
 ), comment (
 ), and minimize (
 ) glyph. For jobs and stages instead of actions there is a
  , click it to see the job's or stage's parent.
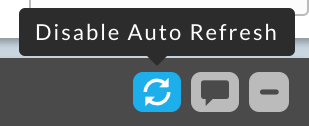
A running Spark streaming app lets you toggle the auto refresh so you can examine the app without the APM constantly refreshing.

Unravel's Intelligence Engine provides insights into an app and may provide recommendations, suggestions, or insights into how to improve the app's run. When there are insights, a bar appears immediately beneath the title bar. If Unravel has recommendations, the insight bar is orange, otherwise it's blue. For more information about events, see Events and Insights.

The next section contains the Key performance indicators (KPIs) and general app information.

Event icon: The number of events the Spark app had. If there were none, No Events is noted instead of the box. This Spark app has two events, clicking on the icon brings up a panel that contains one or more sub-tabs, as relevant, e.g., Recommendations, Efficiencies, Application Failure. See the Event Panel examples for more information.
Application icon: The app's status and the window type (S-Spark, SJ-Spark Application, and so on). The box is color-coded based upon its status.
Job icon: The job type and status. The box is colored coded to indicate as the app's status.
Job Name: Next to the job name is an AutoActions glyph (
 ) if the job has violated any actions. Hover over it to see a list of the violated actions. A fine-tuning glyph (
 ) appears when Unravel has tuning suggestions for the job.
Job Information: Job number, owner, queue, cluster and start/stop time.
In Unravel for Azure Databricks, the Job information is more detailed.
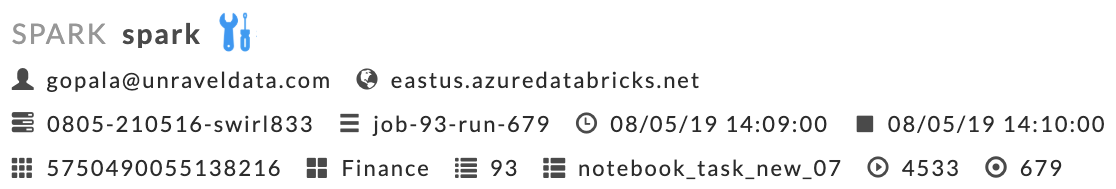
First line: Run creator, Instance name.
Second line: Cluster Id, Cluster Name, Start and End time of the run.
Third line: Workspace Id, Workspace Name, Job Id, Run Name, Run Id, Number in job.
KPIs: these vary by job type.
The last section, divided in half, has specific information related to the app. The sections for a specific Spark Application (for example, Streaming) go into more detail. If the app is composed of tasks/jobs/stages they appear on the left side under Navigation or Stream. Clicking a row brings up detailed information about it in a separate tile/panel. When there is an AutoAction column (
 ), the number of events associated with the stage is listed. Click
  to toggle the display of the job tile.
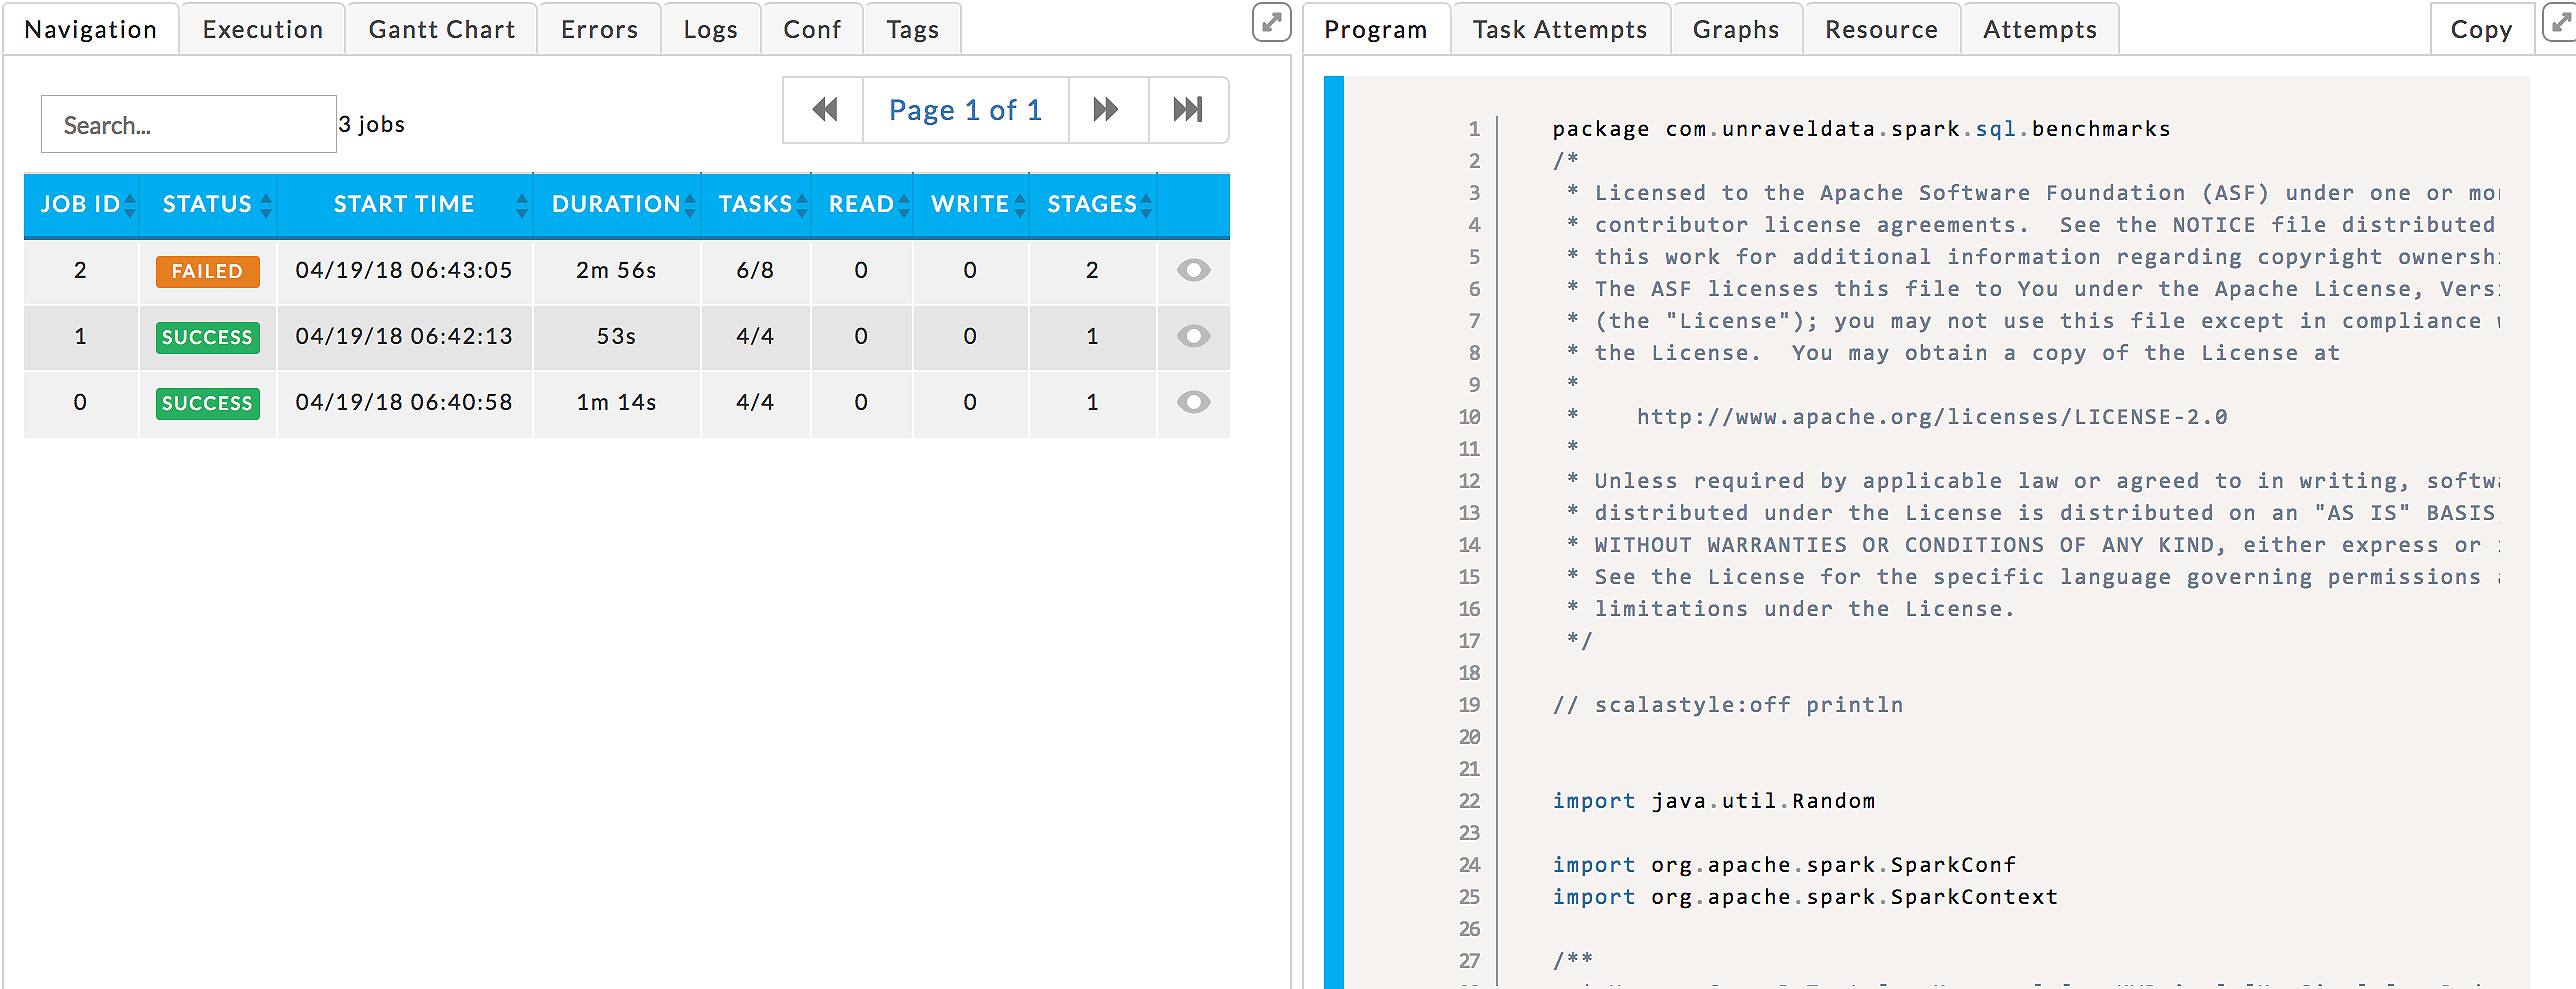
As of Unravel 4.5.2.0, a left-hand tab isn't displayed when no data available, for example, there is no Conf tab when no configuration information is available.
The Graphs tab isn't available when no data available. If a graph has less than four data points, the graph is displayed as a bar graph.
Actions
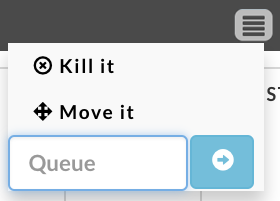
Click in the title bar to bring up the available actions.
When a YARN app is running you can kill or move it.
 |
After the app has stopped, you can load diagnostics, load logs, and create or auto tune a Session. The OnDemand package must be installed to load logs or use sessions.
Unravel loads driver logs and some of the executor logs. Unravel tries to load logs that contain exceptions and errors.
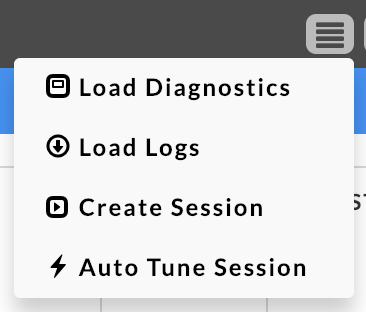 |
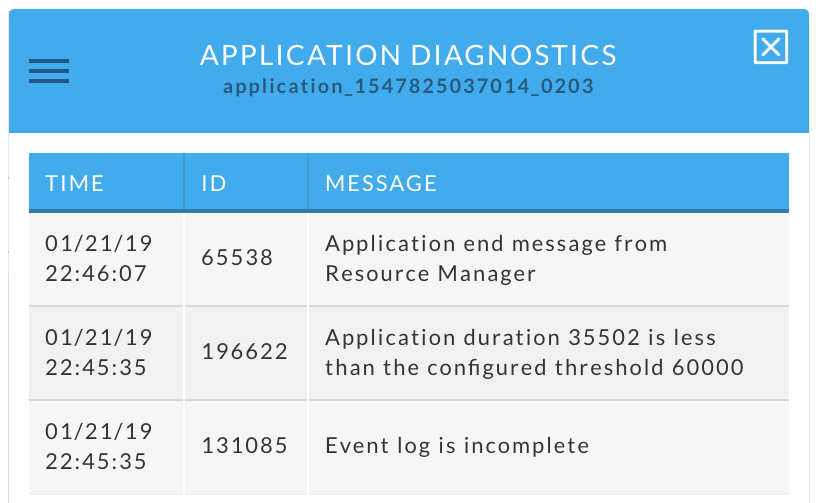
Clicking Load Diagnostics brings up a popup containing diagnostic information for the app. Load Logs refreshes the APM and populates/updates the Logs tab.
 |
Common tabs
Except for the Spark streaming app, the Application Manager view is split into two sections The sections contain the following tabs. A tab is only displayed if there is data.
Left tabs
Errors: Lists all errors associated with the app. The errors are color-coded (fatal
 , errors
  , warnings
  ) and the number for each type noted. The total number of errors is listed at the top. They are grouped by executors with the number and types of errors noted. Errors are categorized by severity and include keywords and details associated with each. Keywords help to extract important details from the error messages/log data to help quickly root out the cause of a problem. If there are no errors, then "No errors found" is listed.
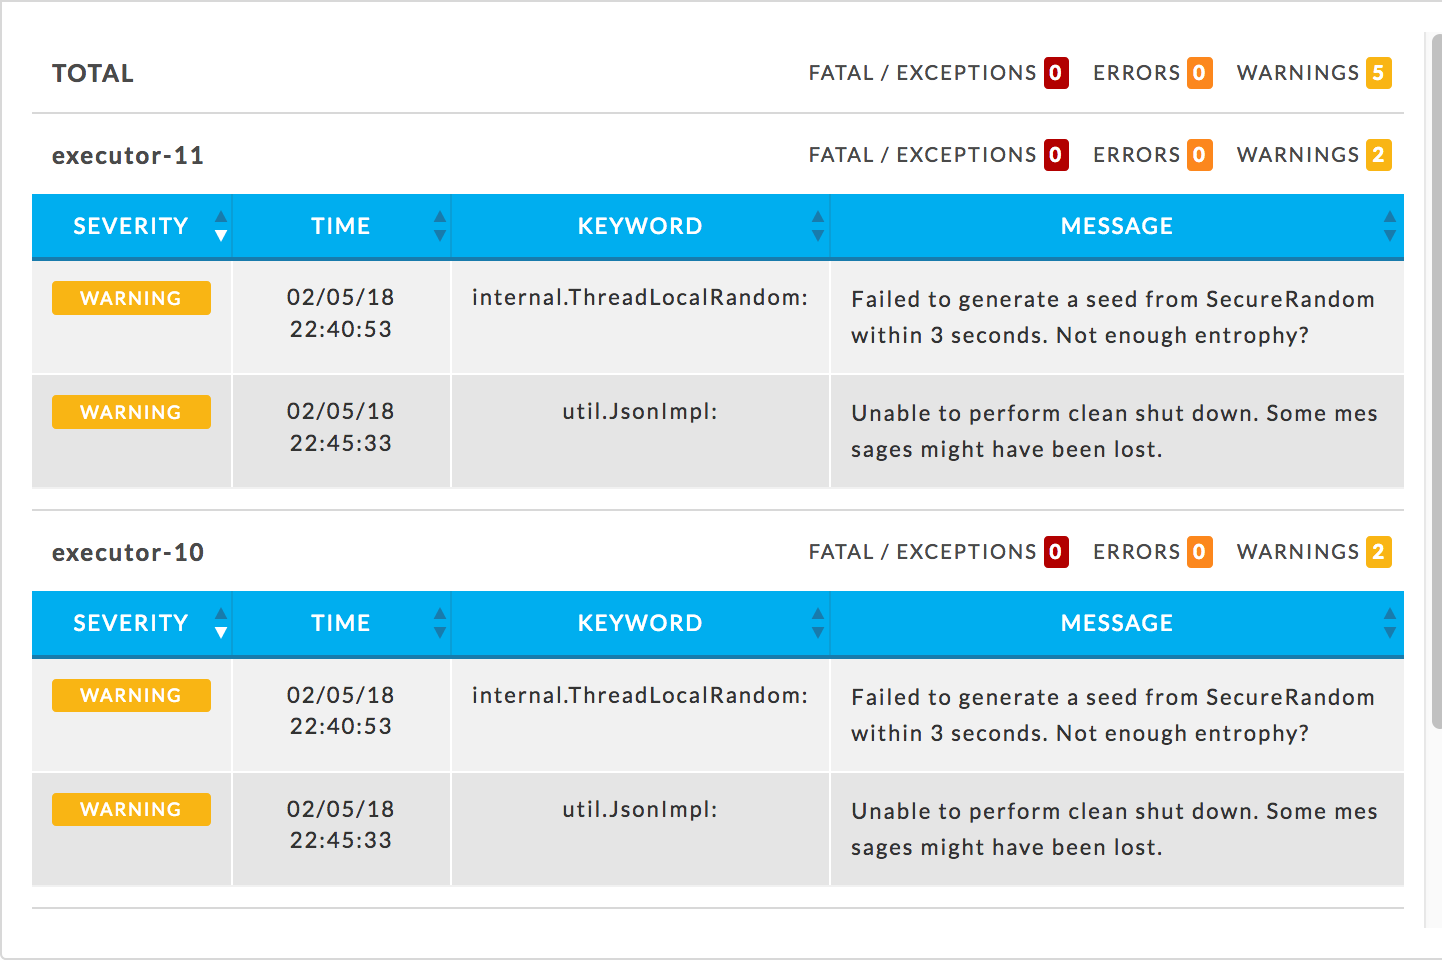
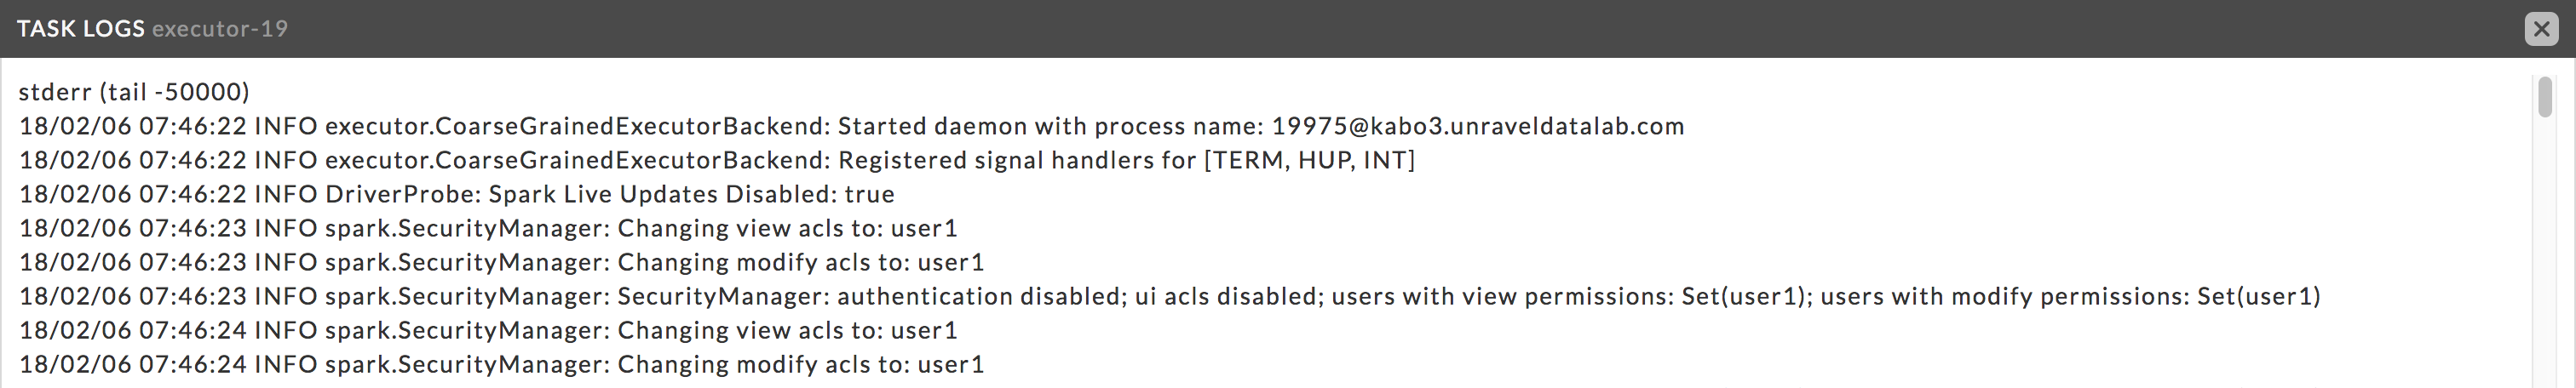
Logs: The critical logs that were collected for this Spark app. “No Logs Found” is displayed when Unravel is unable to load any log information.

Click the log name to see it, this example is an excerpt of the executor-20 log.
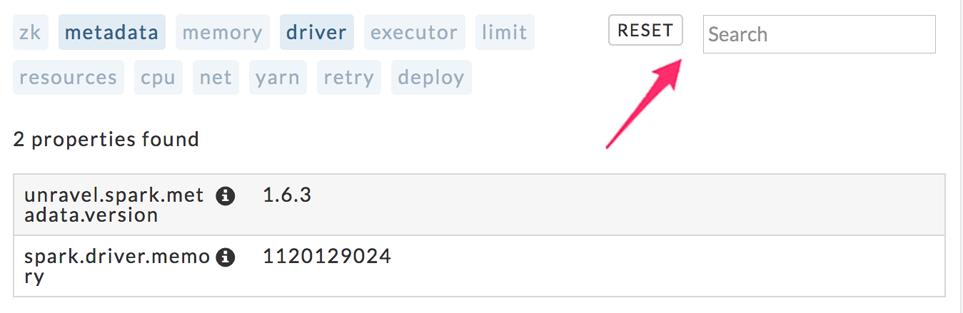
Conf: The configuration parameters and their values. The tab opens listing all the properties, according to app/task/job. The number of properties displayed is noted above the list.
You can narrow the list by choosing the configuration type to display; to see the Spark version select metadata. Metadata and driver are selected in this example and the list narrowed from 1042 to two properties. Some properties appear in multiple categories, for example, spark.executor.extraJavaOptions is listed under Memory, Driver and Executor. You can search by name; searching on YARN displays every property containing the word yarn. Click Reset to display all properties.
Right tabs
Program: Displays the program's source code if available. Both the Spark Stage and Execution graph link to this tab and display code related to the tab. See Uploading Spark Programs.
Note: This tab only loads for spark-submit job types, see
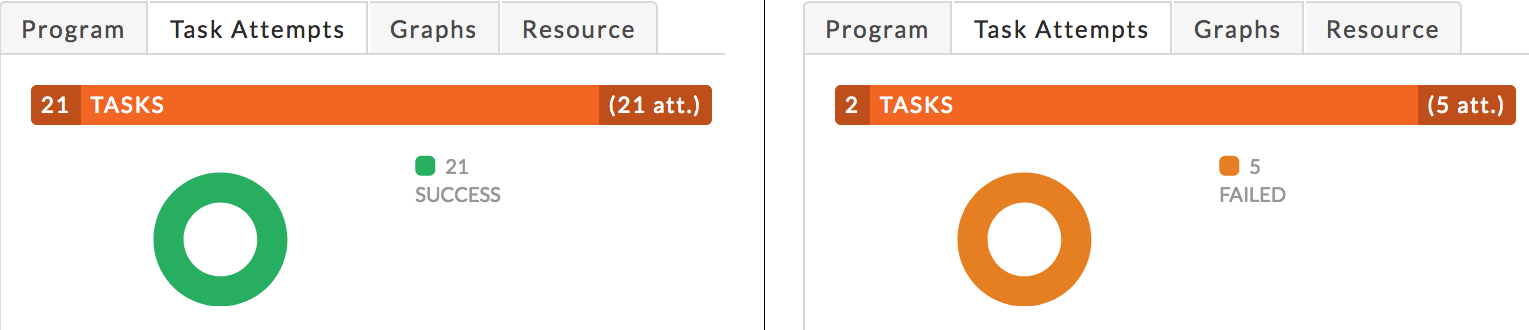
Task Attempts: Graphically and textually notes the number of tasks and their status. The donut graphs show the percentage of successful (green), failed (orange), and killed (red) tasks. A legend on the right lists the number of each. The following graph on the left shows a job in which all tasks succeeded, while the on the right has all failed tasks. Typically, the result is a combination. Hovering over the chart shows you the percentage of each.
Graphs: This tab is only displayed when there is available data. If a graph has less than four data points, it is converted to a bar graph. The graphs use wall clock time as opposed to computer usage time.
Unravel gather this data from the Resource Manager which it polls every 90 seconds while the app is running. If the app has a runtime less than 90 seconds there is likely no data.
It has three subtabs:
Running Containers: The number of running containers.
vCores: Allocated vCores.
Memory: Allocated memory.
Resource: Graphs the resources the app or stage consumed. Unravel gathers this data from the Resource Manager which is polled every 90 seconds while the app is running. If the app's runtime is less than 90 seconds there is likely to be no data collected.
When no resource data is available the tab displays “No metrics found. Metrics are displayed after Unravel has processed the app completely and Unravel's application sensors are enabled.”
By default, the graph displays all executors using the metric availableMemory. Beneath the list notes the page, if more than one, that is being displayed. Click the arrow to page down or up to display a page. Choose the metric for the graph using the pull-down menu. The metrics fall into one of the following categories: OS Memory, CPU, and Java Memory. Click Get Data to see the resource information displayed in JSON. You can toggle whether a resource is displayed by clicking on it; it is greyed out when it's not displayed.
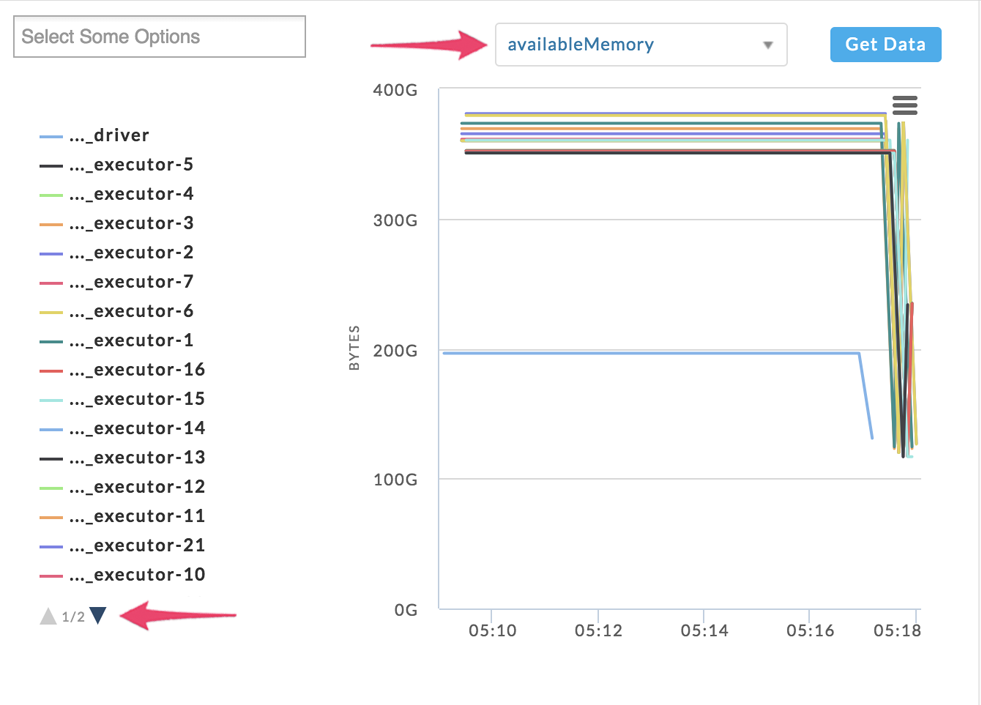
You choose one or more series to display using the Select box. Clicking within the box brings up a list of all resources available. Click the resource you want to display. You can choose to display from one to all resources. Only the chosen resources are listed at the bottom of the box. Click the X next to the resource to remove it from the list.
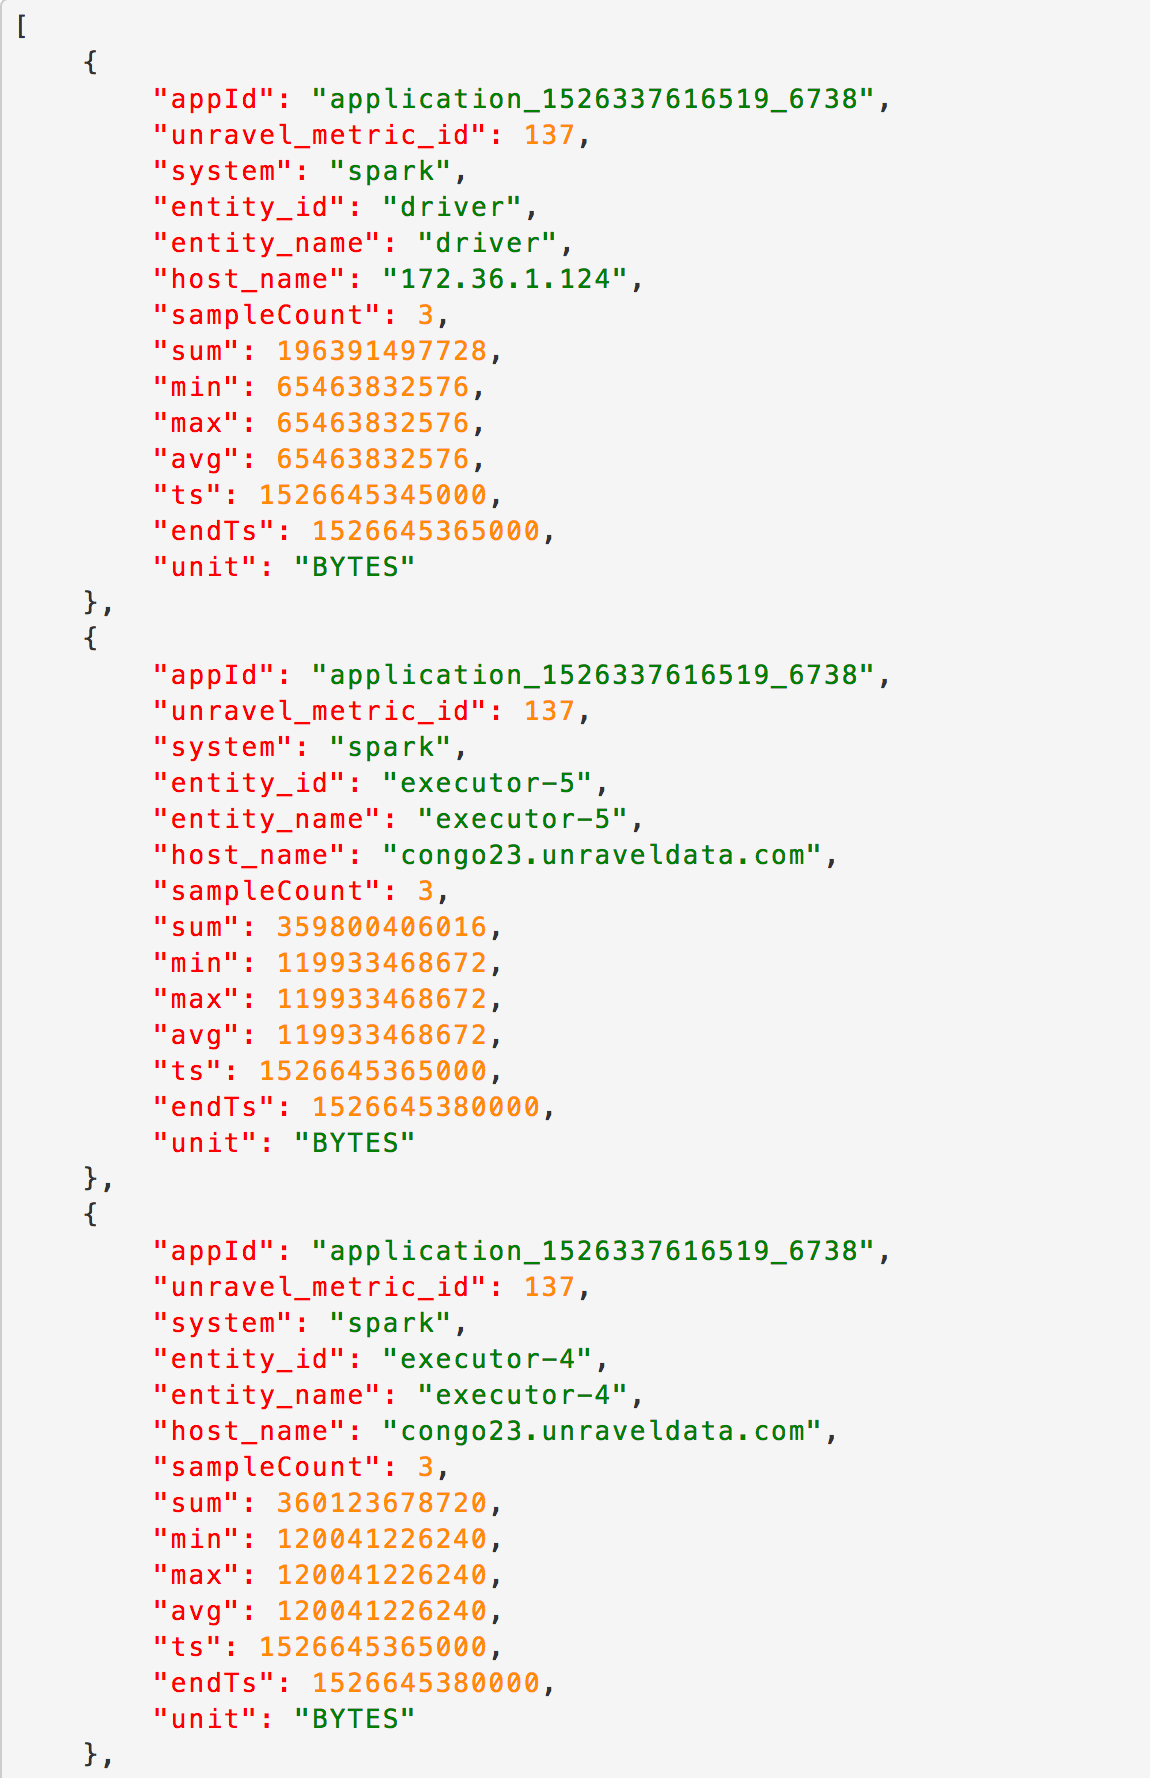
Example JSON file obtained by clicking Get Data.
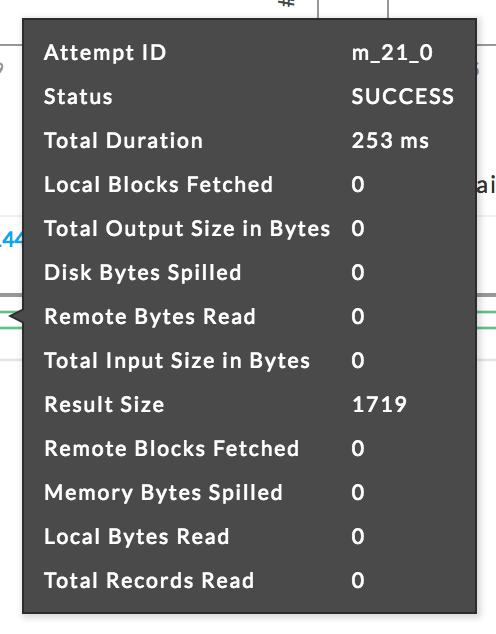
Timings: From this tab, you can view the breakdown of time spent by an app or a task. For more details, refer to Timings.
Common tiles
Spark job
A job is created for every Spark action, for example, foreach. A job consists of one or more stages. The following job has three stages, two keyby RDD's and one count. You can see the source code associated with the job in the stage tile. The Stages table lists each stage's KPIs so you can quickly see which stage consumed the most time.
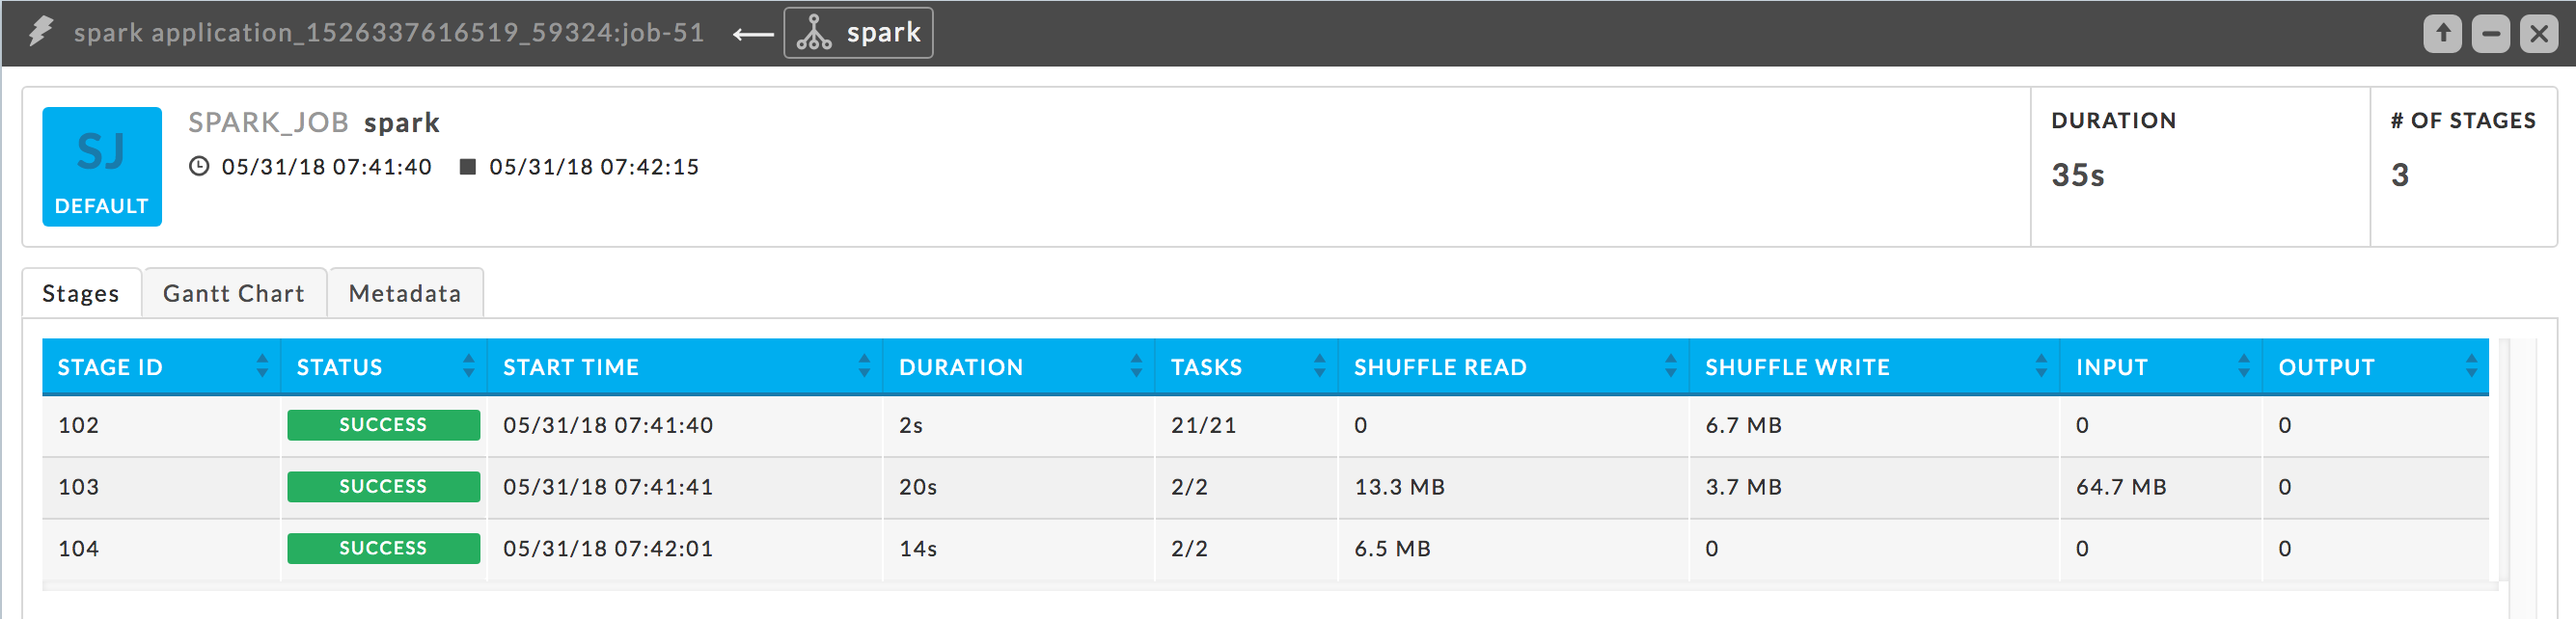
Duration: The wall-clock time it took to complete the job.
# of Stages: Number of stages to the job.
Stages: This tab is the default view. It lists the stages with their KPIs and is initially sorted on Start Time in ascending order.
Gannt Chart: This tab again shows all the stages, graphically displaying the time spent in each. The stages are initially displayed in order of execution, in other words, first, second, ..., nth.
Metadata: Lists all the attributes and values for the jobs.

Spark Stage
The Stage tile can help you pinpoint problems with the stage, for example, skewing, and see the source code associated with the stage.
Duration: The computer time it took to complete the job.
Date IO: Total input and output associated with the stage.
It has two tabs, by default it opens in the graph tab displaying the task attempts.
Task Attempt: Displays the number of total tasks for the stage and the number of total attempts made to run these tasks. The number of tasks is noted on the left side of the bar with the number of attempts on the right. The donut chart graphically displays the successful (
 ) and failed (
 ) attempts which are also listed in the legend to the right. Hover over a section of the chart to see the percentage of successful and failed task attempts. In this example, all tasks attempts have succeeded.
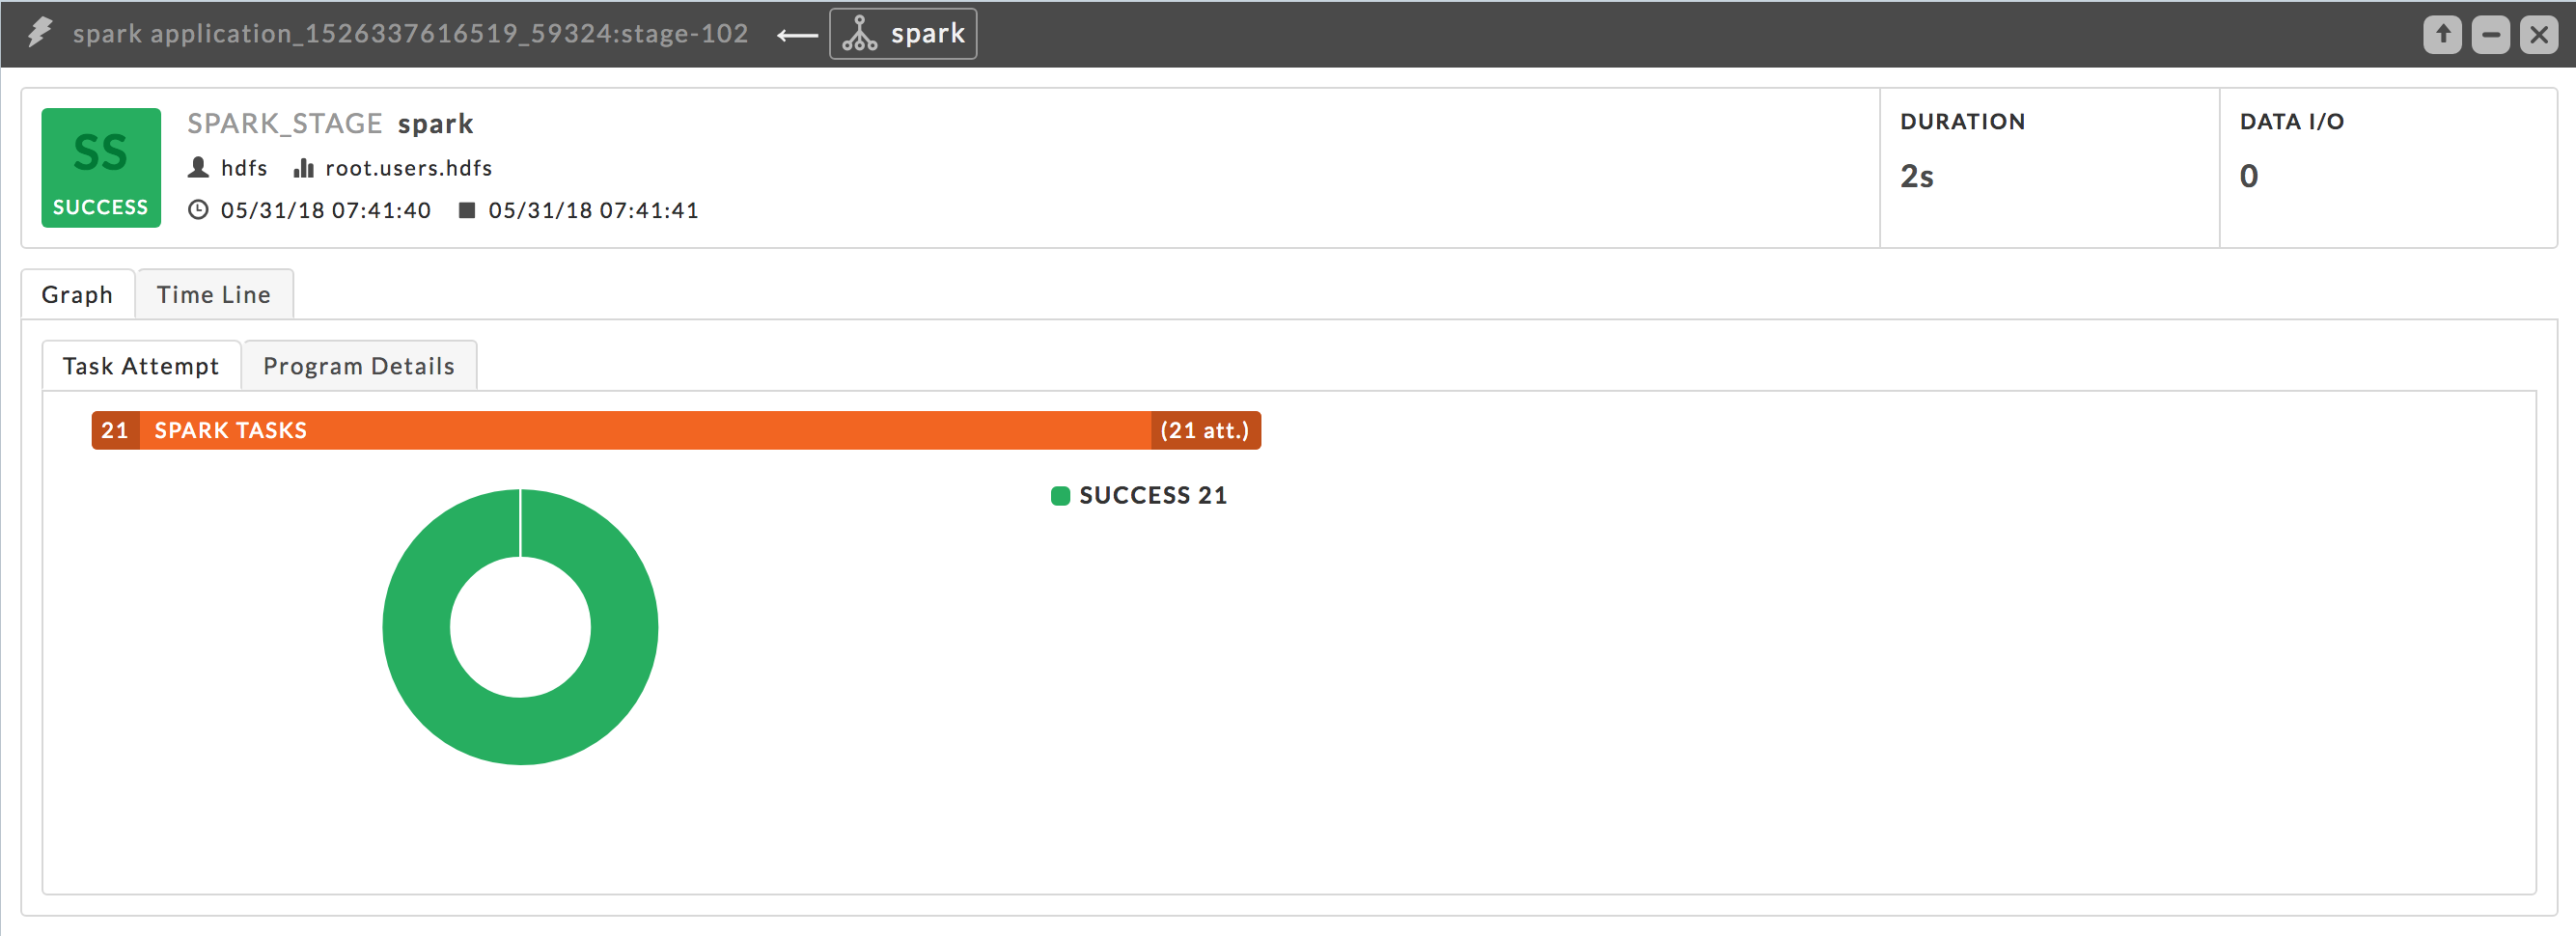
This tab isn't shown if not information is available.
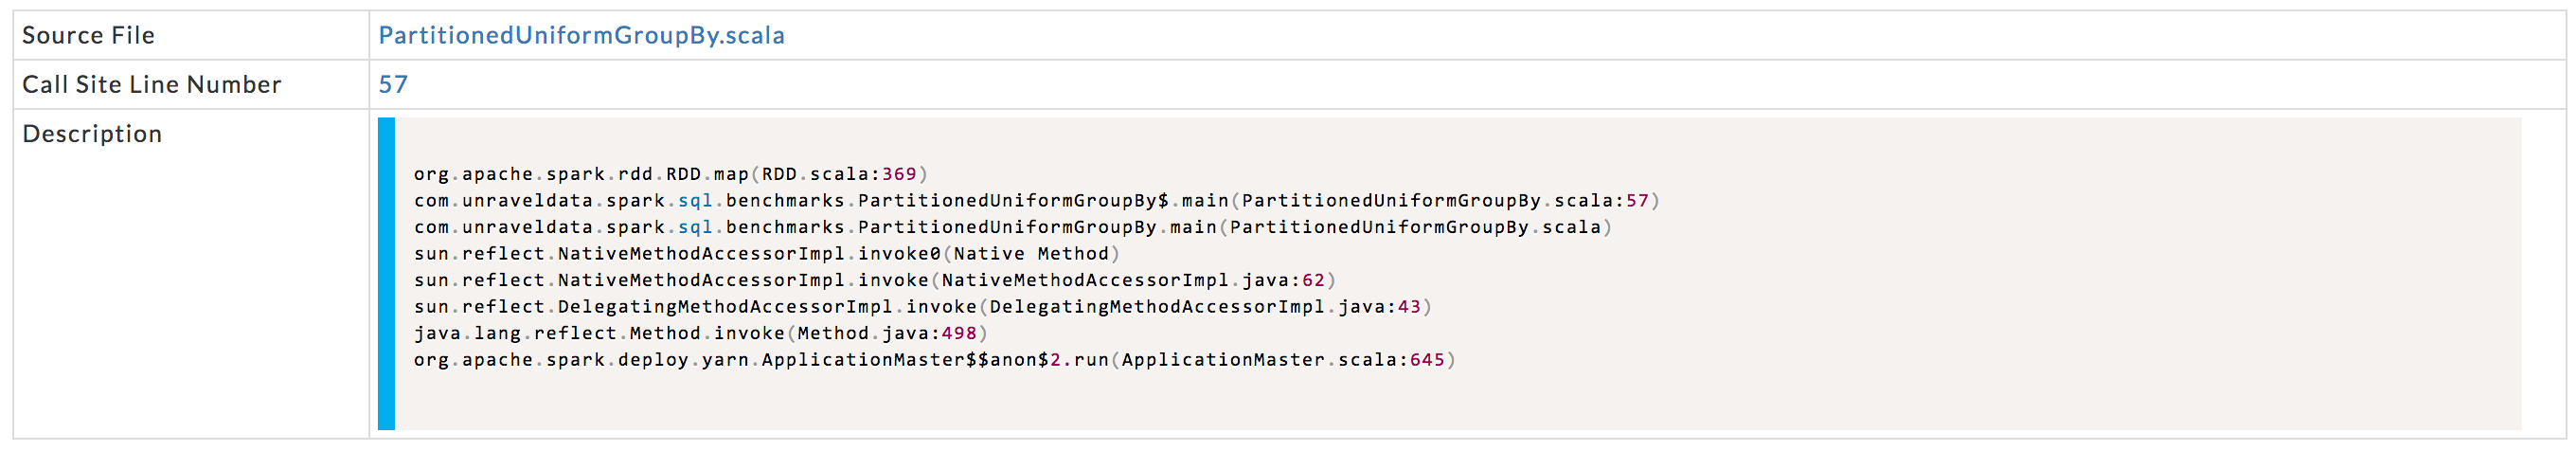
Program Details: Displays the stage's program details. Unravel extracts Source File name and call line. Click the source file or line number to see program code. The Description shows the stage's Stack trace. The first line is always a call to the Spark library. The source file name and line number are extracted from the second line.
The Time Line tab has two sections:
Distribution Charts.
Three tabs below the chart:
Time Line.
Timeline Breakdown.
Selected Tasks.
Time Line.
This tab has two sections:
Distribution Charts.
Three tabs below the chart: Time Line, Timeline Breakdown, and Selected Tasks.
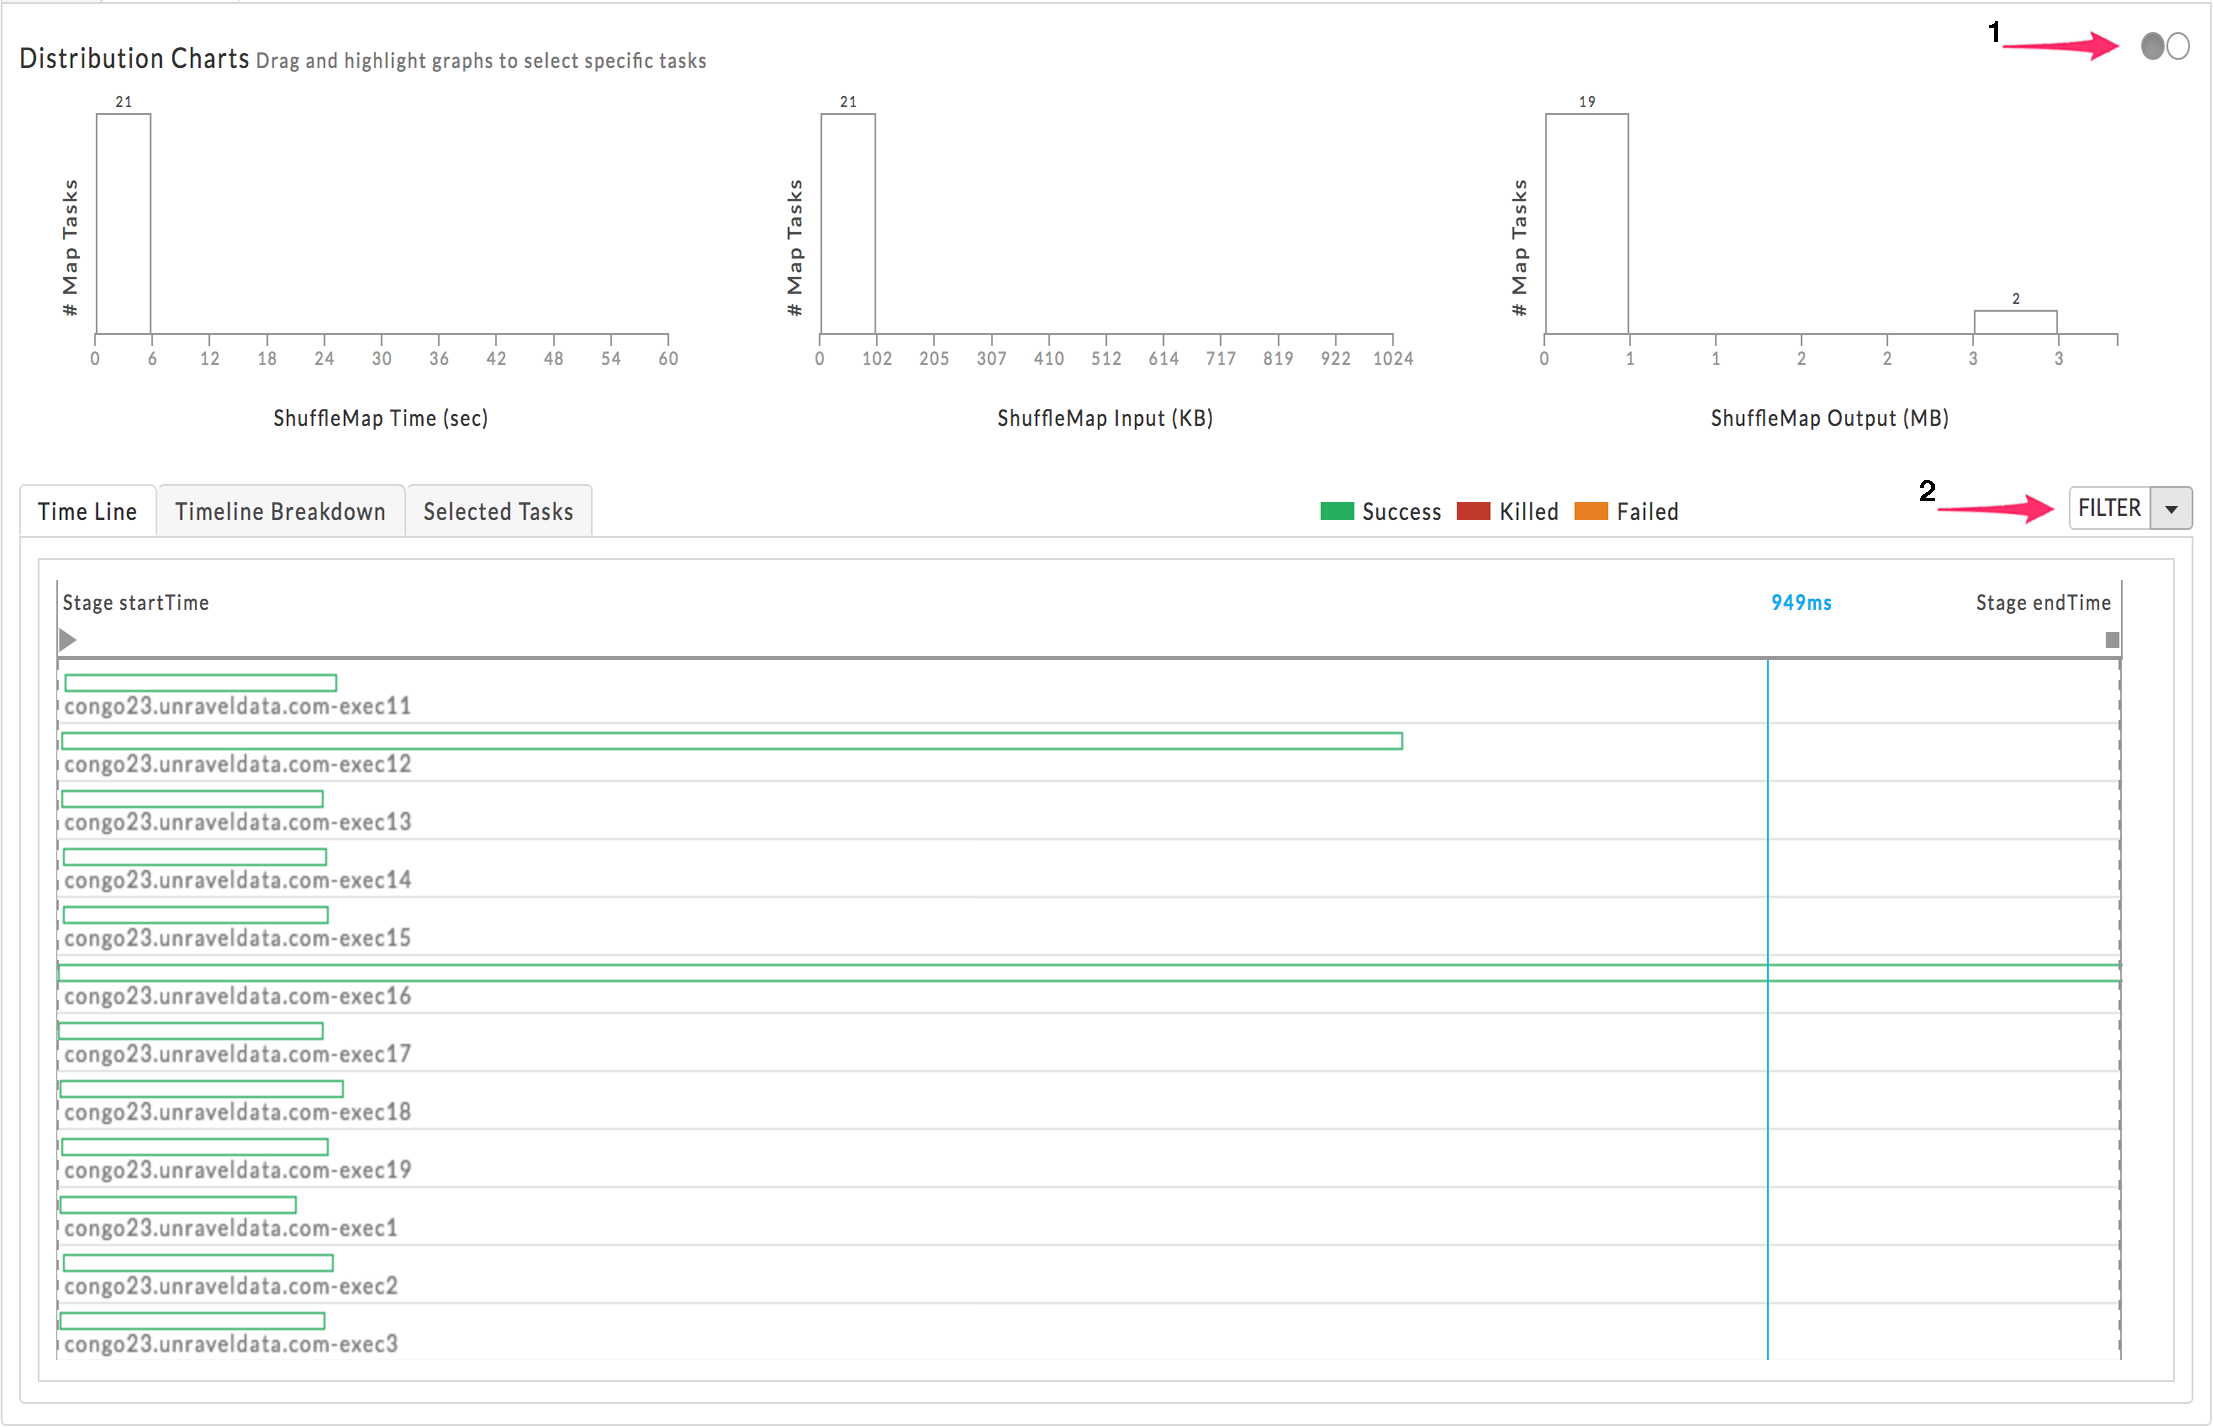
By default, the Time Line tab opens with the Distribution Charts displaying the Map Tasks over ShuffleMap information. You can toggle the chart using the radio buttons (1) to show Disk Bytes Spilled, Memory Bytes Spilled, and Records Read.
The lower section opens displaying the Time Line tab, which initially lists all the stages regardless of status. You can choose to filter the stages (2) by Tasks or Killed/Failed. Hovering over a task brings up a text-box with that stage's details.
Timeline Breakdown
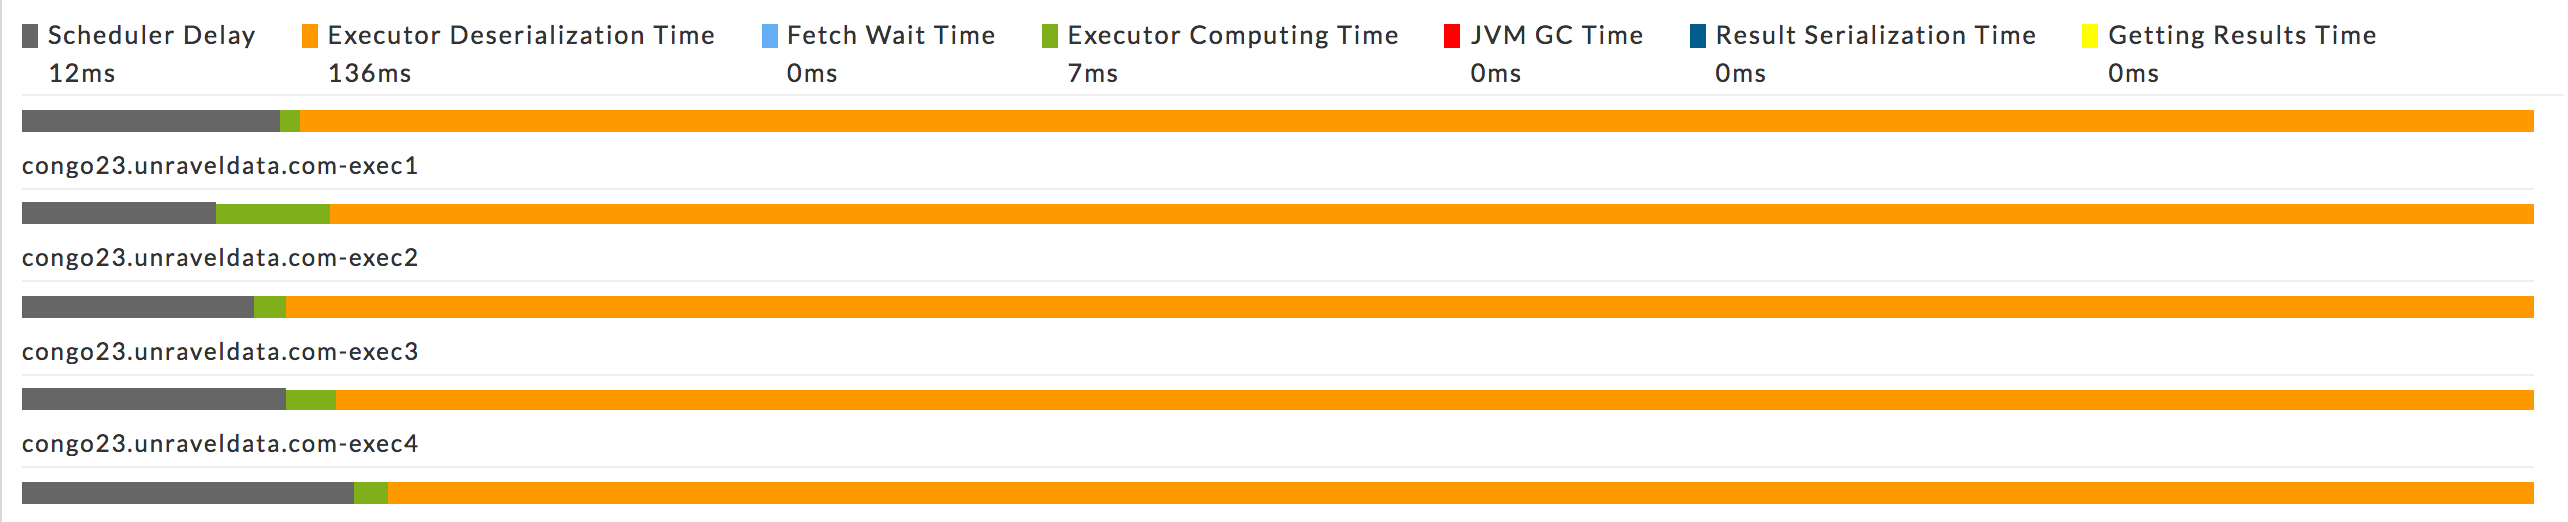
This is useful to identify bottlenecks. For each executor used in the current stage, multiple metrics are graphed: Scheduler Delay, Executor Deserialization Time, Fetch Wait Time, Executor Computing Time, JVM GC time, Result Serialization Time and Getting Result Time.
Using the ratio of Executor Computing Time to the total execution time you can determine where the executor spent most of its time:
Performing actual work.
Thrashing.
Waiting for scheduling.
Selected Tasks: A list of tasks, if any, for the stage.
Scala, Java, PySpark, and SQL-Query navigation tab
Notice
The Navigation tab isn't shown if there is no data available.
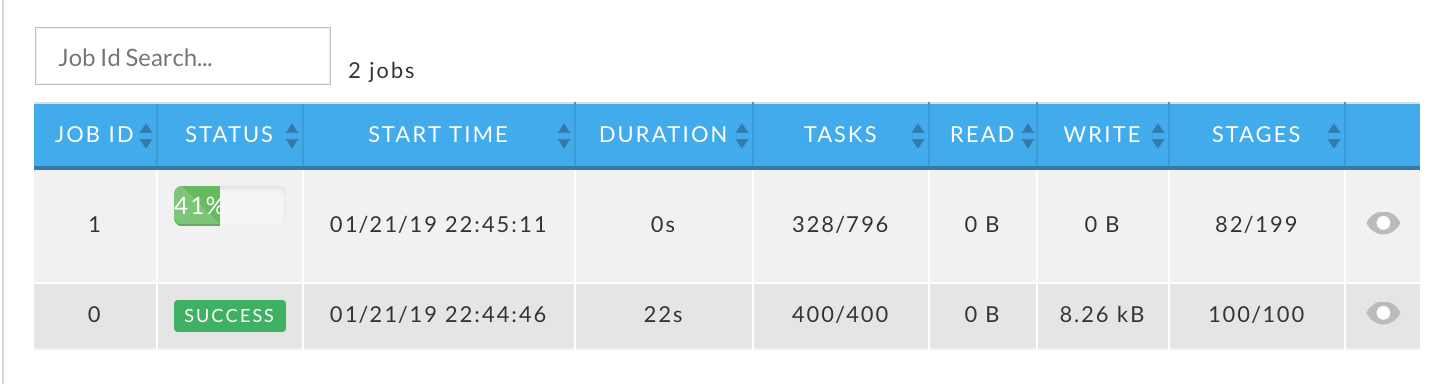
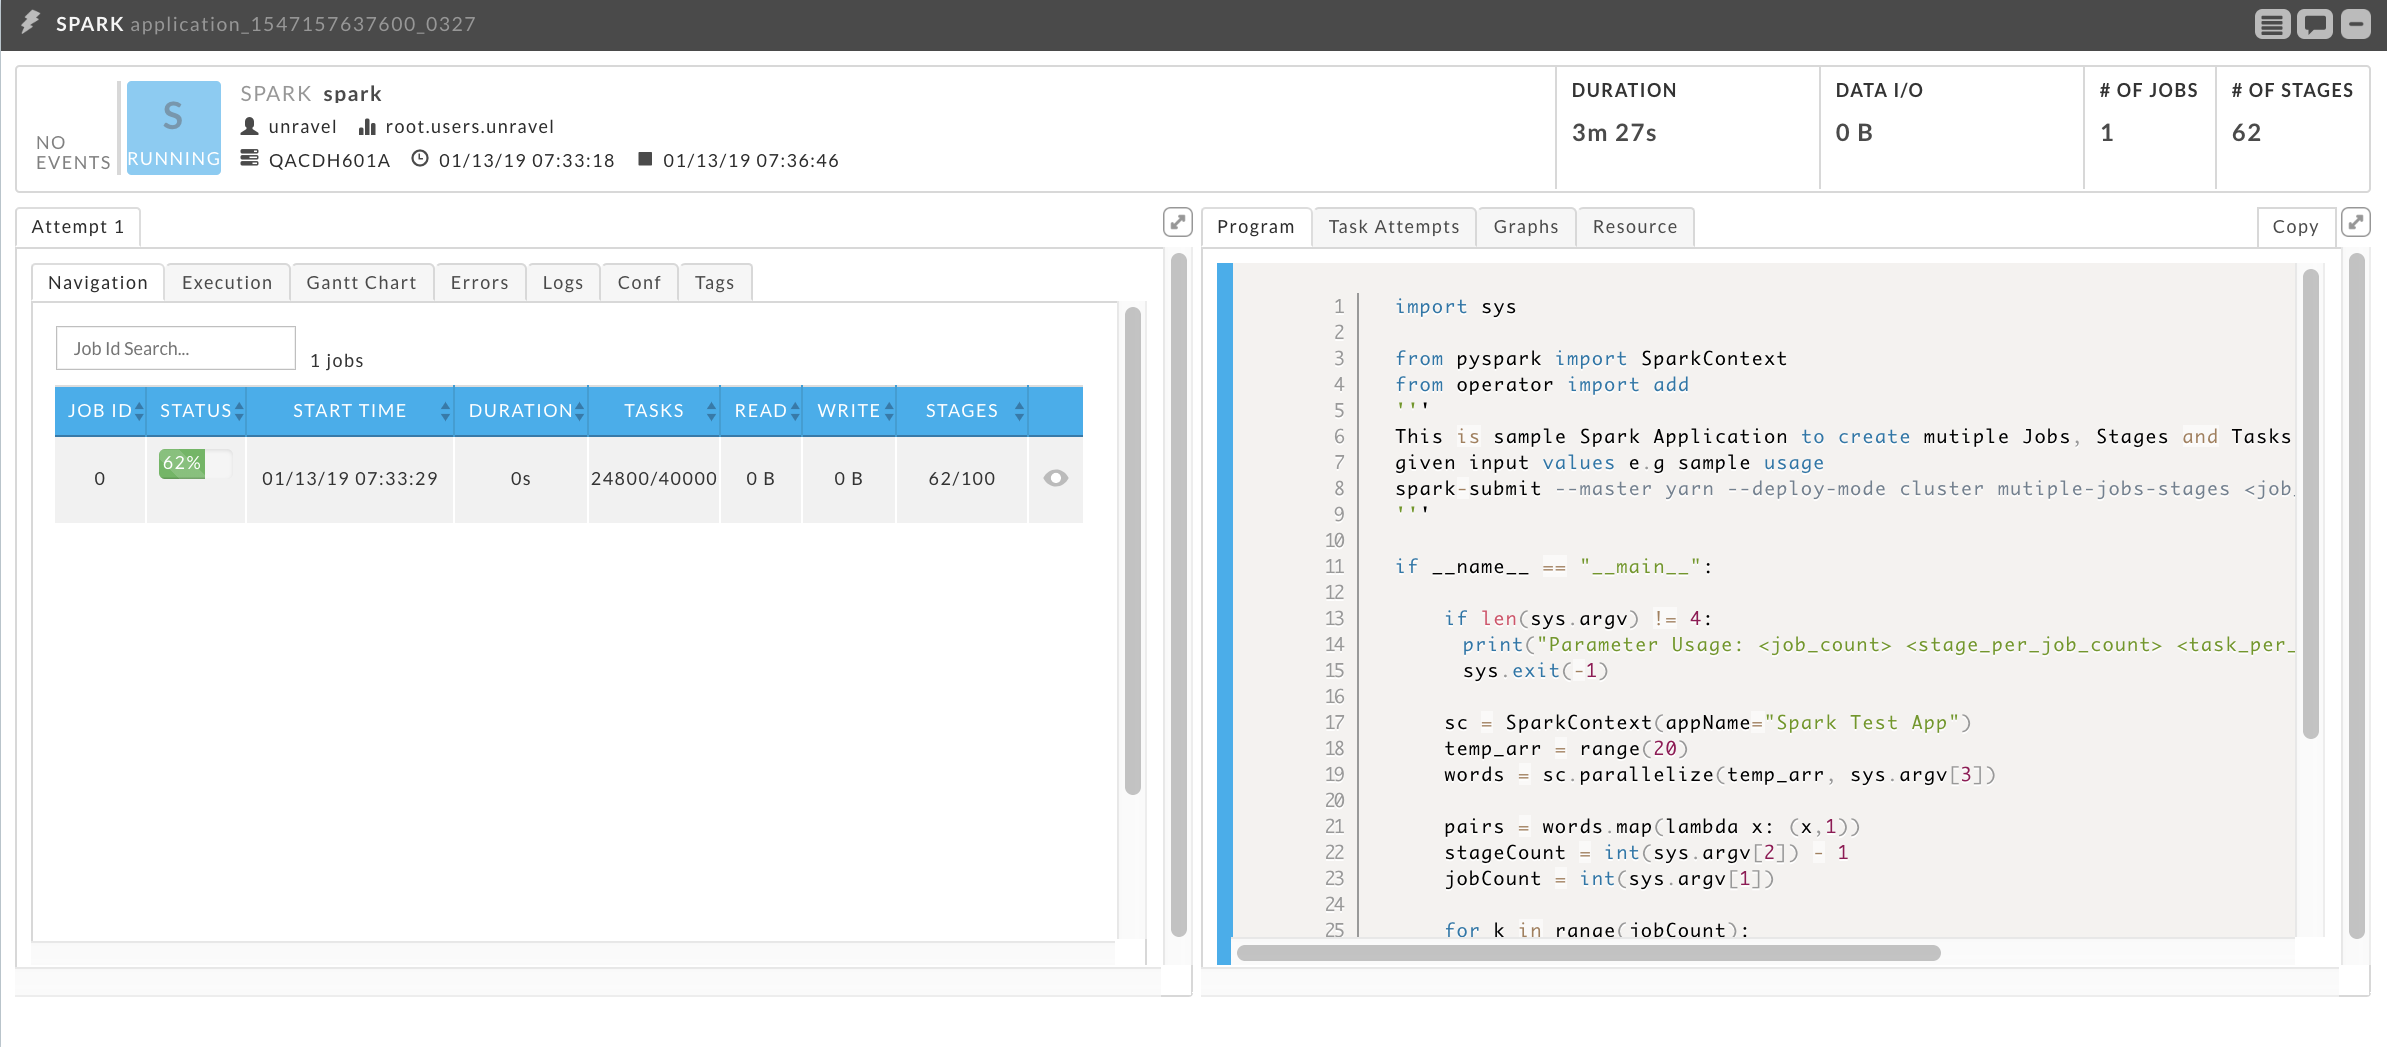
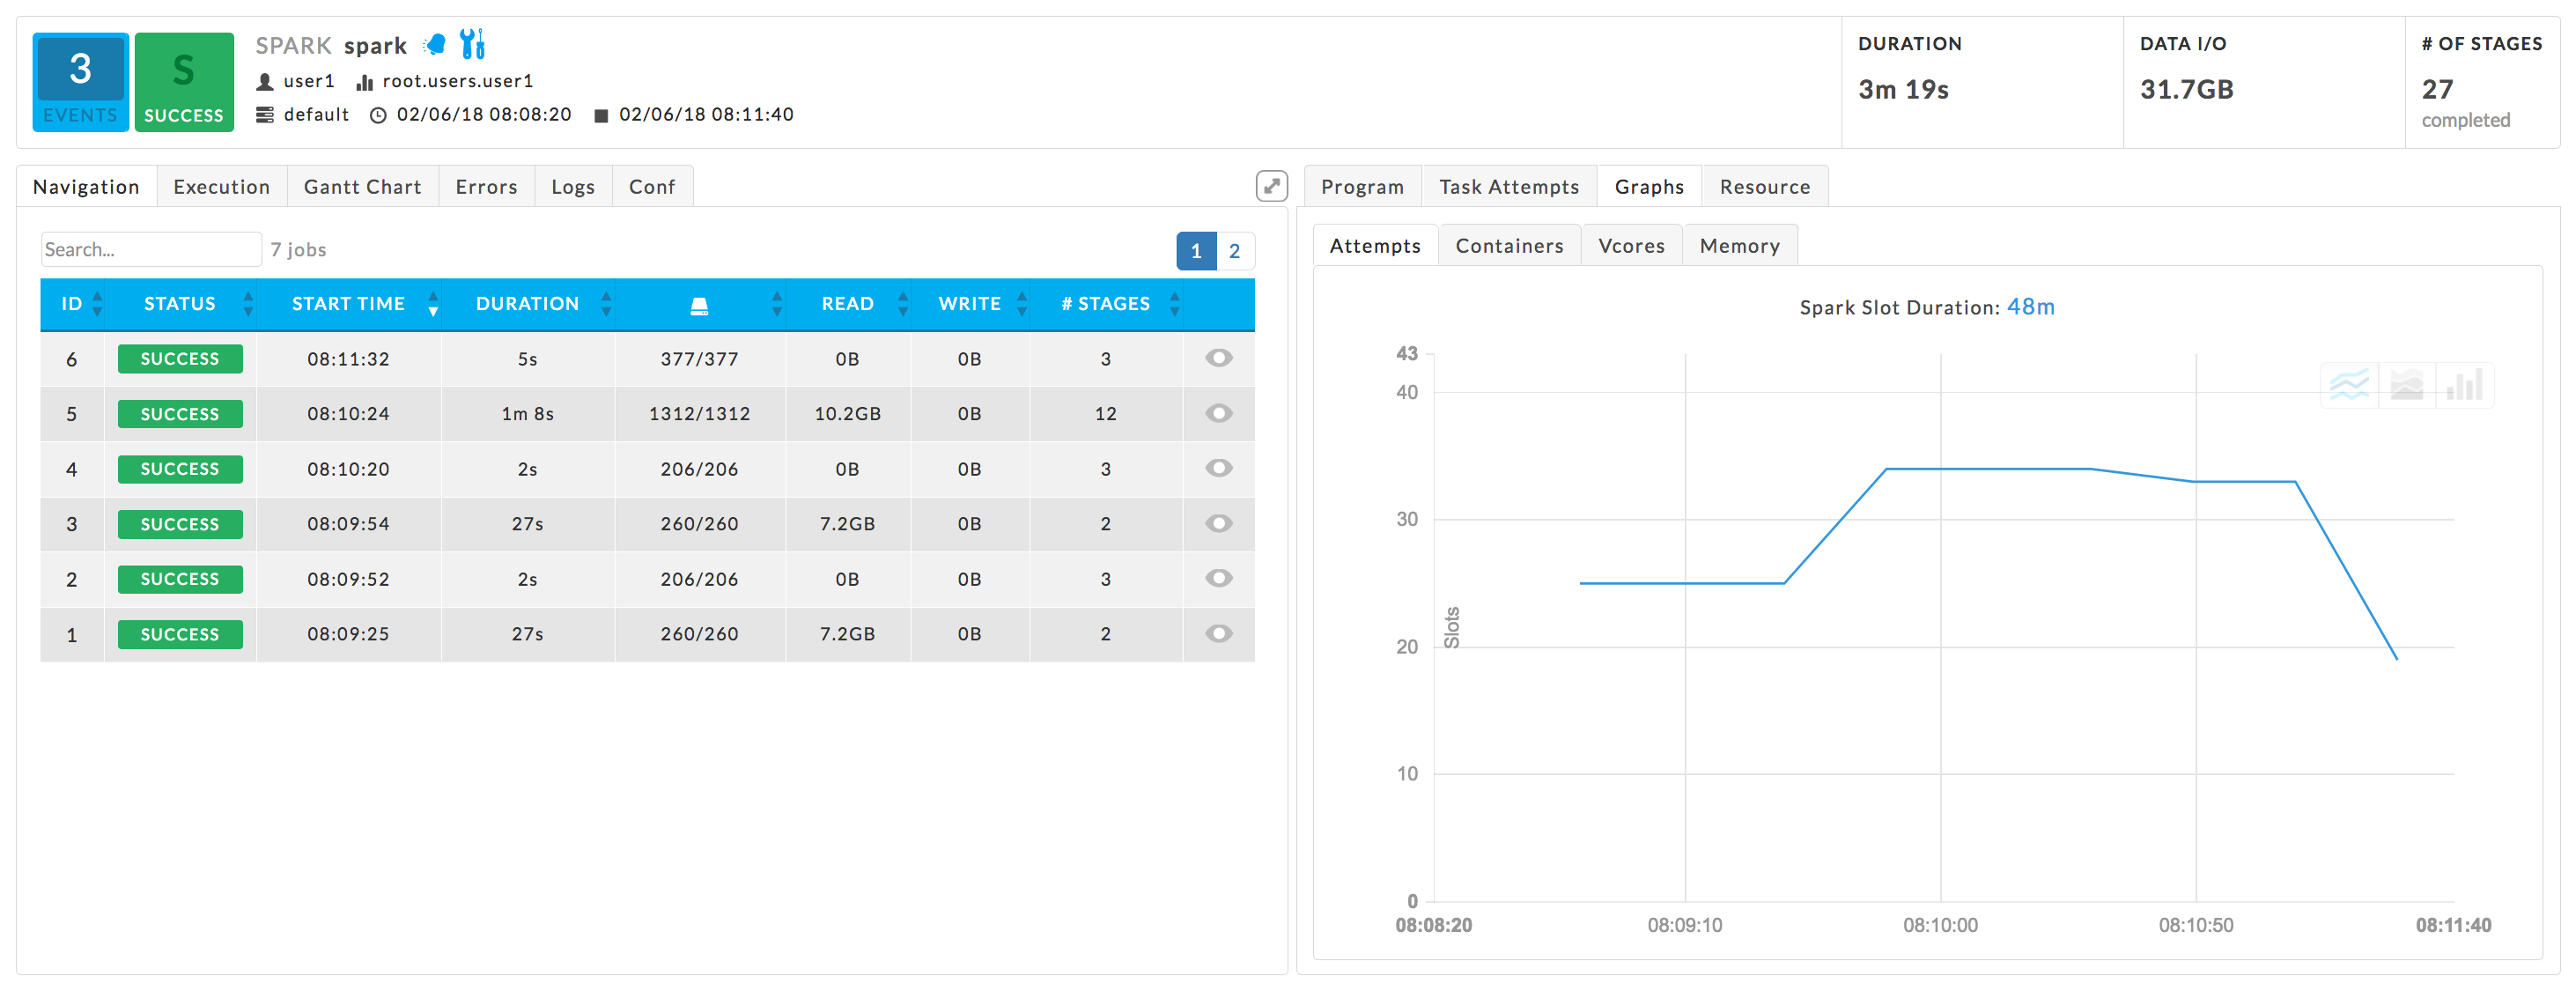
Navigation: The app's jobs with their relevant KPIs: Status, Start Time, Duration, Tasks, DFS Read, DFS Write, Stages. The jobs are sorted by Start Time in descending order.
While the app is running, the Status column displays the job's completion percentage. The Tasks and Stages columns show the (current number completed)/(total). In the following image, Job ID 1 is 41% complete.
Note
This tab updates every 60 seconds. However, the live data that Unravel receives is only updated upon:
The start of a Spark Job.
The completion of a Spark task, job or stage.
This tab isn't shown if there is no information/data available.
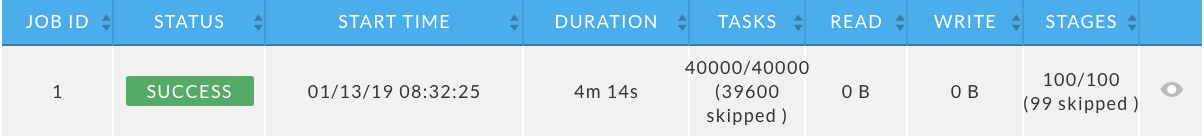
Once completed the total number of the Tasks and Stages are shown along with the number skipped. In this example, 39,600 Tasks and 99 Stages were skipped.
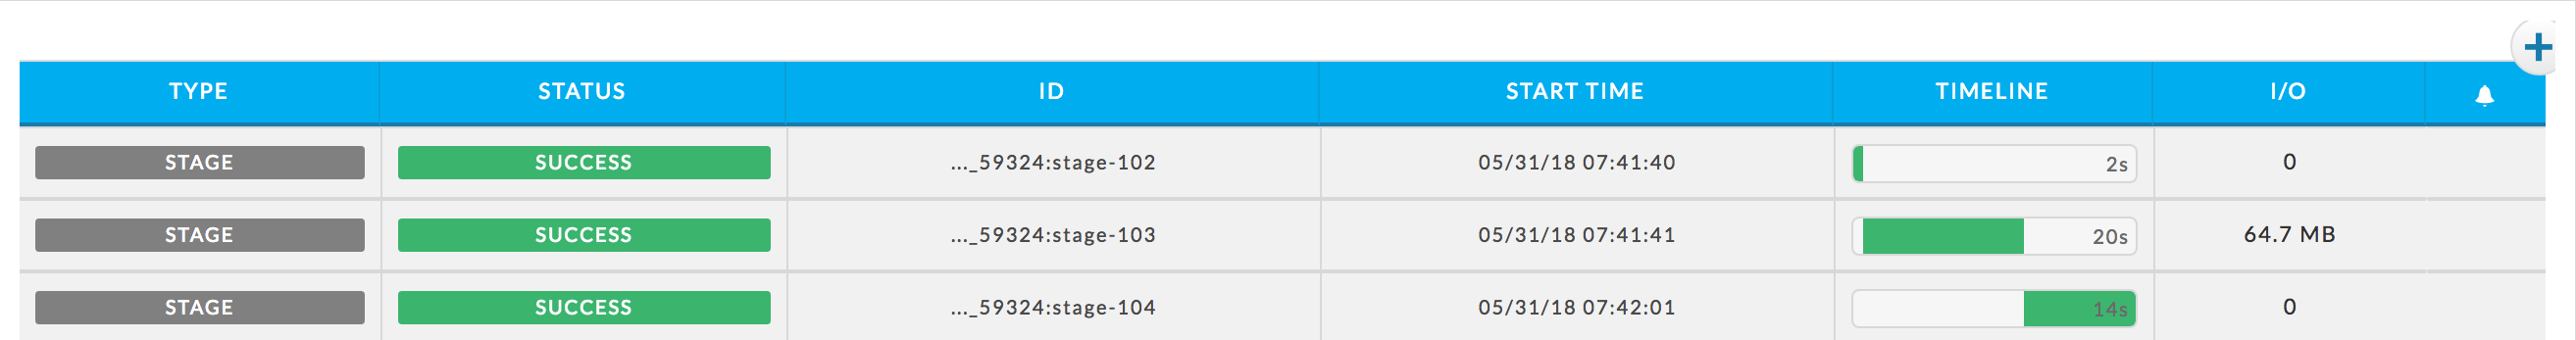
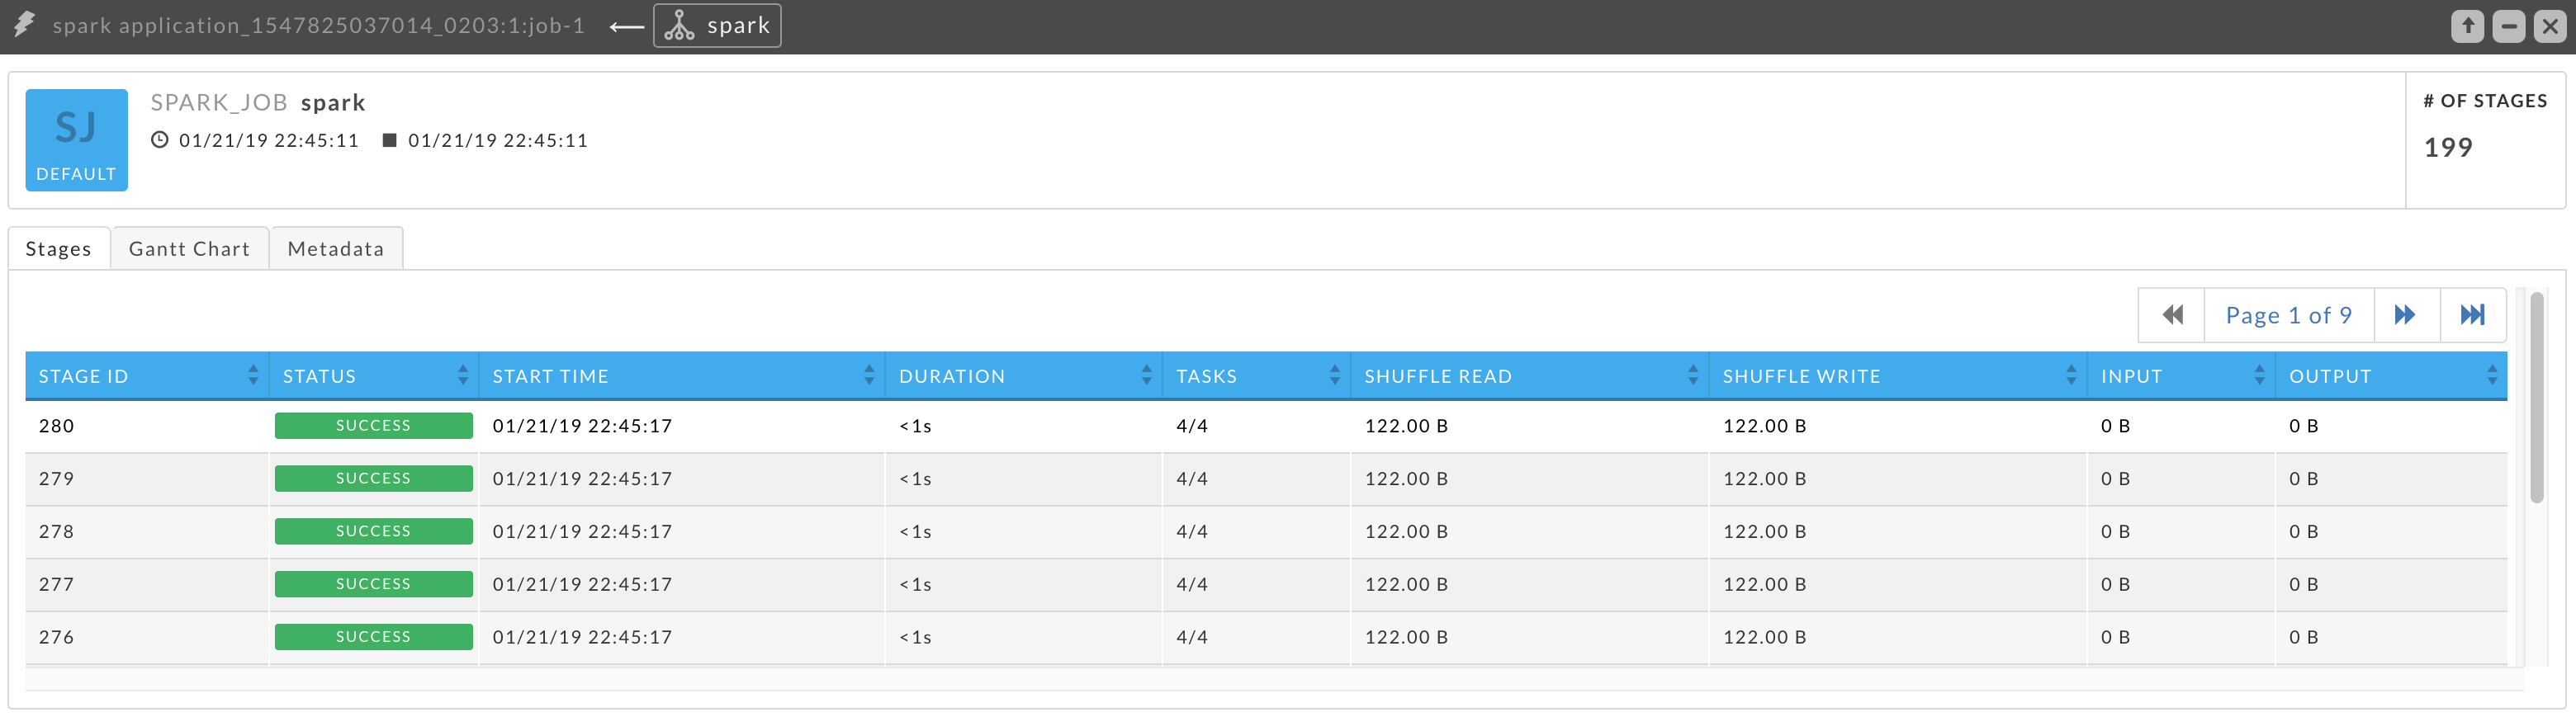
Click a job row to bring up its details in a Job Block. You can open the job even if it's running. The job block lists the KPIs Duration and # of Stages. It has three tabs, Stages, Gannt, and Metadata. The default view is the Stages tab. The stage table lists ID, Status, Start Time, Duration, Tasks (Complete/Total), Shuffle Read, Shuffle Write, Input (total data read by the app), and Output (total data written by the app). By default, the stages are sorted by Start Time in descending order. Click a stage to bring up its details in a tile. See Spark Stage.
This example is for Job 1 above, which is only 41% complete. Here the # of Stages lists 199, but only 82 completed jobs are listed in the table. As jobs are completed they are added to the table.
Spark Scala, Java, and PySpark
Key performance indicators
Events: is the number, if any, of Unravel insights for the query. See the here for more information.
Duration: The "wall clock" time it took for the app to complete.
Data I/O: The memory used.
Number of Stages: The number of stages in the query.
Left tabs
Navigation: The app's jobs with their relevant KPIs: Status, Start Time, Duration, Partitions/Tasks (
 ), DFS Read, DFS Write, # Stages. See above for more details.
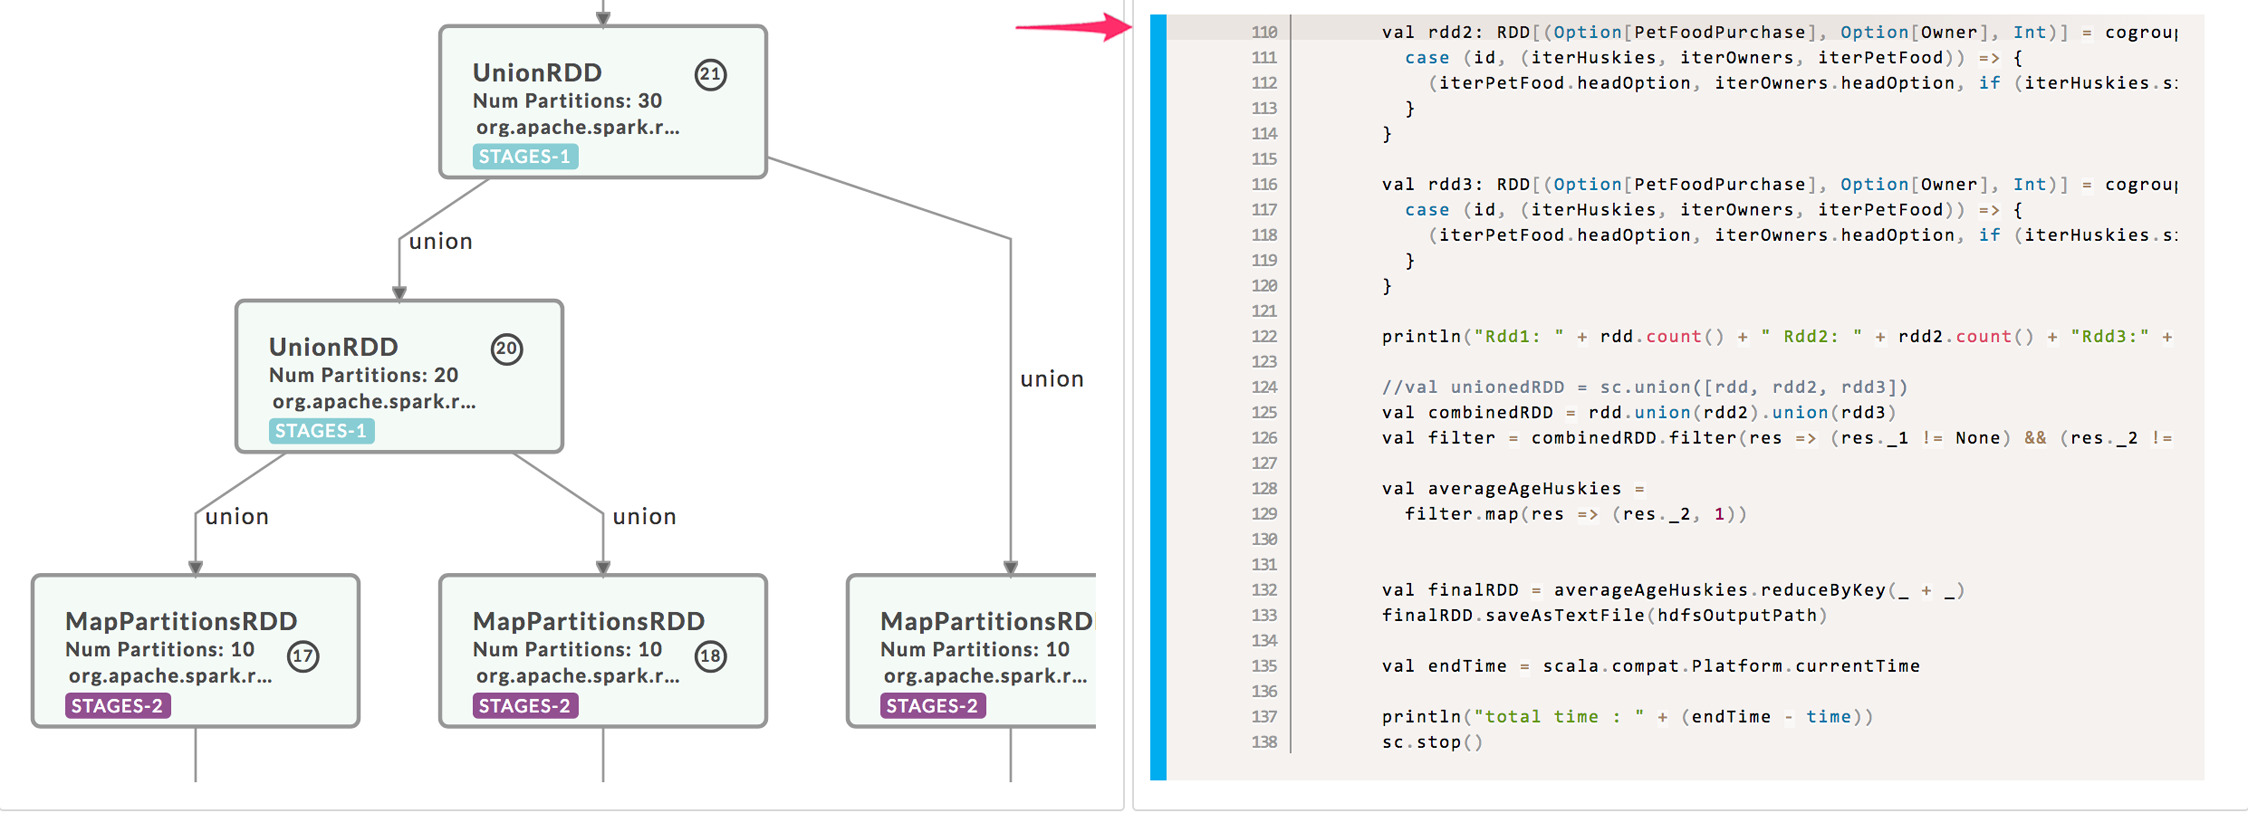
Execution: The execution graph shows an RDD DAG of the app. The app's RDDs are represented by the vertices while the edges are the Operations to be applied. Any particular RDD can involve multiple stages so there isn't a one-to-one mapping between an RDD and stages. The graph is "linked" to the Program tab. If the source code is available, clicking on a vertex brings up the source line associated with the RDD.
If the program tab displays the code it is linked with the DAG. Display the execution and program tab simultaneously, click the vertex to highlight the relevant code. Here we see the corresponding code for vertex 18.
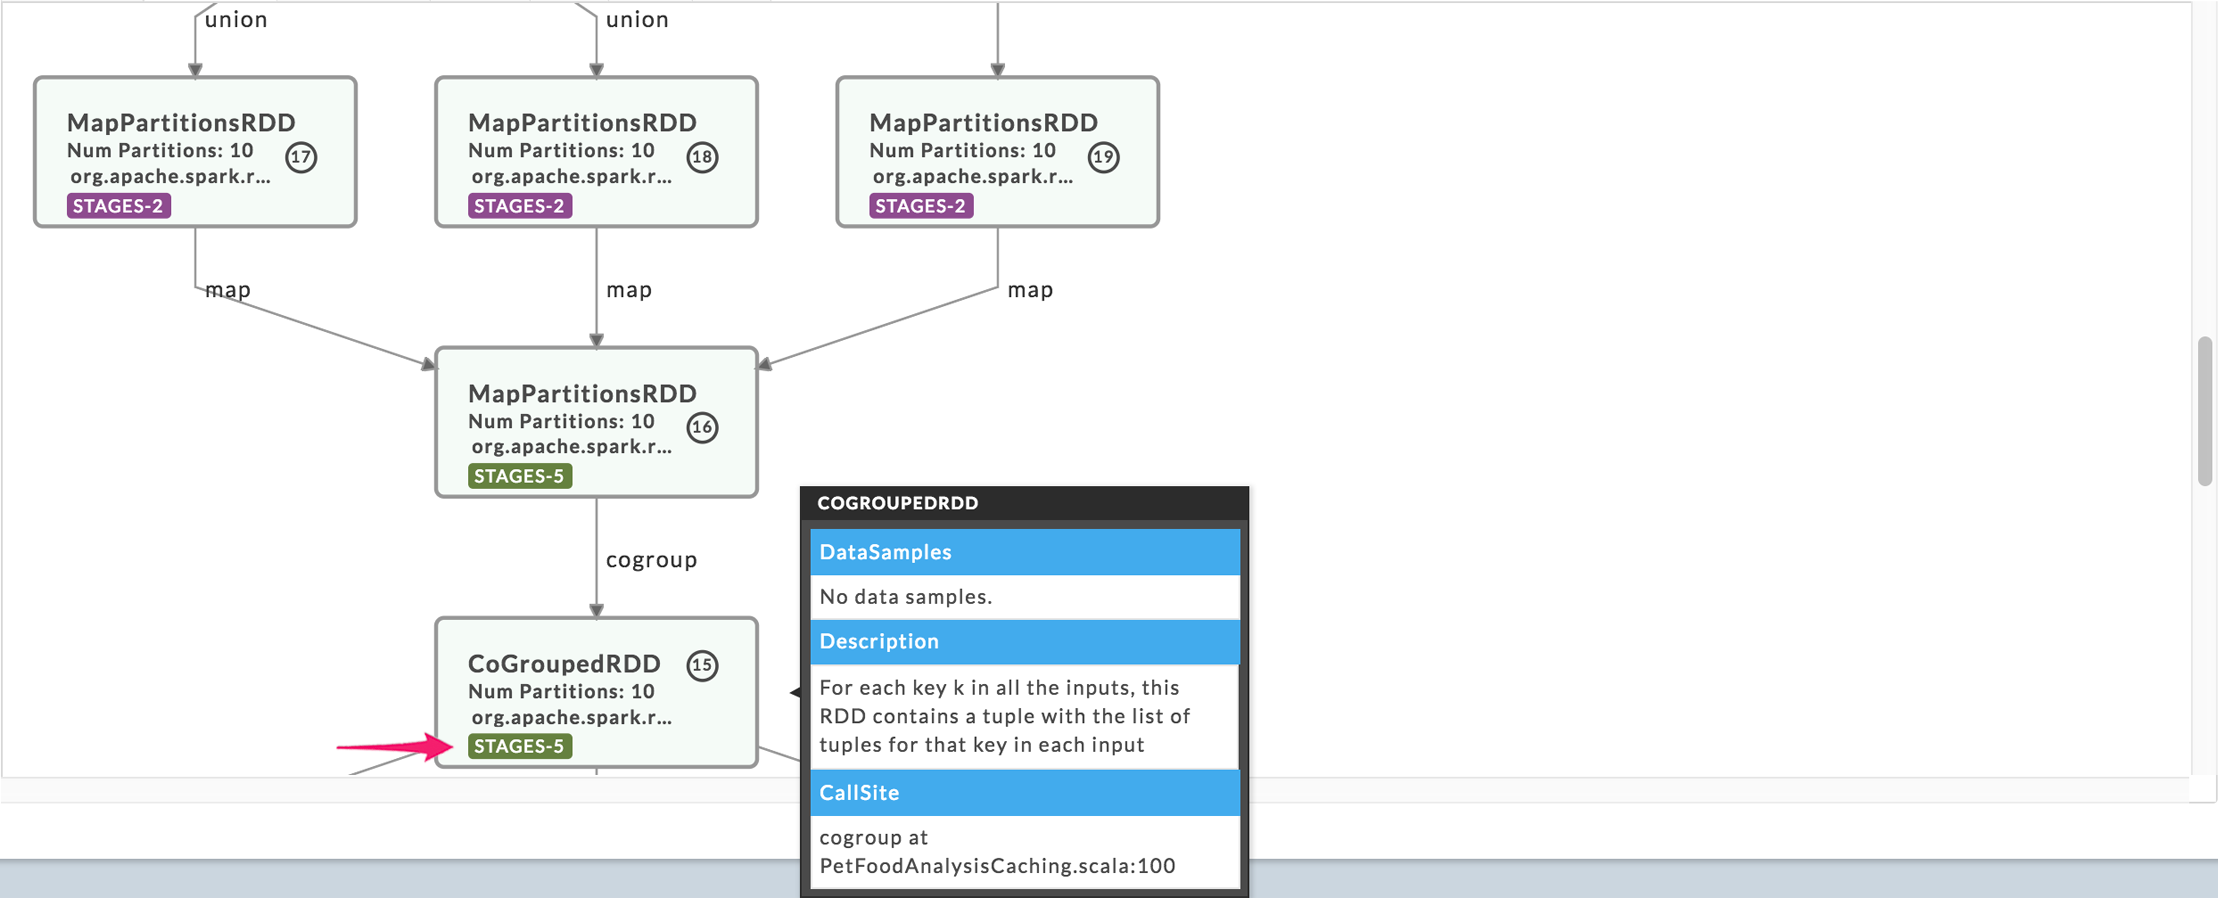
We expanded the above area, and vertices 15-19 are shown (the vertex number is noted in the circle). The vertex lists the type of RDD, partitions used, Spark call, and the number of stages which were involved. The RDD represented by vertices 17-16 involved two stages, while 15-16 had five. Hover over the vertex to bring up an information box, containing the RDD description and CallSite (source line) which called the RDD transformation.
Note
The execution graph isn't displayed when there are more than 1000 RDDs in the generated DAG.
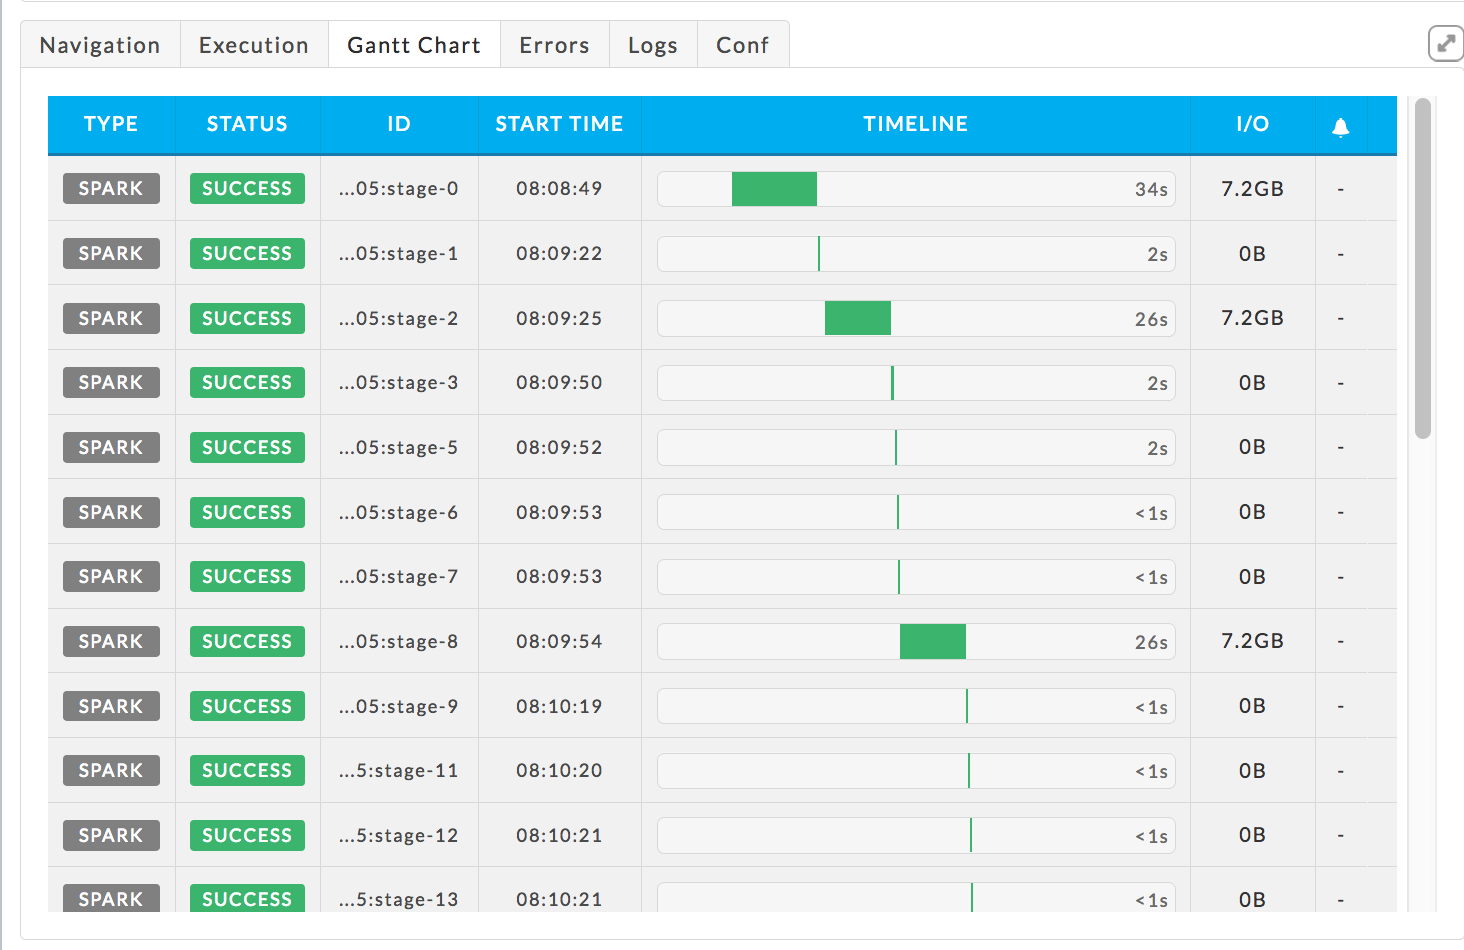
Gantt Chart:
Displays the stages using a Gantt Chart. The table is sorted on Start Time in ascending order.
Errors, Log and Conf Tabs: For an explanation of these tabs see Errors, Logs, and Conf.
Four Tabs
Program: When available it displays the program associated with the app. See above for an example of this tab and its relation to the Execution graph.
Task Attempts, Graphs, and Resources: For an explanation of these tabs see Task Attempts, Graphs, and Resource.
Spark SQL-Query
Key performance indicators
Events: is the number, if any, of Unravel insights for the query. See here for more information.
Duration: The "wall clock" time it took for the app to complete.
Data I/O: The memory used.
# of Stages: The number of stages in the query.
Left tabs
As of Unravel 4.5.2.0, a left-hand tab isn't displayed when no data available, for example, there is no Conf tab when no configuration information is available.
Navigation: The app's jobs with their relevant KPIs: Status, Start Time, Duration, Partitions/Tasks (
), DFS Read, DFS Write, # Stages. See above for more details.Execution: A execution graph of the query. There are times when the DAG is too large to display and it will be noted. See above for more details.
Gantt Chart: Displays the stages using a Gantt Chart. For more details see above.
Errors, Log, and Conf Tabs: For an explanation of these tabs see Errors, Logs, and Conf.
Right tabs
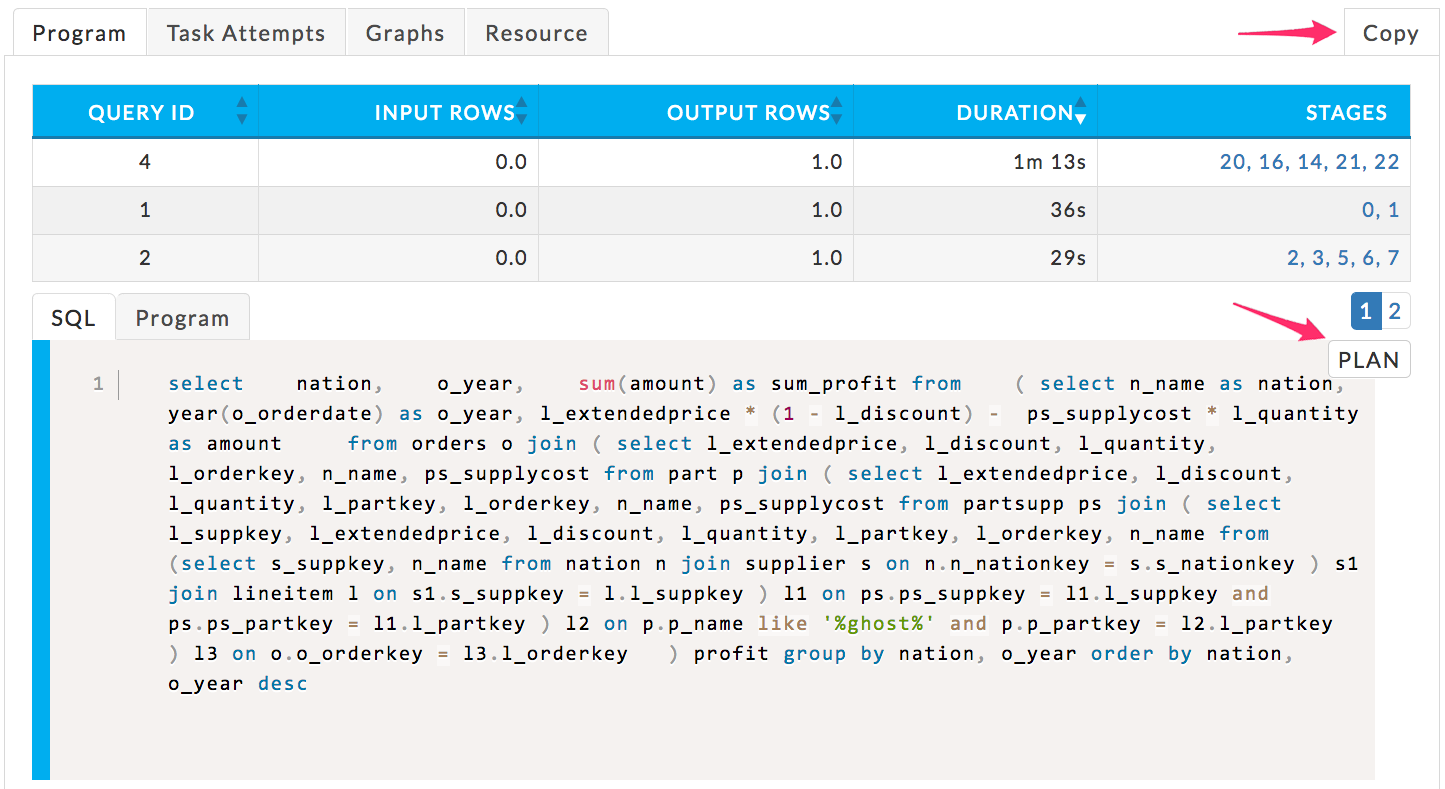
Program: This tab connects all the pieces of the SQL query. The table lists all queries with significant KPIs and the top five stages, i.e., the stages with the longest duration. Beneath the list are two tabs, SQL and Program The SQL tab displays the SQL query in either query or plan mode. The Program tab lists the query's corresponding Program. For a particular query, the SQL query text, Program, and stages are linked.
By default:
The Query table is sorted on the query's duration in descending order. Similarly, the stages are sorted on duration in descending order left to right.
The SQL tab is displayed using the query view. The query with the longest duration (first row) is shown.
Unravel loads whatever information is available, even if the information is incomplete.
Click the Query ID to display its SQL and program. Click the stage to display its Spark Stage Detail. See Spark Stage Details for further information on the stage view. To switch between SQL Query and Plan view, click the plan/query button in the upper right-hand corner of the SQL window. To copy the SQL query to your clipboard click the Copy button. You don't have to have the query view showing in order to copy it.
This screenshot shows the default window, the SQL query for Query ID 4.
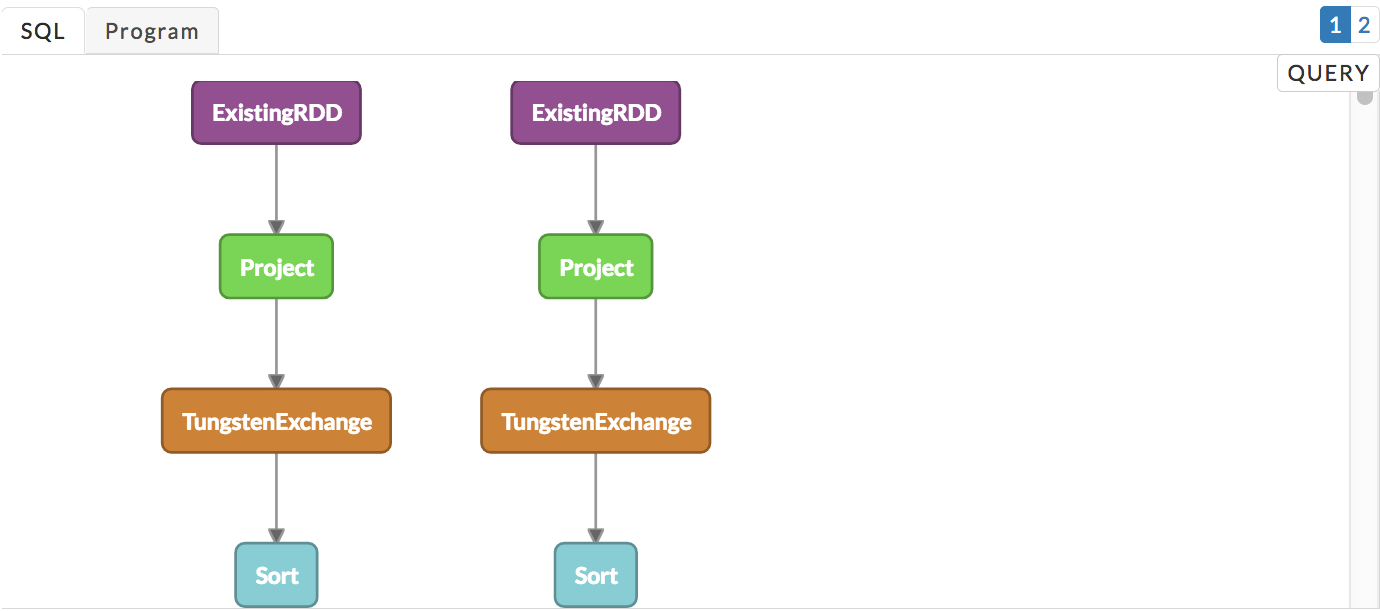
Scroll down to see the entire SQL Plan. Click Query to return to the program.
Task Attempts, Graphs, and Resources: For an explanation of these tabs see Task Attempts, Graphs, and Resource.
Spark Streaming
You can toggle the UI's refreshing a running app. This lets you examine and drill down in the app without the refreshing interfering. Click  to toggle the refresh state.
 |
 |
Key performance indicators
The KPIs refer to the entire Spark job composed of jobs which in turn have stages.
Events: Is the number, if any, of Unravel insights for the query. See the here for more information.
Duration: The total time to process all stages. (The wall clock time can be calculated from the start and end times are on the left-hand side of the job bar.)
Data I/O: Total data read and written by the query.
Number of Jobs: The number of jobs that make up the streaming.
Number of Stages: The number of stages that make up the streaming.
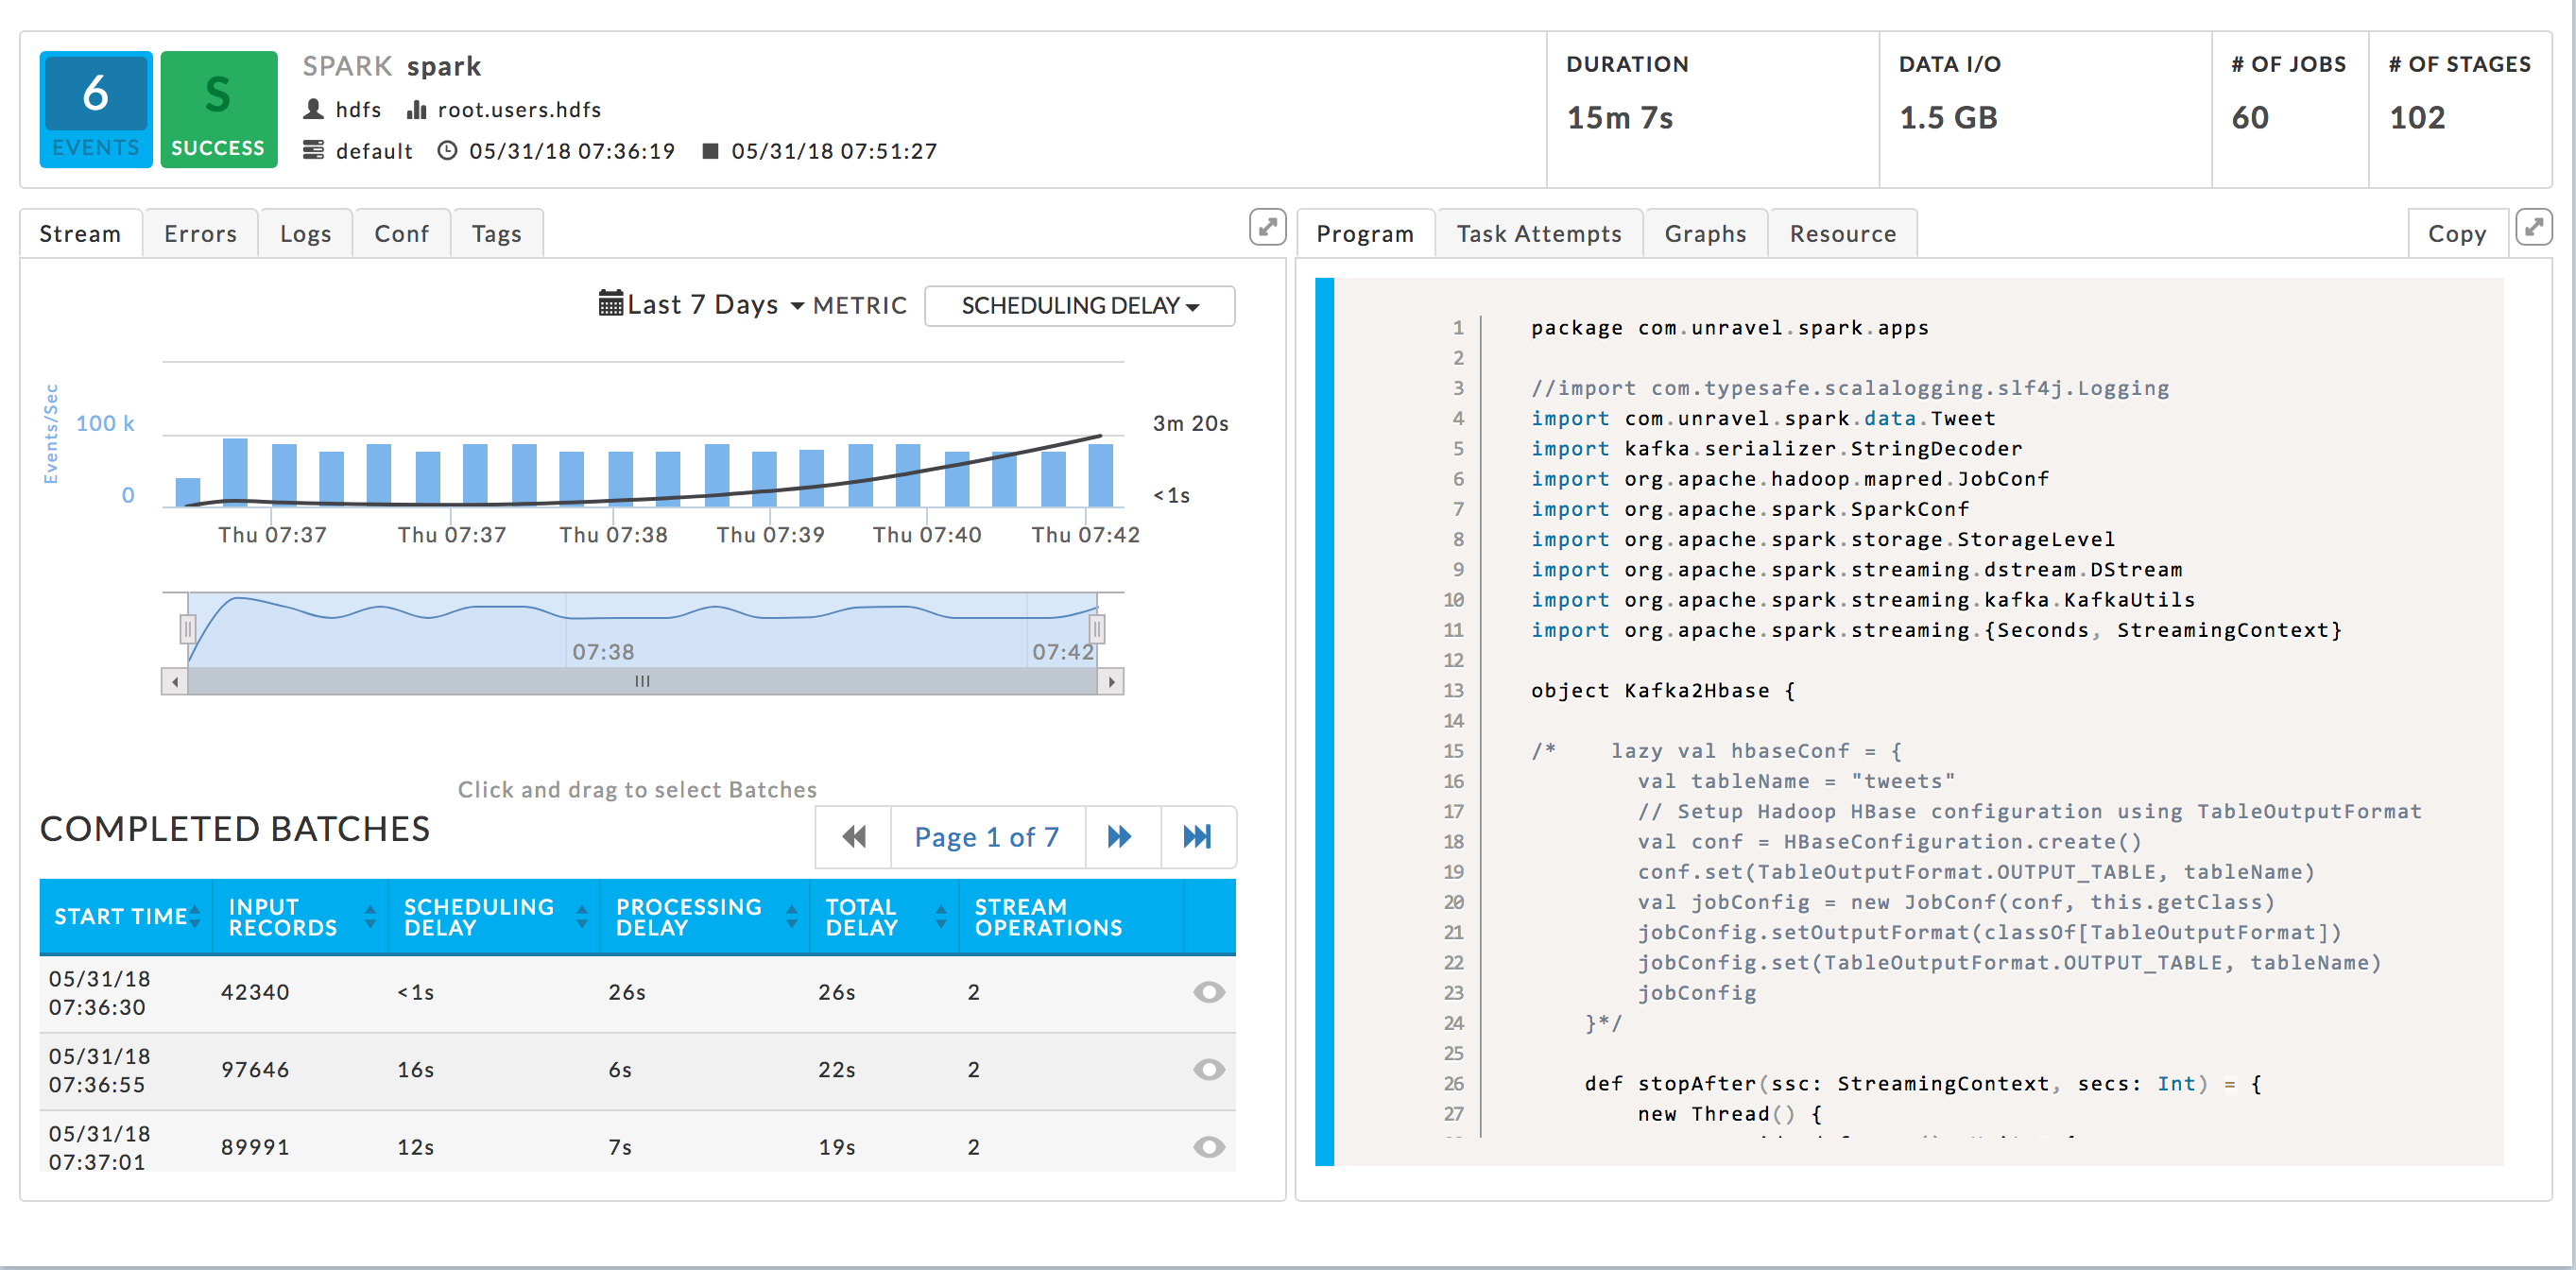
Unlike other Spark Application Managers, this has a Stream tab on the right. The manager opens displaying the Stream tab on the right and the Program on the right.
Left tabs
As of Unravel 4.5.2.0, a left-hand tab isn't displayed when no data available, for example, there is no Conf tab when no configuration information is available.
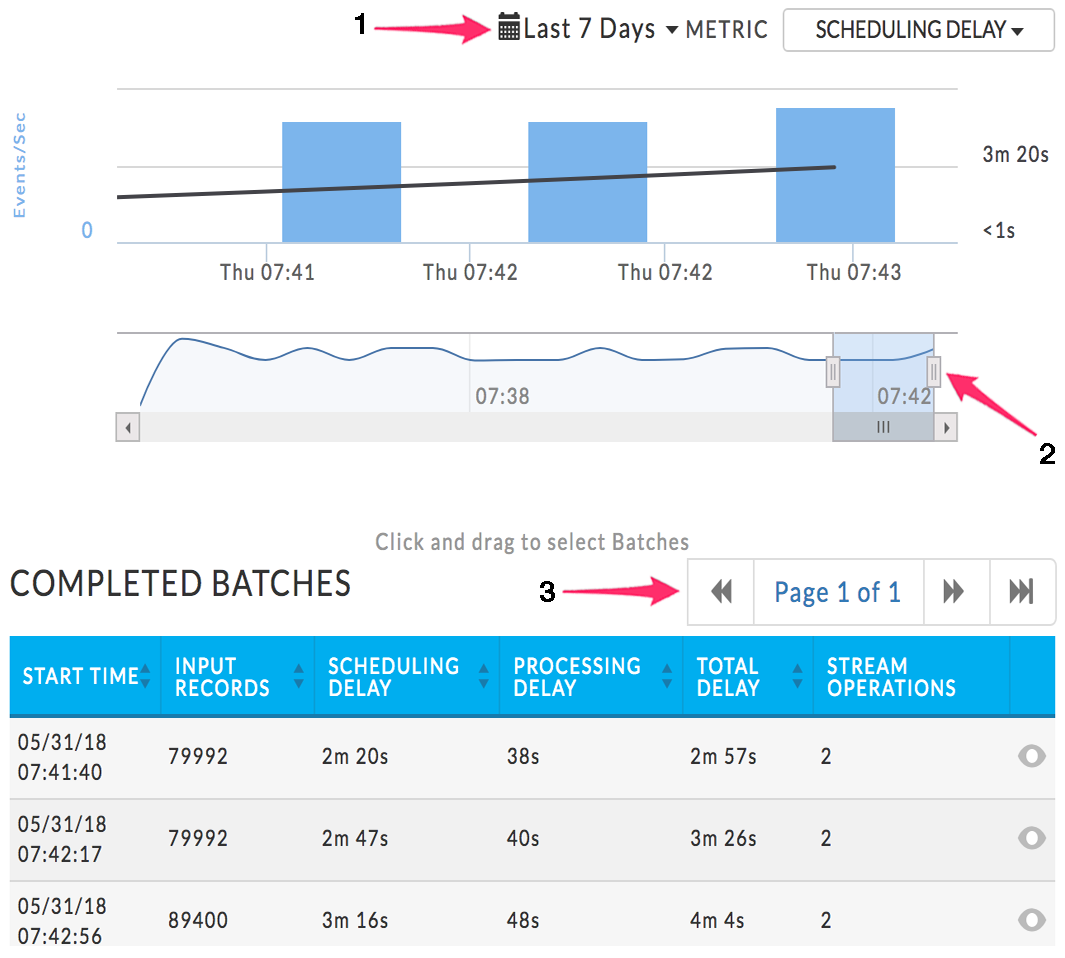
Stream: Displays the core of a Streaming Application. From here you drill down into the batches, the main processing unit for Spark streaming. The graph displays the number of events/second (the bars) with a superimposed line graph of the chosen metric. By default, Scheduling Delay is used. You can change the date range to display or the metric used via the Metric pull-down menu (1). You can choose Scheduling Delay, Processing Time or Total Delay. In the following example, the graph is displaying Scheduling Delay Time.
It has two sections; by default, they display the entire run over the last 7 days. You can zoom in on a section of the graph by pulling the tabs left or right (2). The table lists the Completed Batches relevant to the time period selected. Each batch has its KPI's listed. In the view above, the entire stream time is displayed, therefore all Completed Batches are displayed and in this case, there are seven pages. In the example, we have zoomed in on the last two minutes, the table now lists the batches completed in that time period. The tables now contain only one page, versus the seven above.
The table lists only the first three batches, but you can page through the table (3). By default, the streams are sorted on start time in ascending order. When you sort the batches, they are sorted across all tables, i.e., if Start Time is switched to descending list, nth batch becomes the first, the n-1 the second, etc.
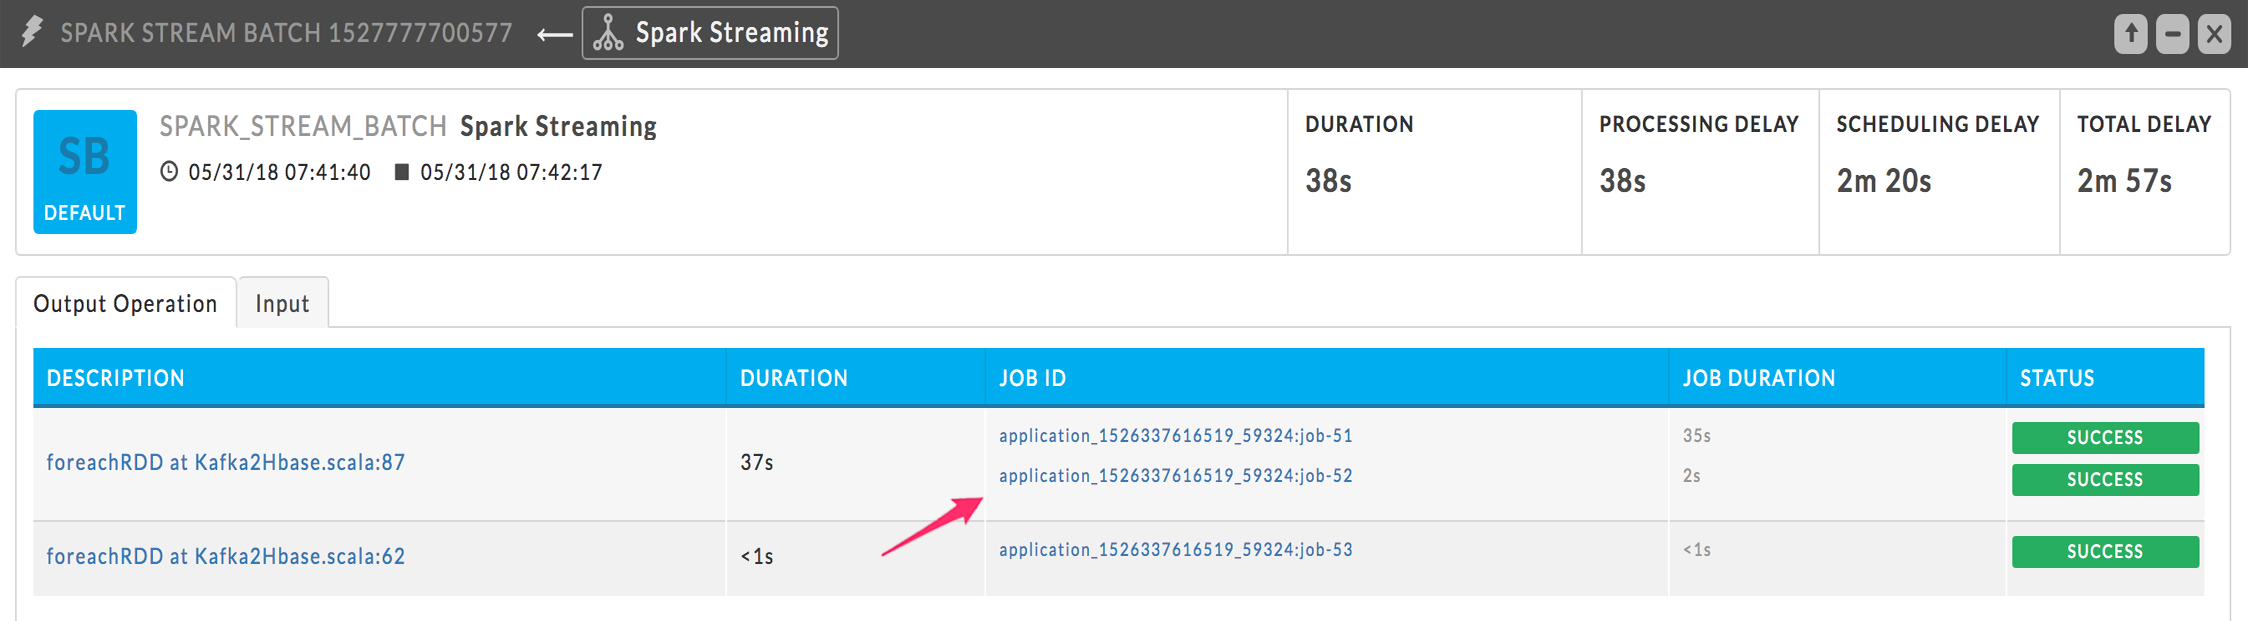
Click a batch to bring up the Spark Stream Batch tile. You can only open one batch job at a time. The batch window lists all the jobs associated with the batch and the batch's metadata. Its title bar notes it's a Spark Stream Batch view and that it's part of a Spark Streaming app. The KPI's, Duration, Processing Delay, Scheduling Delay, and Total Delay refer to this Batch job. It has two tabs, Output Operation and Input.
This example is of the batch in the first line of the table above. The Stream Batch has two calls and the first call has two jobs. Since these jobs are run in parallel, the job with the longest time determines the duration of the batch. The description notes the RDD and the call line; clicking on the description displays the associated code in the program window. Click the Job ID to see the Spark Job information.
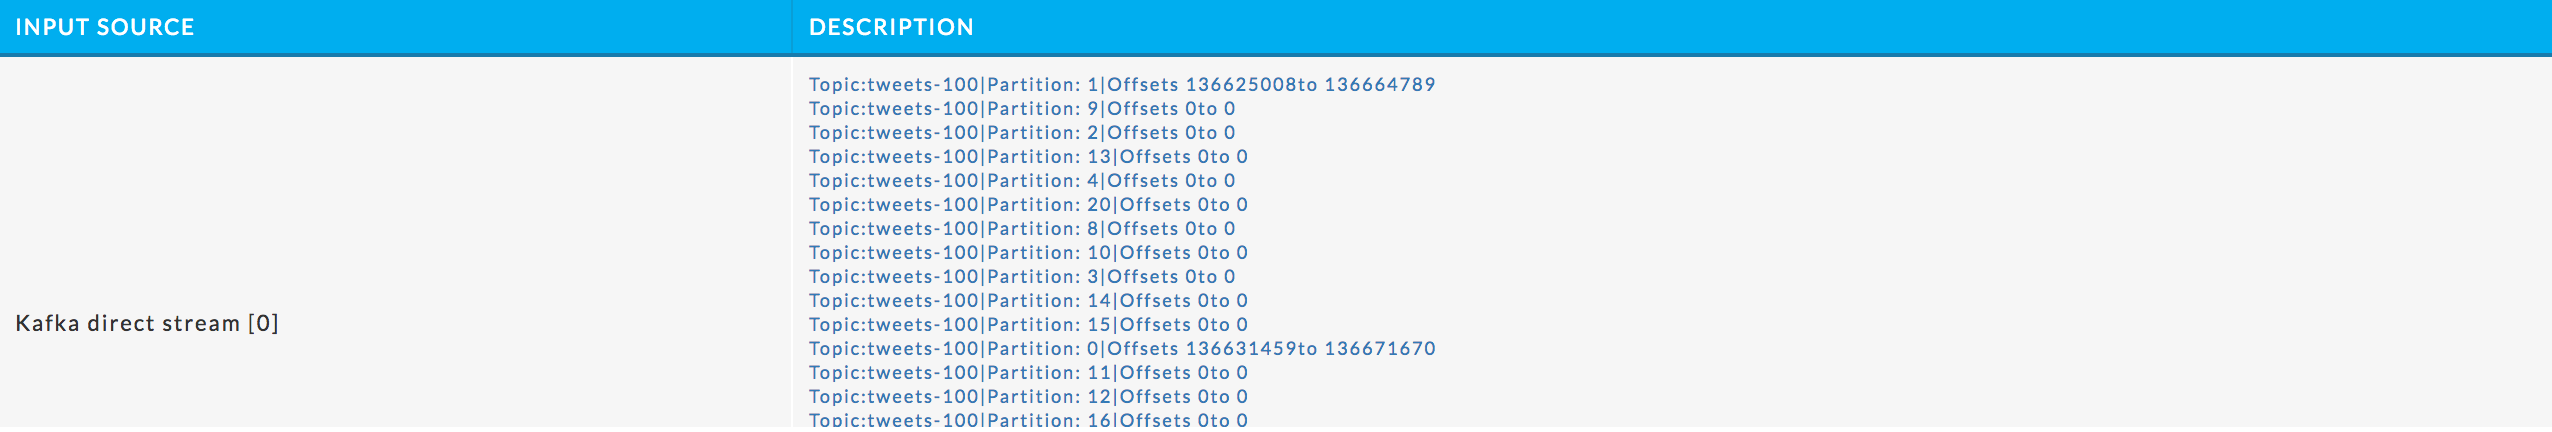
The Input Tab lists all the Topics consumed.
Errors, Log, and Conf: For an explanation of these tabs see Errors, Logs, and Conf.
Right tabs
Program: The program (if uploaded by the user) is shown in this tab.
Task Attempts, Graphs, and Resources: For an explanation of these tabs see Task Attempts, Graphs, and Resource.