Data insights
Data Insights provide data-level insights including a snapshot of tables and partitions over the last 24 hours within a historical context.
Overview: Provides a quick view of the tables' and partitions' sizes.
Details: Drills down into the tables.
Note
See Common UI Features for general information and common features about Unravel's UI.
Overview
The Overview Dashboard gives a quick view of the tables' and partitions' sizes, usage, and KPIs. It has two sections.
Table KPI
Partition
The time period used to populate the page is noted in the upper right-hand corner and the tooltips.
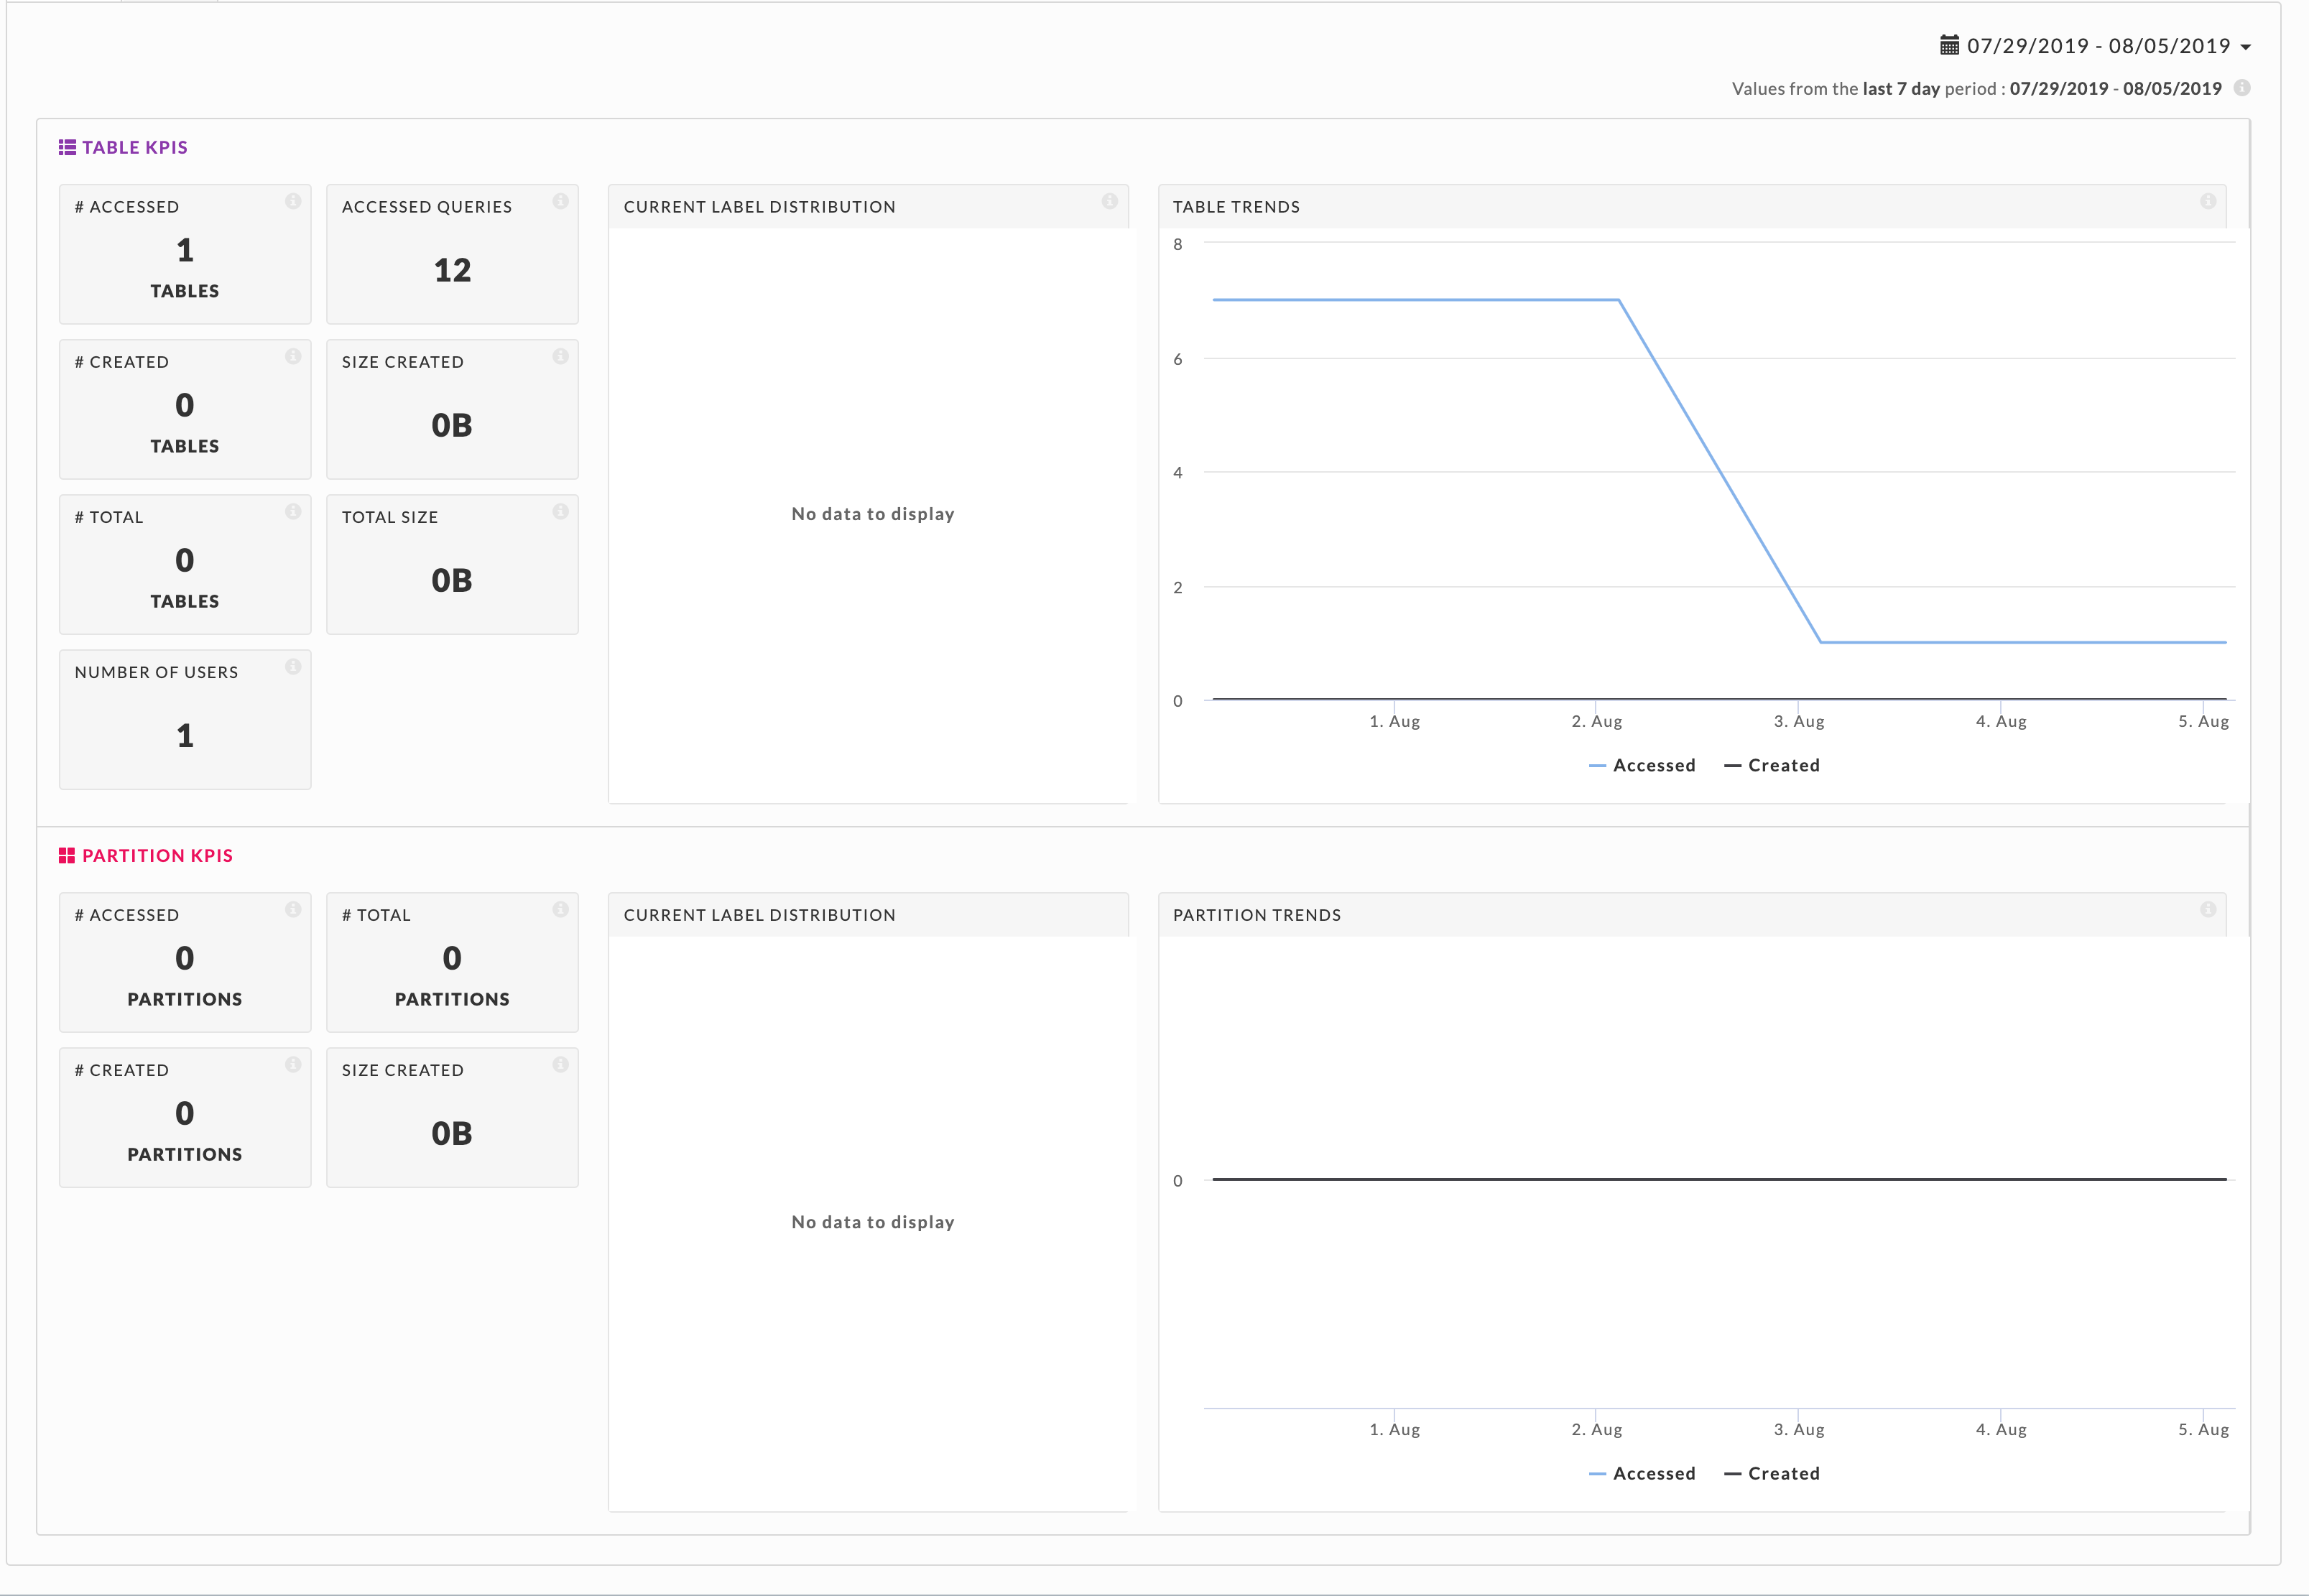
Both Table and Partition KPIs sections contain:
# Accessed: Number of tables/partitions accessed.
# Created: Number of tables/partitions created.
Size Created: Size of tables/partition created.
# Total: Total number of tables/partition currently in the system.
The Table KPIs also contains:
Accessed Queries: Total number of queries accessing the tables.
Total Size: Total size of all the tables.
# of Users: Number of users in the last 24 hours.
These display the Current Label Distribution for the tables/partitions. See Configuration for the operating definition of the labels. The graph shows the relationship between the labels; hover over a label to see the total of tables/partitions with that label. Below we see that three tables are warm.
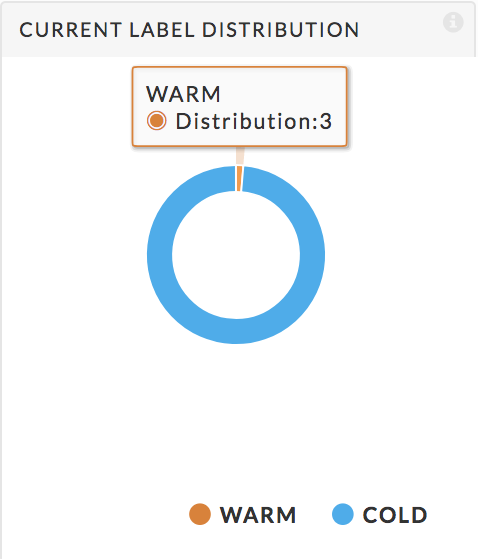 |
They display the Table Trends and Partition Trends over the time range.
Details
The details tab has two sections, a graph, and a table list. By default, the graph uses the Total Users metric and displays the first table in the list. The list is sorted on Total Users in descending order. You can also use the metrics Total Users, Total Apps, or Total Size to display the graph. The Total Apps metric (corresponding Apps column in the table) is the total number of Hive and Impala queries on the table.
Use the Metric pull-down menu to select Total Users, Total Apps, or Total Size as the metric to the graph. Click Reset Graph to revert to displaying the first table using the Total Users metric. Select the menu bars to print or download the graph as an XLS or CSV file. Select the checkbox next to the table's name to display the table information. You can select tables over multiple pages. In the example below we have selected the first three tables.
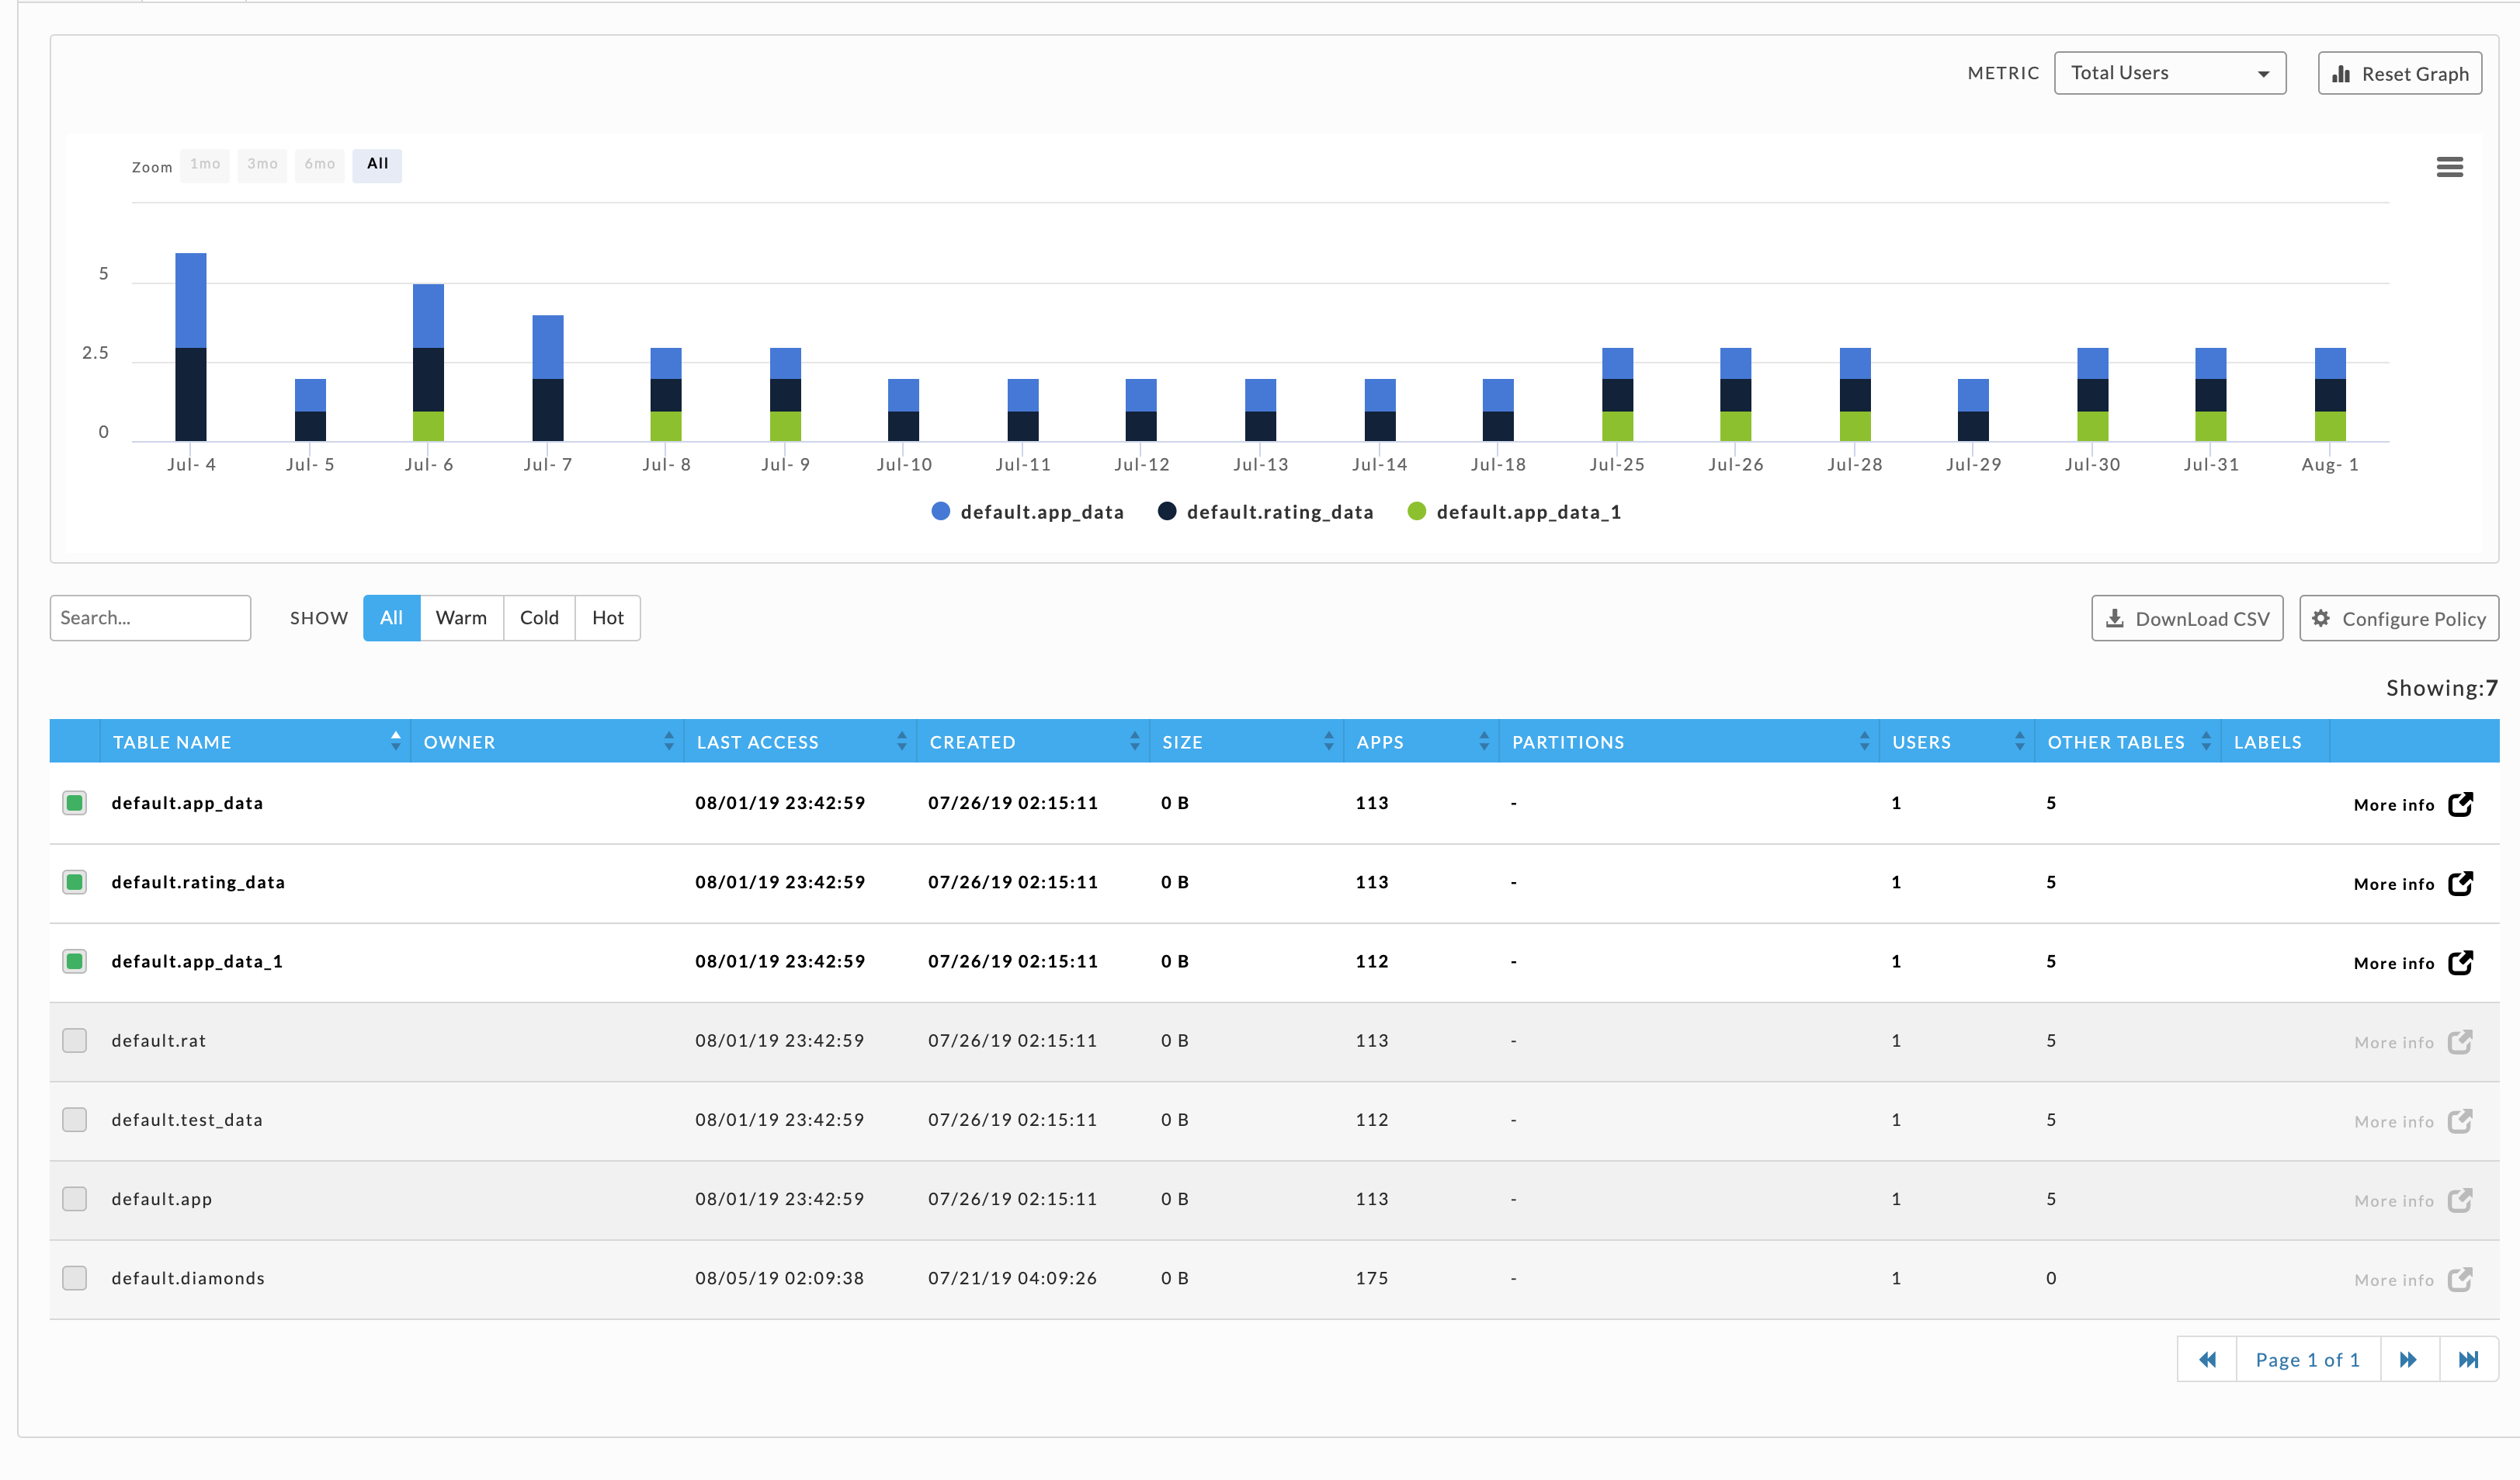
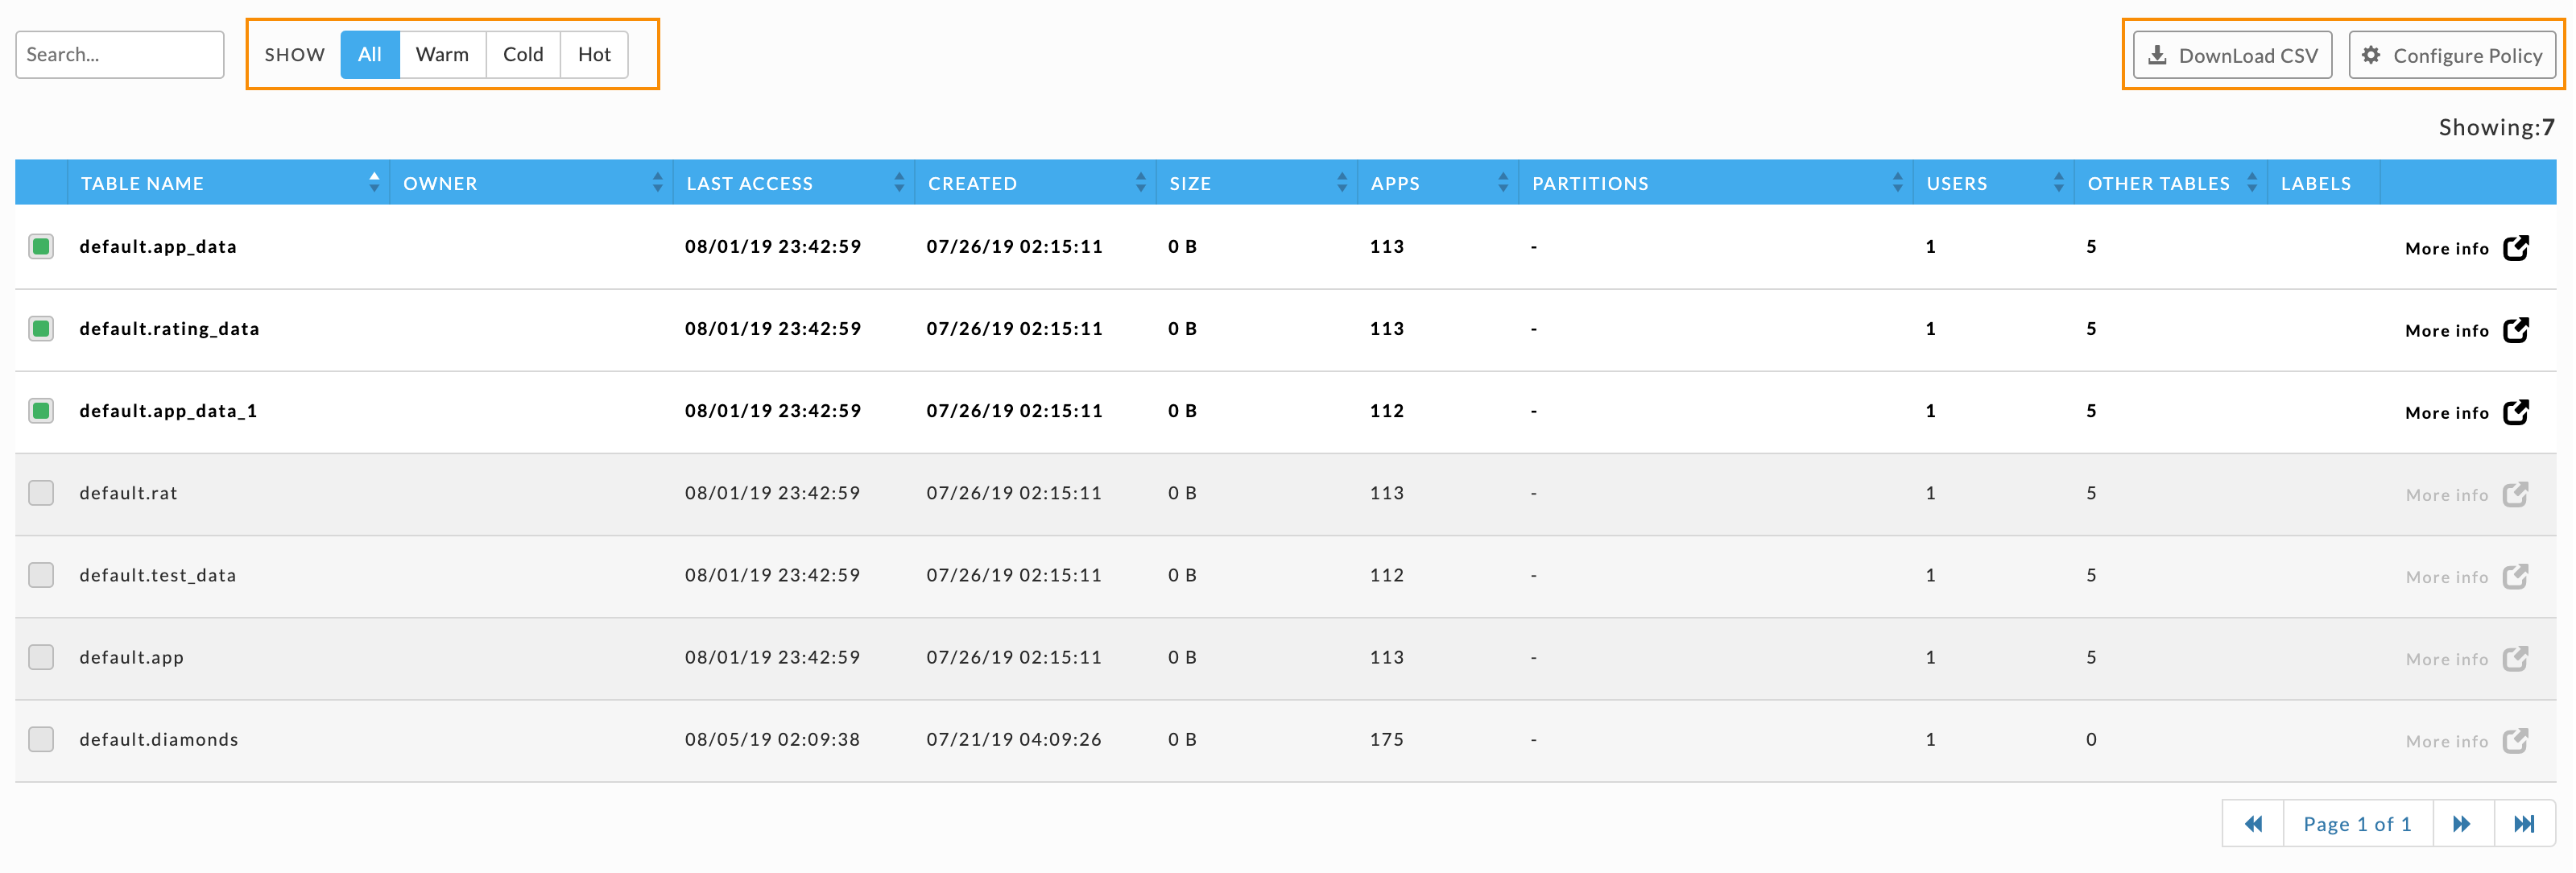
Between the graph and the table list you can choose how to filter graphs and tables based upon their table activity, All, Warm, Cold, or Hot. Click Download CSV to download the table. Click Configure Policy to set the conditions for determining whether a table is Warm, Cold, or Hot.
You can Search by string; any table matching or containing the name/string is displayed. All is selected below, so every table is shown. You can sort the list by the various metrics in ascending or descending order. By default, the list is sorted on Table Name in ascending order. If you have selected a table, the More Info glyph is available. Click it to display the Table Detail view. Click Configure Policy to edit the label rules or Download CSV to download the table list.
This view:
Summarizes table usage and access metric.
Lets you to browse trends (KPIs).
Drill down into apps that used the table.
Lists both Hive and Impala queries.
The first table in the list above is used for the examples below.
The panel's top row lists the table name, start date/time, and the name/path. Hover over the name/path to display the complete path. Three KPIs are displayed: Users, # Apps, and Size.
There are three tabs, Table Detail, Partition Detail, and Retention Detail (1); the default view is the Table Detail. Use the Metric pull-down menu to select Total Users, Total Apps, or Total Size as the metric to the graph. The Application Detail lists the apps that accessed the table in the given time range.
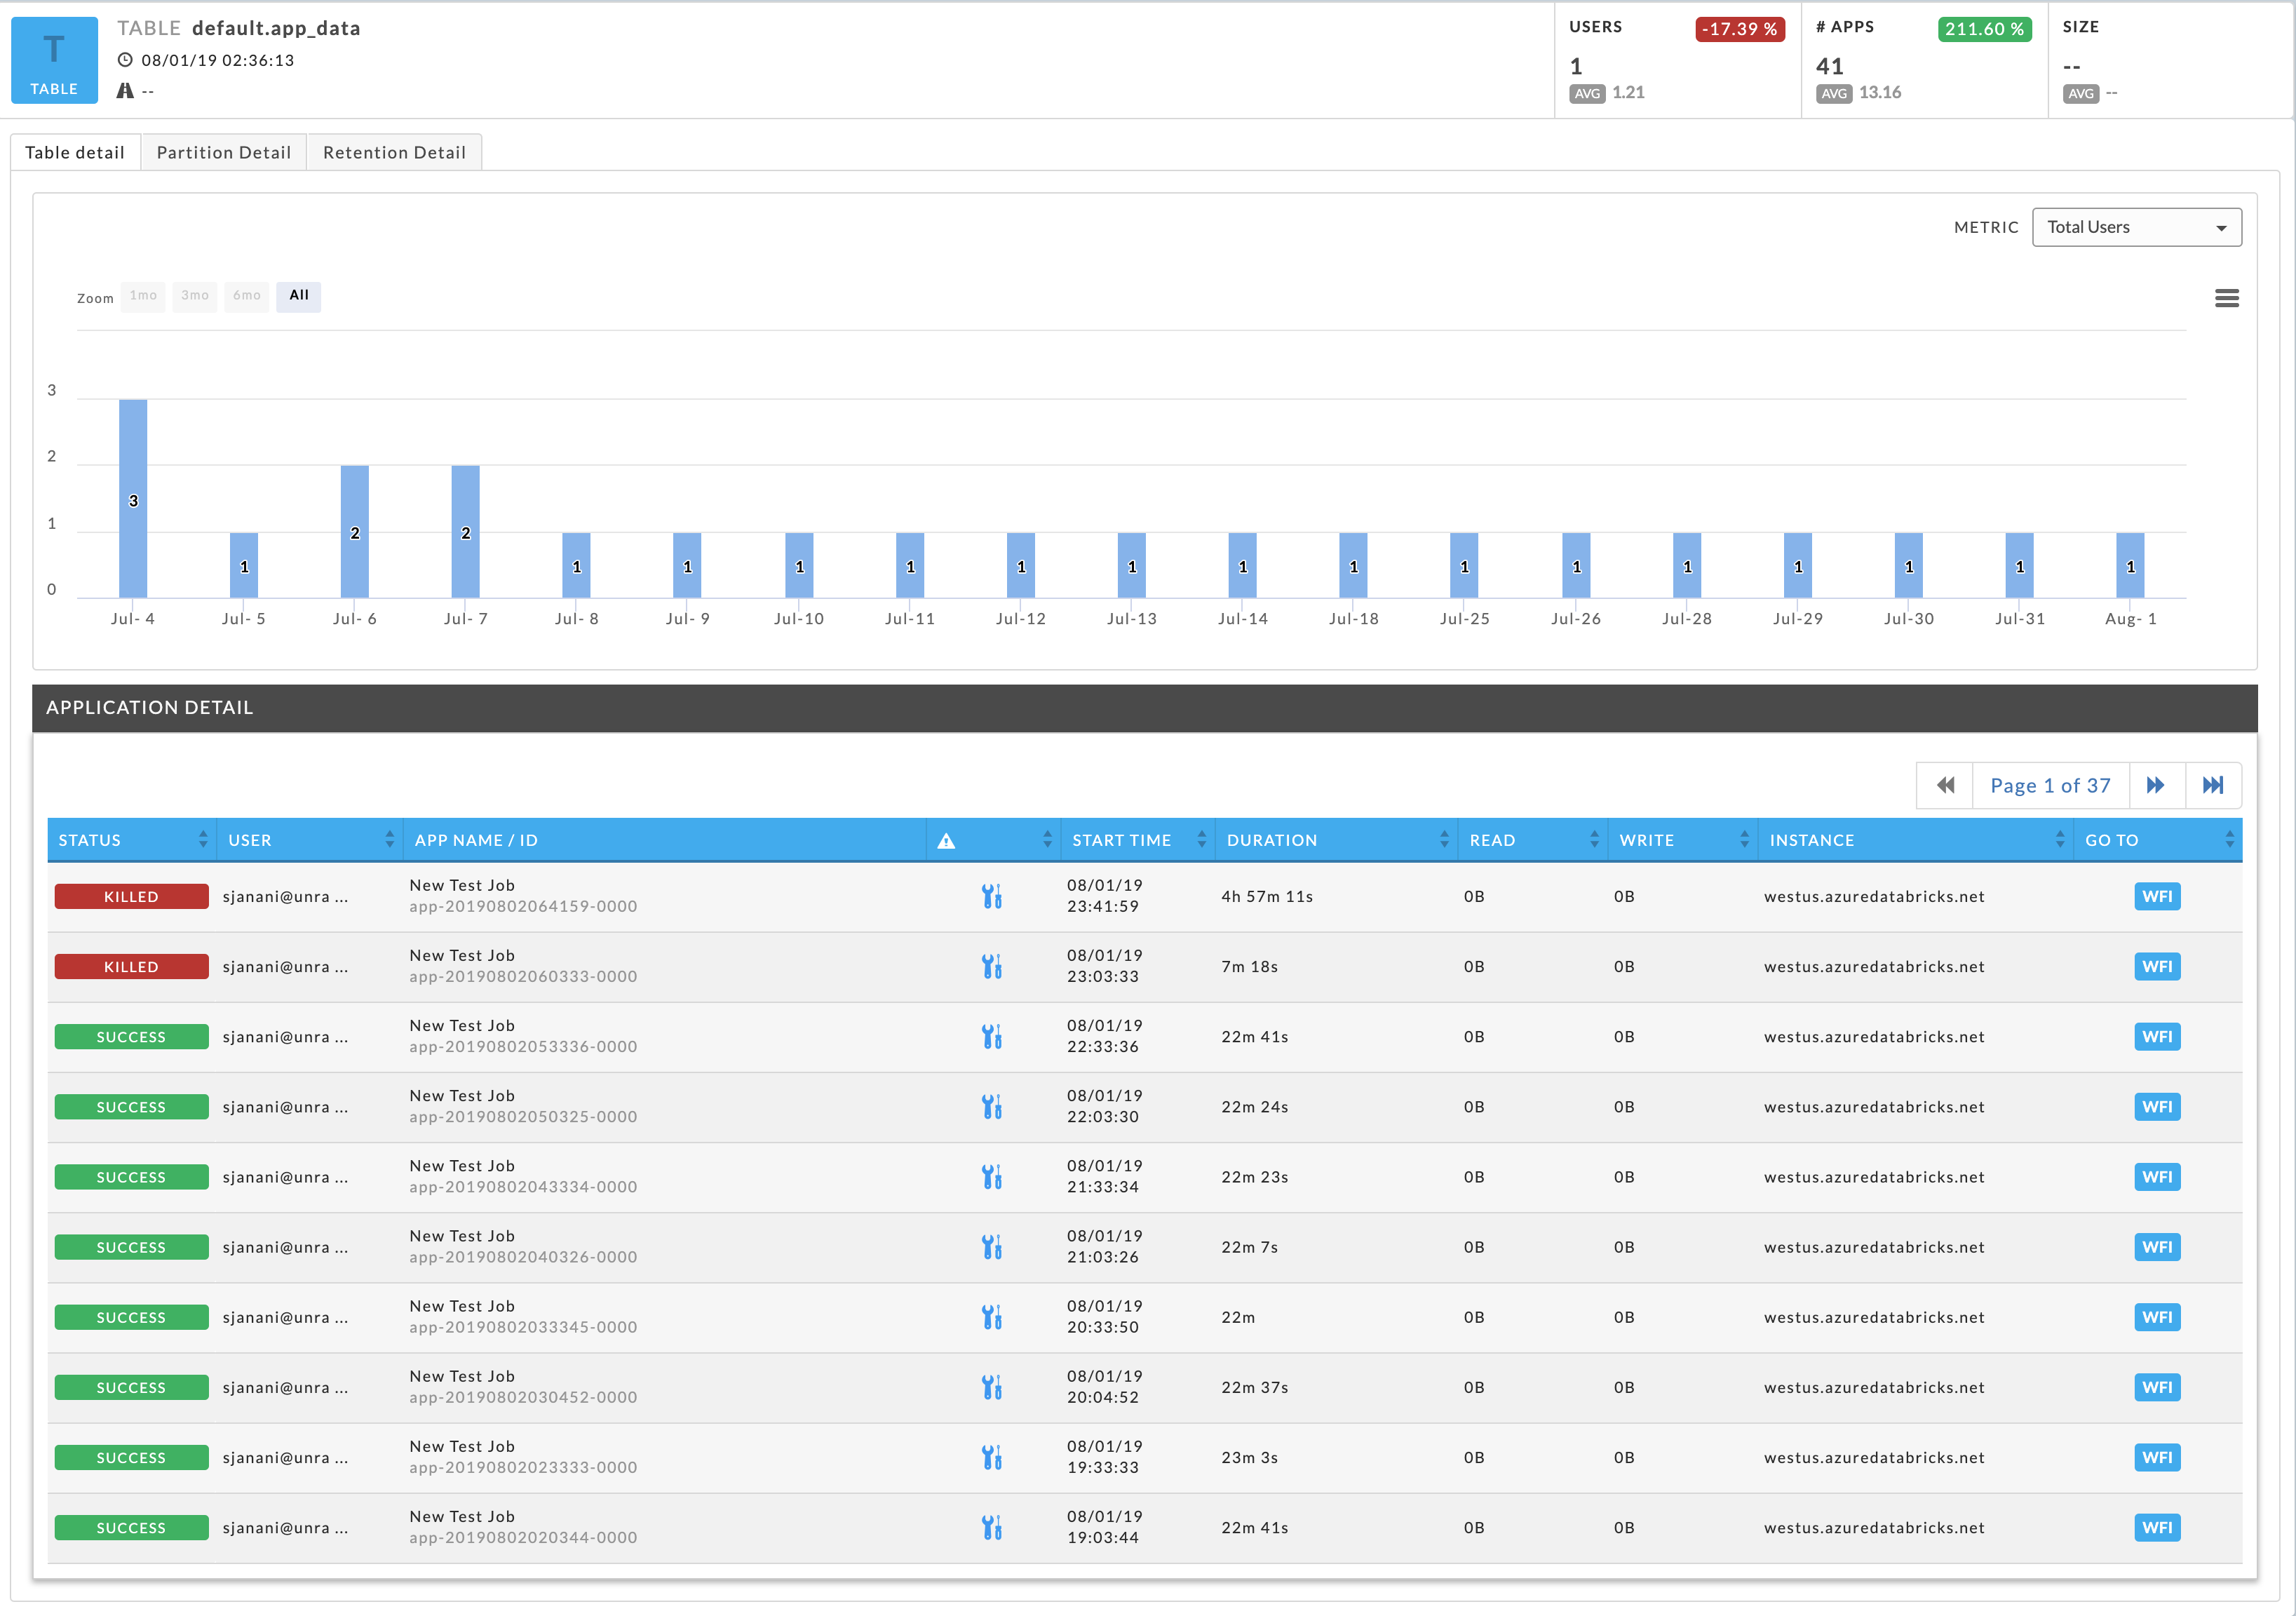
The Partition Detail and the Retention Detail give an analysis of each.
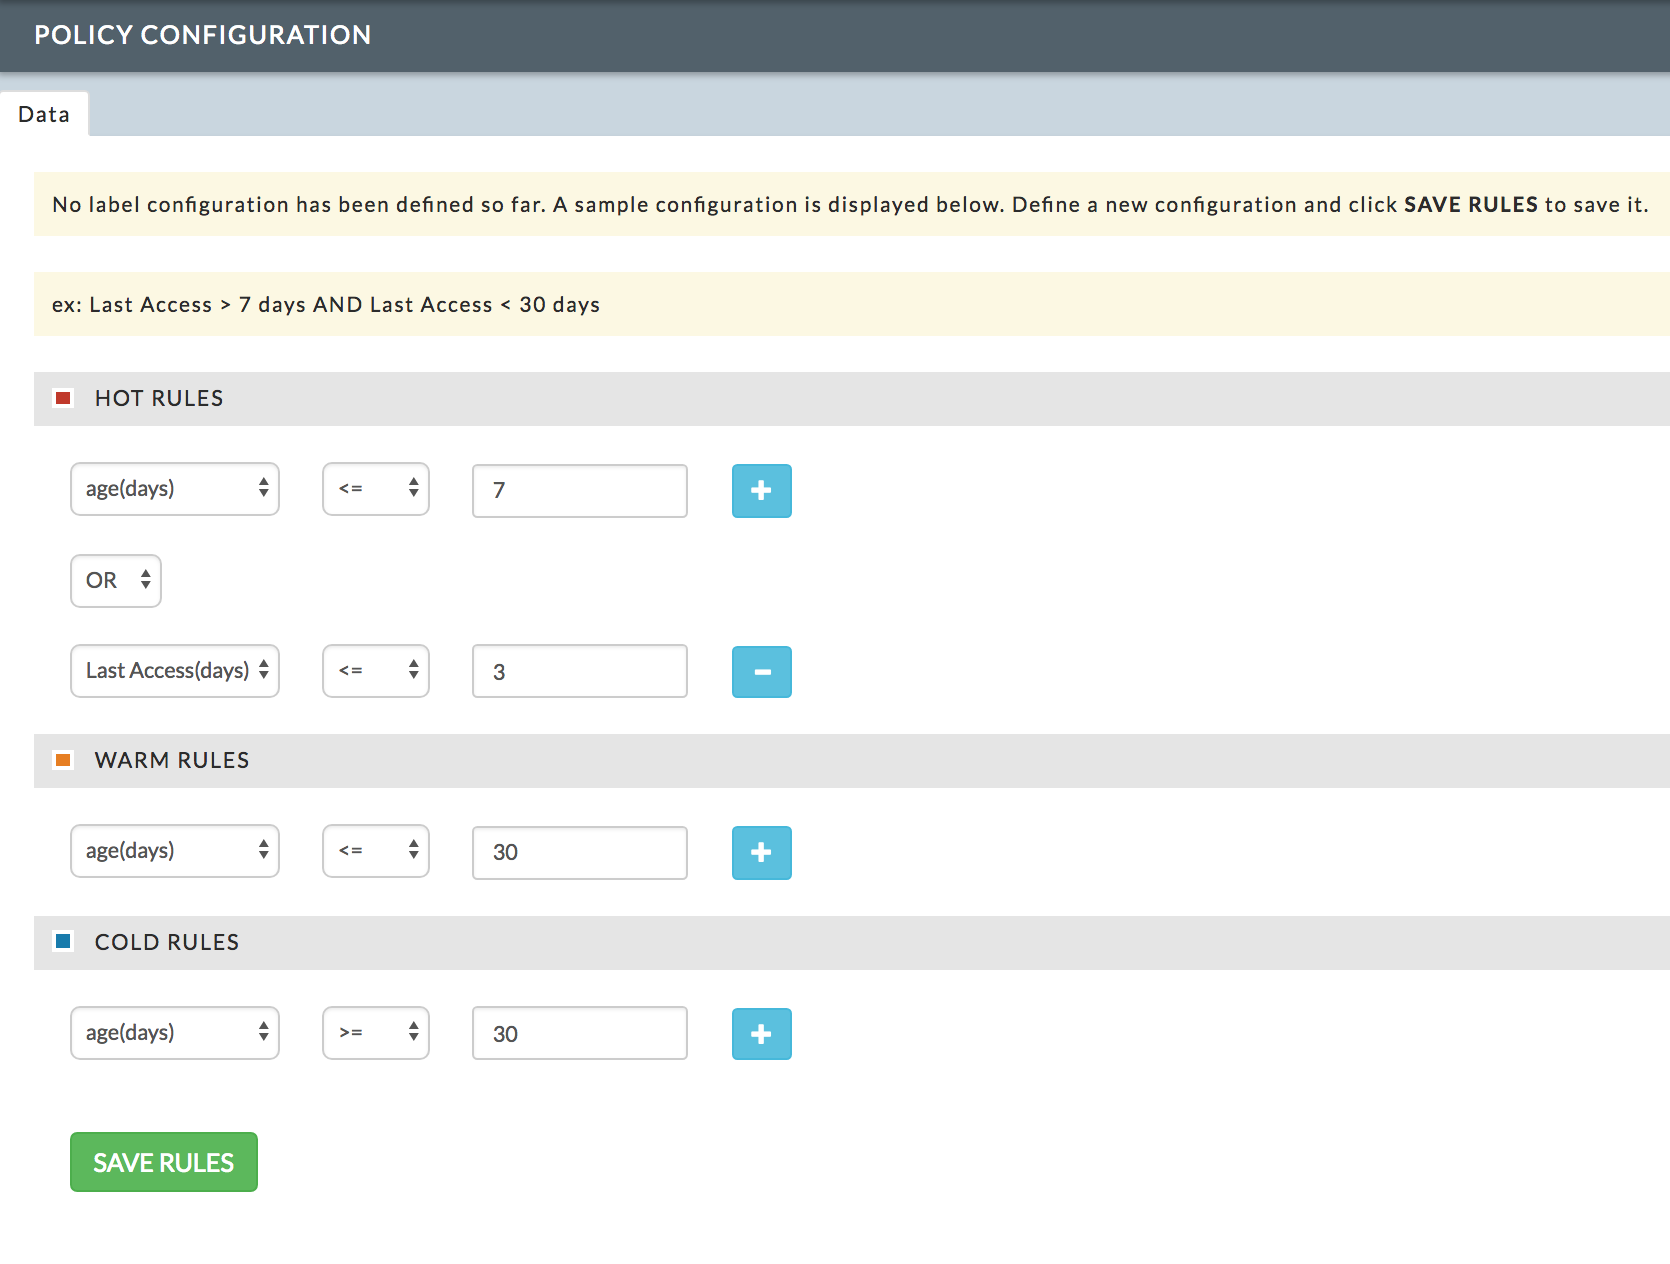
This pane lets you define the rules for labeling a Table/Partition either Hot, Warm, or Cold. These rules are used for the Donut chart and in the Details tab.
While the labels are immediately associated with the Tables/Partitions, the Overview Dashboard donut charts typically populate within 24 hours.
You access this modal pane from the Data > Details tab. The rules are defined per label and you can define up to two rules per label. To define a rule:
From the pull-down menus, choose the following:
Age (days) or Last Access (days)
Comparison operator: <= or >=.
Enter the number of days.
To add a second rule:
Click the Plus button,
Select the AND or OR operator from the pull-down menu, and
Repeat steps 1 and 2.
To delete a second rule, click the Minus button.
Click Save.